Rep:Mod:jd1910
Computational Lab Module 3- Characterising Transition State Structures By James Davies
Introduction
The ability to model transition states is a purely quantitative phenomena important in developing a deep understanding of the mechanism by which a reaction can occur and justifying measurable properties, such, as the rates of reactions. Chemist's ability to model transition state structures has been enhanced by computer programs that enable the modelling of potential energy surfaces by calculating the energies and optimal structures of molecules involved in a chemical reaction (from reactants through to the desired product product). These optimisation calculations are reinforced by calculations of the gradients and double derivatives (frequency analysis) at point on the potential energy surfaces.
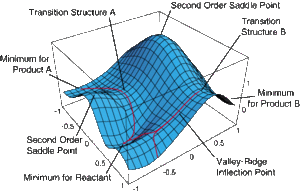
In this project, the transition state structure for two key organic reactions shall be characterised on the potential energy surface using the Gaussian interface GaussView 5.0. The two organic reactions in question are the Cope Rearrangement and the Diels-Alder Reaction. Gaussian works by adopting quantum mechanics to form a Born-Oppenheimer potential energy surfaces to represent molecular structures by plotting the relative energies against the reaction coordinate. The reaction coordinate, or reaction path, is defined the path linking the minima optimum molecular strutcures in reaction, stable intermediates and transition states. The Born-Oppenhemier potential energy surface (example shown below) invokes some degree of approximation and is used for large molecule (i.e. those containing more than three atoms) as these molecules contain too many degrees of freedom for a fully discrete surface. This surface is then used to characterise the structures as a reaction progresses. Frequency analysis of optimal transition state structures will show one large negative frequency. This informs us that the structure is a maxima with respect to one direction on the potential energy surface.
The Cope Rearrangement
The Cope rearrangement is a form of sigmatropic rearrangement, a [3,3]-sigmatropic rearrangement, where 1,5-dienes are heated. The electrons are reorganised seeing the migration of a sigma bond with the simultaneous movement of pi electrons to the opposite side of a pi system. The occurance of this type of rearrangement is governed by orbital symmetry. The reaction mechanism is shown in figure (a) with the two possible transition state structures it is believed to go via.

To conclude, the rearrangement is a concerted reaction believed to occur without the formation of an intermediate with the bonds formed and broken simultaneously. In this part of the project the lowest energy reactants, transition states are products are going to be found by performing optimsiation calculations on their geometries in order to uncover the actual mechanism of the Cope rearrangement.
Optimising the Reactants and Products By Comparing 1,5-Hexadiene Conformers
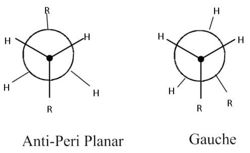
1,5-Hexadiene has two dominant confomers that it prefers to adopt being gauche and app (anti-peri planar). These confomartions are explained in figure (b) using Newman projections. By optimising the 1.5-hexadiene structure using Gaussian, a range of of these app and gauche conformers can be found and characterised in terms of energy and symmetry. I am going to begin by investigating the app arrangement. NOTE- I have been provided with a table providing these different optimal app and gauche conformers in 'Appendix 1'[2].
Optimising app 1,5-Hexadiene
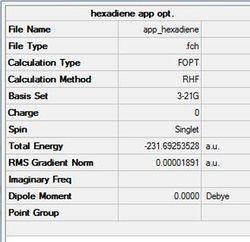
In GaussView 5.0 an anti-peri planar arrangement of 1,5-hexadiene was drawn. This structure was then 'Cleaned-up' an optimised using the Hartree-Fock method and 3-21G basis set with the %mem set to 250 MB. The structure and results are shown in the table (a) and figure (c) below.
Pentahelicene |
Figure (c)- First app conformer optimised
Data below shows calculation went to completion.
 Item               Value     Threshold  Converged?
 Maximum Force            0.000060     0.000450     YES
 RMS     Force            0.000010     0.000300     YES
 Maximum Displacement     0.000515     0.001800     YES
 RMS     Displacement     0.000171     0.001200     YES
 Predicted change in Energy=-2.037169D-08
 Optimization completed.
The D-space can be found here D-Space
The optimised conformation is seen to have a Ci point group symmetry. This indicates that there is an internal conversion within the molecule. This structure is in line with anti2 in 'Appendix 1' [2]. There are further app conformers available for the 1,5-hexadiene to populate. These structures have been found and are presented in table (d).
Optimising Gauche 1,5-Hexadiene
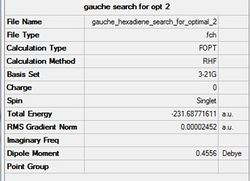
A gauche arrangment arrangment of the 1,5-hexadiene was drawn in GaussView 5.0. The 'cleaned-up' structure was then optimised using the Hartree-Fock method and 3-21G basis set with the %mem set to 250 MB. The optimal calculated structure and results are shown in figure (d) and table (b).
Pentahelicene |
Figure (d)- First Gauche conformer optimised
Data below shows calculation went to completion.
 Item               Value     Threshold  Converged?
 Maximum Force            0.000014     0.000450     YES
 RMS     Force            0.000005     0.000300     YES
 Maximum Displacement     0.000904     0.001800     YES
 RMS     Displacement     0.000283     0.001200     YES
 Predicted change in Energy=-1.179345D-08
 Optimization completed.
The D-space can be found here D-Space
The optimised conformation is seen to have no symmetry indicated in the C1 point group. Strangely, it is seen that the anti-peri planar conformation is higher in energy then the gauche arrangement. This is not expected as theoretical analysis would dictate the anti-peri planar arrangement to be the most stable due to favourable orbital overlaps e.g. σ(C-C)/π*(C-C). I must emphasise that this structure is not necessarily the most optimal gauche conformer which will be investigated in the next section.
Searching for optimal Gauche confomer
I am now going to qualititavley investigate what the optimum gauche conformation may be. My understanding is that the factors that will cause the gauche conformer to be optimal are: the favourable van der waal 'Sticky' interactions between hydrogens (such as those at the two 1 and 6 carbons) and the stabilisation via hyperconjugation maximised by internal app interactions (could be σ(C-H)/π*(C-C)). Based on these parameters I am going to draw a proposed structure in GaussView 5.0 and optimise it. Using this structure as a starting point, a number of gauche structures will be investigated to try and find the optimal gauche structure.
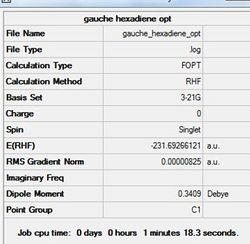
The optimal gauche conformer calculated using Gaussaian is shown below (optimised using the Hartree-Fock method and 3-21G basis set with the %mem set to 250 MB). Gauche hexadiene opt summary.jpg
Pentahelicene |
Figure (e)- Gauche3 conformer optimised
Data below shows calculation went to completion.
 Item               Value     Threshold  Converged?
 Maximum Force            0.000057     0.000450     YES
 RMS     Force            0.000013     0.000300     YES
 Maximum Displacement     0.001728     0.001800     YES
 RMS     Displacement     0.000447     0.001200     YES
 Predicted change in Energy=-4.130760D-08
 Optimization completed.
The D-space can be found here D-Space
The optimal gauche conformer has been found. The molecule is seen to have a C2 symmetry maximising favorable hyperconjugation and Van der Waal interactions whilst compromising steric clashes.
All the possible app and gauche conformers are shown below in table (d) including those uncovered during my investigation to find the optimal gauche conformer. Those conformers uncovered by myself in Gaussian are shown using J Mols.
| Gauche Conformers |
|
|
|
|
|
| ||||||||||||||||||
| Energy (Hartrees) | -231.68772 | -231.69167 | -231.69267 | -231.69153 | -231.68962 | -231.68916 | ||||||||||||||||||
| Point group | C2 | C2 | C1 | C2 | C1 | C1 | ||||||||||||||||||
| app Conformers |
|
|
|
| ||||||||||||||||||||
| Energy (Hartrees) | -231.69260 | -231.69254 | -231.68907 | -231.69097 | ||||||||||||||||||||
| Point group | C2 | Ci | C2h | C1 |
The optimal gauche and app energies in the appendix are quoted as -231.68772 and -231.69254 Hartrees respectively. Gaussian calculated my app and optimal gauche structure to be -231.6925353 and -231.68771611 Hartrees respectively. These values are identical to those in 'Appendix 1'[2]. Based on the energies it is clear that the gauch3 and anti1 conformations are most stable. According to literature[3] this stability is a result of the interaction between a vinyl proton and a pi orbital,as well as, the favourable pi orbital overlap of the two double bonds. These interactions are what give the conformers the overiding stability. As anti1 has a negligible energy difference compared to anti2 I will continue to pursue anti2.
Higher Level Optimisation of Ci app Conformer
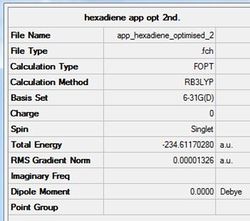
The app Ci conformer for 1,5-hexadiene calculated before has been optimised further using the DFT method and 6-31G (d) basis-set. This higher basis-set and DFT method allows a faster and more accurate calculation to be achieved. The optimised structure and data are shown below.
Pentahelicene |
Figure (f)- Ci optimised using a higher basis-set.
The energy is seen to be higher with the higher basis-set. This is purely due to the different optimisation method used where the d-orbitals are considered. The fact this value is higher indicates that the d-orbitals have a significant contribution to the optimum structure. When comparing the geometries of the two optimised Ci conformers, there is no visible distinction between the two other than their relative energies with the higher basis-set giving a more stable conformer. However, when the bond lengths and values are viewed, there is a clear difference in the two structures (see Table (f)).
| Parameter | Lower Optimisation | Higher Optimisation |
| C-C (Å) | 1.51/1.55 | 1.50/1.55 |
| C=C (Å) | 1.32 | 1.3314 |
| Average C-H (Å) | 1.08 | 1.10 |
| C-C-C (°) | 111.35 | 112.67 |
| C=C-C (°) | 124.81 | 125.29 |
| Energy (a.u) | -231.6925353 | -234.6117028 |
There are clearly no significant differences in the bond lengths, however, enough of a difference to justify the DFT method being more accurate as the values measured are closer to the literature values[4]. the bond angles are seen to distort significantly from lower basis-set conformer on optimising using the 6-31G (d) basis-set.
The D-space can be found here D-Space Data below shows calculation went to completion.
 Item               Value     Threshold  Converged?
 Maximum Force            0.000015     0.000450     YES
 RMS     Force            0.000006     0.000300     YES
 Maximum Displacement     0.000219     0.001800     YES
 RMS     Displacement     0.000079     0.001200     YES
 Predicted change in Energy=-1.589075D-08
 Optimization completed.
Frequency Analysis of app Conformer
A frequency analysis was performed on the highly optimised Ci app 1,5-hexadiene, by changing 'Job Type' to 'Frequency'. The frequency values are shown below.
 Low frequencies ---  -18.6547  -11.7227    0.0004    0.0005    0.0009    1.8085
 Low frequencies ---   72.7269   80.1426  120.0208
Note how that the second line double-derivative is positive inferring that the minimum point on the potential energy surface has been reached and optimal structure formed. Furthermore, all the values in the first line are with the -15 to 15 cm-1 range indicating the calculation was successful.
The summary of the calculation is shown below.
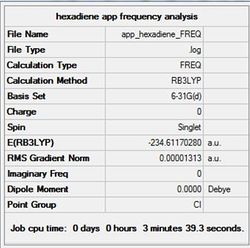
The D-space can be found here D-space
Data showing calculation went completion
 Item               Value     Threshold  Converged?
 Maximum Force            0.000036     0.000450     YES
 RMS     Force            0.000013     0.000300     YES
 Maximum Displacement     0.000227     0.001800     YES
 RMS     Displacement     0.000105     0.001200     YES
 Predicted change in Energy=-1.510799D-08
 Optimization completed.
The IR spectrum of the frequencies is illustrated below in figure (g)
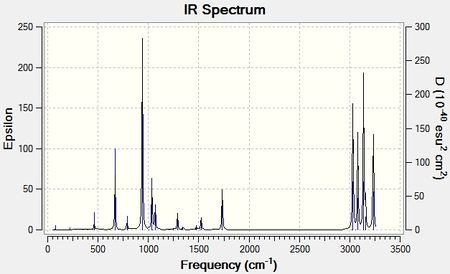

There are in total 21 vibrations, none of which are degenerate, which have an intensity so can be detected on the spectrum. An example is shown in figure (h) above. There are 41 vibrations in total however not all of these are IR active (i.e, there is no change in the dipole-moment on interaction with the IR wave)
Another useful peice of information that can be extracted from the frequency analysis is the thermochemical data. This will be used to calculate the activation energy of the chair transition state later.
Thermochemical data of the conformer, at the 6-31G (d) basis-set, acquired from the frequency analysis is shown in figure (i).
 Zero-point correction=                           0.142491 (Hartree/Particle)
 Thermal correction to Energy=                    0.149847
 Thermal correction to Enthalpy=                  0.150791
 Thermal correction to Gibbs Free Energy=         0.110882
 Sum of electronic and zero-point Energies=           -234.469212
 Sum of electronic and thermal Energies=              -234.506916
 Sum of electronic and thermal Enthalpies=            -234.460912
 Sum of electronic and thermal Free Energies=         -234.500821
Figure (i)- Thermochemical Data
The lines containing 'Sum' information are of the most importance as they assist in calculating important values, such as, the activation energy of a reaction. The meanings of these values are summarised below.
Sum of electronic and zero-point Energies- the potential energy at 0K taking zero-point vibrational energy into account: E0 = Eelec + ZPE; Sum of electronic and thermal Energies- the energy at standard conditions including translational, vibrational and rotational contributions to the total thermal energy: E = E0 + Evib + Erot + Etrans; Sum of electronic and thermal Enthalpies- the energy containing a correction term for RT which is particularly significant when looking at dissociation reactions: H = E + RT; Sum of electronic and thermal Free Energies- the energy including entropic contributions: G=H-TS
DO CALCULATIONS AT 0 K
D-Space for 0 K calculation
Optimising the "Chair" and "Boat" Transition Structures
Up to this point the different gauche and app conformers of 1,5-hexadiene have been optimised. From this point forward, the two possible transition state structures, the chair and boat structures, will be optimised. A range of different methods have been tested and will be each be discussed in this report.
The three methods are:
Method 1- Performing an optimisation on a guess transition state structure using the 'TS Berny' function
Method 2- Freezing terminal coordinates of a guess transition state and optimising the rest of the structure before unfreezing and optimising the remaining structure
Method 3- Optimising using the QST2 method where the reactant and product structures are input to allow Gaussian to calculate a transition state structure (unlike previous two methods does not require generation of a guess structure).
after optimising the boat and chair transition states an Intrinsic Reaction Coordinate Method (IRC) will be run and used to predict the conformer that forms as a product due to the reaction dictated by the transition state structure.
To begin I am going to form my guess transition state structure for the chair transition state by optimising an allyl fragment.
Optimising Allyl Fragment
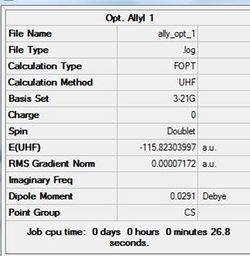
An allyl fragment has been drawn and optimised using the HF method and 3-21G basis-set. The summary of the calculation is shown in table (g) with the optimised structure in figure (j). As expected the structure is analogous to one half of the transition state structures in 'Appendix 2'[5].
Pentahelicene |
Figure (j)- Optimised allyl fragment.
The D-space can be found here D-Space
Data below shows calculation went to completion.
 Item               Value     Threshold  Converged?
 Maximum Force            0.000158     0.000450     YES
 RMS     Force            0.000051     0.000300     YES
 Maximum Displacement     0.001155     0.001800     YES
 RMS     Displacement     0.000350     0.001200     YES
 Predicted change in Energy=-1.262110D-07
 Optimization completed.
Optimising The Chair Transition State Structure Using Method 1
Using this allyl fragment I have roughly drawn the structure of a chair transition state for the Cope rearrangement. Gaussian has been used to optimise this proposed structure. The job type was set to 'Opt+Freq' and opitmization to 'TS (Berny)' with the method as HF and basis-set as 3-21G. The additional key word 'opt=noeigen' was also included to prevent the calculation from crashing if more than one imaginary frequency was detected/
The summary is shown in table (h) with the structure in figure (k).
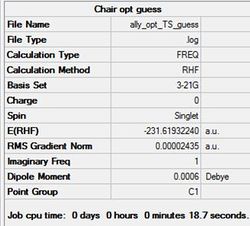
Pentahelicene |
Figure (k)- Structure of proposed chair transition state optimised
The frequency data is shown below.
 Low frequencies --- -817.9194   -1.7728    0.0004    0.0008    0.0009    1.3108
 Low frequencies ---    2.8862  209.5667  396.0144
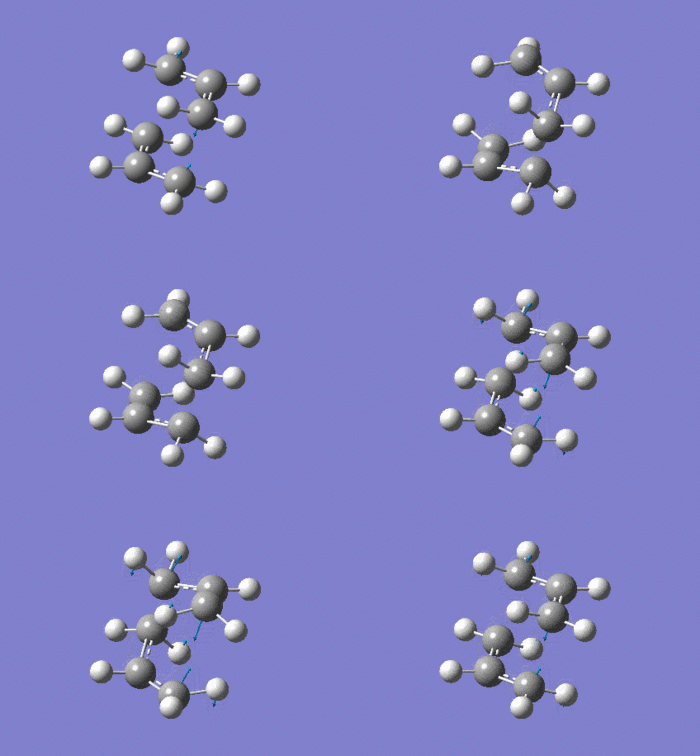
As expected the frequency data, above, shows the presence of an imaginary absorption at -817.92 cm-1 (ca. -818 cm-1); vibration shown in figure (l). This negative vibration is indicative of a transition state inferring the molecule to be a maxima in on direction. It can be seen that the vibration relates to the formation and cleavage of the sigma bond in the cope rearrangement. From the above data, the second line of low frequencies all have a positive value indicating the optimised structure.
The D-space can be found here D-Space
Data below shows calculation went to completion.
 Item               Value     Threshold  Converged?
 Maximum Force            0.000026     0.000450     YES
 RMS     Force            0.000005     0.000300     YES
 Maximum Displacement     0.001265     0.001800     YES
 RMS     Displacement     0.000154     0.001200     YES
 Predicted change in Energy=-7.958335D-08
 Optimization completed.
Optimising Chair Transition State Structure using Method 2
Again a guess chair transition state structure was drawn using the optimised allyl fragment. In the second method the coordinates between the two pairs of terminal atoms on the allyl fragments forming the proposed transition state where fixed to ca. 2.20 Å. This was achieved my setting the redundant coordinates to 'Bond' and 'Freeze Coordiantes'. This structure was then optimised to a minimum usinf the HF method and 3-21G basis set. The D-space for this file can be found here. D-Space
The summary of the calculation and the transition state structure are shown below.
The summary is shown in table (h) with the structure in figure (m).
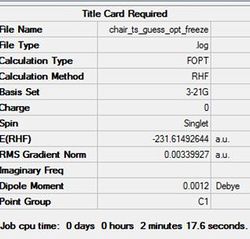
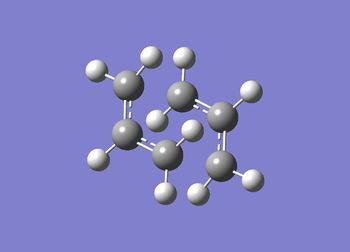
Data showing went to completion
 Item               Value     Threshold  Converged?
 Maximum Force            0.000010     0.000450     YES
 RMS     Force            0.000003     0.000300     YES
 Maximum Displacement     0.000438     0.001800     YES
 RMS     Displacement     0.000075     0.001200     YES
 Predicted change in Energy=-3.196044D-09
 Optimization completed.
This optimisation was followed by unfreezing the coordinates and changing the settings to 'Bond' and 'Derivative'. This acts to optimise the previously frozen bonds by finding the derivative along the optimised potential energy surface. The completely optimised chair transition-state structure is shown in figure (n) with the summary of the calcualation in table (i).
The D-space for this file can be found here. D-Space
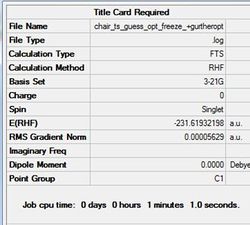
Pentahelicene |
Figure (n)-Fully optimised chair transtion state structure using the frozen coordinate method.
Data showing went to completion
 Item               Value     Threshold  Converged?
 Maximum Force            0.000026     0.000450     YES
 RMS     Force            0.000008     0.000300     YES
 Maximum Displacement     0.000906     0.001800     YES
 RMS     Displacement     0.000177     0.001200     YES
 Predicted change in Energy=-2.922277D-07
 Optimization completed.
Comparison of two chair transition state structures
The two transition state structures are similar on the eye and with very similar energies and gradients.
Total Energy Value for HF/3-21G method 1 optimisation of chair TS: -231.6193224 au Total Energy Value for HF/3-21G frozen coordinate optimisation of chair TS: -231.6193219 au
Gradient for HF/3-21G method 1 optimisation of chair TS: 0.00002435 au Gradient for for HF/3-21G frozen coordinate optimisation of chair TS: 0.00005629 au
Bond lengths for each chair structure are summarised in table (h).
| Parameter | Chair TS Using HF/3-21G | Chair TS Using 6-31(G) |
|---|---|---|
| Terminal C....C Fragment Separation (Å) | 2.02620 | 2.01992 |
| C-C Bond Length (Å) | 1.38934 | 1.38932 |
Again observable data for both methods are similar proving both methods to be a good way to calculate transition state structures. As mentioned in the lab script, the frozen method does not require the construction of a hessian so is, therefore, faster than the conventional 3-21G optimisation. This quality is advantageous for larger systems. Furthermore, method 1 requires the guess structure to be fairly accurate in order to work. This is not needed in the frozen coordinate method. To conclude, both methods are acceptable as produce the same optimised transition state structure (i.e. have the same bond length ca. 2.02 Å).
Optimising and Frequency of the Boat Transition State Using Method 3
To optimise boat TS a different approach was taken. Two molecules of the fully-optimised Ci app 1,5-hexadiene (anti2) conformer were numbered in such a way so that one represent a reactant and the other represented a product. An 'Opt+Freq' calculation was then ran with a 'QST2' transition state optimisation and a method and basis-set of HF/3-21G. This optimsation failed as Gaussian was unable to locate the boat transition state due to the softwares inability to rotate bonds. The structure formed from this failed optimisation is shown in figure (o) and calculation summarised in table (i). Notice how the structure fails because it is more analogous to the fully optimised chair transition states.
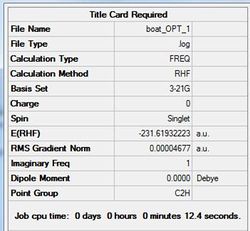
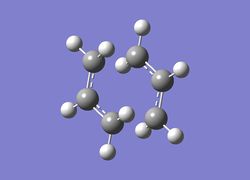
The D-space file can be found here. D-space
Data showing went to completion
Item               Value     Threshold  Converged?
 Maximum Force            0.000036     0.000450     YES
 RMS     Force            0.000017     0.000300     YES
 Maximum Displacement     0.000716     0.001800     YES
 RMS     Displacement     0.000272     0.001200     YES
 Predicted change in Energy=-2.503993D-07
 Optimization completed.
To amend for this failure in the calculation, the required geometries have been accommodated in the original input file by manually altering the bond angles in the structures to be more analogous to the boat transition state; the central C2-C3-C4-C5 dihedral angle to 0o and the inner C2-C3-C4 and C3-C4-C5 angles to 100o. The 'Opt+Freq' job was ran again seeing the optimised boat transition state structure calculated. The structure is shown in figure (p) with the calculation summarised in table (j).
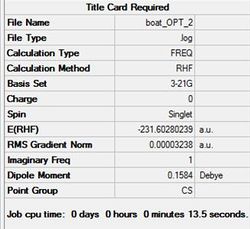
Pentahelicene |
Figure (p)- Optimised boat transition state structure.
The results from the frequency analysis are shown below. Note that the second line values are all positive inferring that the optimal boat structure has been found. In addition, the presence of an imaginary frequency in the first line shows that the structure is a maxima in one direction and, therefore, proves the structure to be a transition state. The imaginary vibration at -839.9283 cm-1 can be seen in figure (q).
The frequency figures, shown below,
  Low frequencies --- -839.9283   -8.0757   -6.3115   -4.0797   -0.0012   -0.0010
 Low frequencies ---   -0.0008  155.0909  382.2138
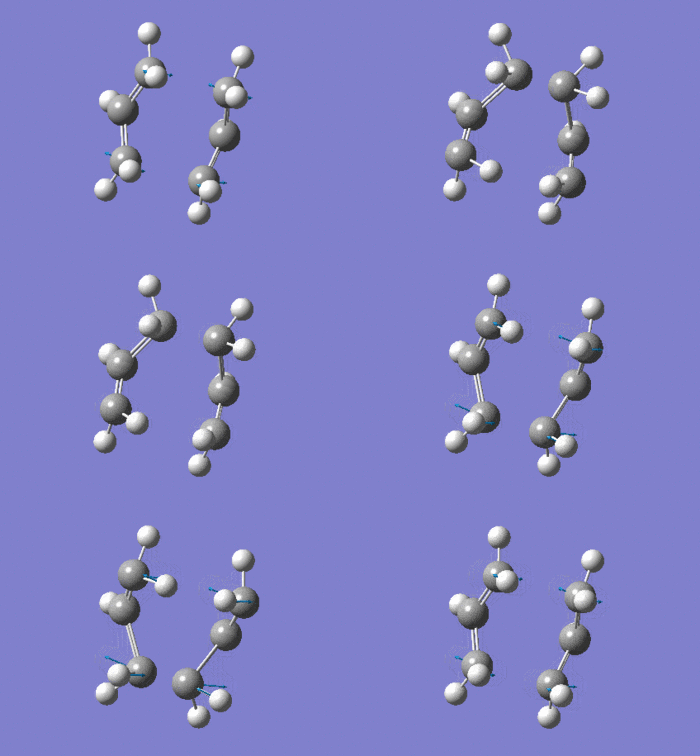
The D-space for the 'Opt+freq' calculation giving the boat transition state structure can be found here. D-space
Data below shows calculation went to completion.
 Item               Value     Threshold  Converged?
 Maximum Force            0.000105     0.000450     YES
 RMS     Force            0.000022     0.000300     YES
 Maximum Displacement     0.001248     0.001800     YES
 RMS     Displacement     0.000277     0.001200     YES
 Predicted change in Energy=-9.838745D-08
 Optimization completed.
The QST2 method is, therefore, proven a successful method to achieve an optimal transition state. However, limitations exist in that the input product and reactant structure have to be close to the believed transition state structure. An enhanced method can be used to alleviate this discrepancy whereby the user inputs a product, reactant and guess transition state structure. This method is called the QST3 method.
Intrinsic Reaction Coordinate (IRC) Analysis of Chair Transition State
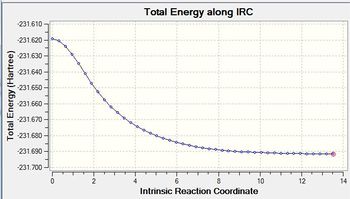
From viewing the optimised reactant structures product and transition state structures it is impossible to understand whether they connect gauche or app 1,5-hexadiene structures. An IRC analysis allows the determination of the local minmium point to the 'saddle' transition state. It does this by monitoring the minimum energy pathway from the transition state to this local minimum point. The IRC acts by changing the geometry of the molecule following the steepest section of the reaction energy surface. An IRC has been run on the optimised chair structure to determine the 1,5-hexadiene conformer it relates to. For the IRC 50 steps were specified in the 'Forward' direction only. The structure (figure (r)) and summary (table (k))are shown below. The structure was formed after 27 steps and relates to the gauche 2 structure in Appendix1[2].
The D-space can be found here D-space
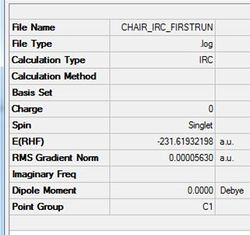
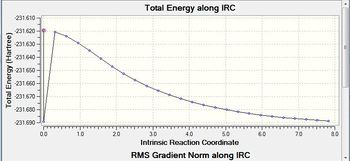

This initial IRC did not form the optimised chair conformer indicated in the gradient value not reaching a minimum. Three methods have been tested to reach these structure and they are each discussed below with a conclusion determining the best method.
Method 1- Take last point and perform normal optimisation.
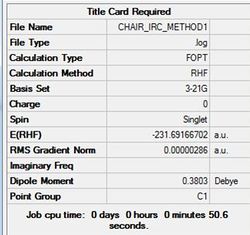
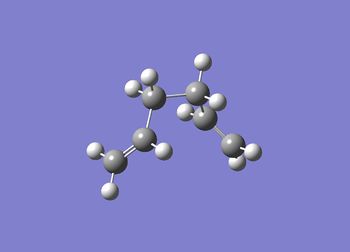
J Mol can be accessed here
The D-space can be accessed here. D-Space
Data showing calculation went to completion
 Item               Value     Threshold  Converged?
 Maximum Force            0.000010     0.000450     YES
 RMS     Force            0.000003     0.000300     YES
 Maximum Displacement     0.000299     0.001800     YES
 RMS     Displacement     0.000091     0.001200     YES
 Predicted change in Energy=-2.412744D-09
 Optimization completed.
Method 2 and Method 3- Restart the IRC and specify a larger range of points to be accessed whilst calculating the force constants every time.
Rather then specifying 50 steps, 100 steps was specified. If there are more points, the small changes in geometry are generated more accurately. In addition, the force calculations where calculated at every step.
The D-space can be found here D-space
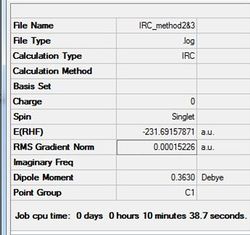
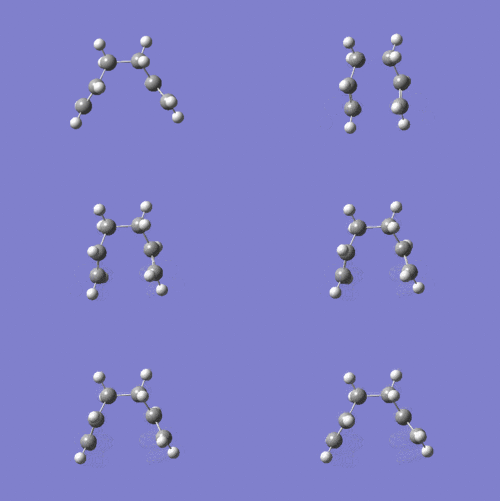
All three methods produce the same gauche4 conformer for the chair structure. Method 1 shows the structure now fully optimised to gauch4 indicated in the small gradient. Interestingly, method 2 and 3 is optimised after 44 iterations aided by the higher threshold. The optimal structure has been found again indicated in the small gradient value.
The IRC optimsiation path for the IRC run prior to method 1 is shown in figure (v).
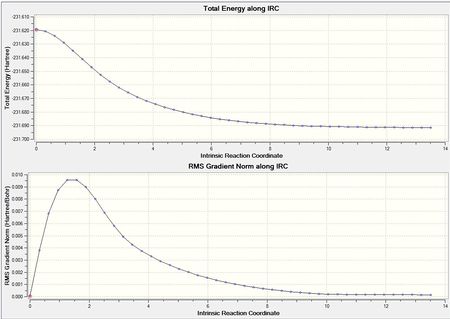
This shows the movement from unstable transition state to the stable gauche4 structure as you move across the reaction coordinate. Interestingly, the optimisation calculations carried out earlier on in the project showed gauche3 to be the most stable conformer. However,this does not conflict the IRC result tells us the most stable conformer from the given transition state not necessarily the most stable conformation of the product possible.
Calculation of Boat and Chair Activation Energies
The chair and boat transitions were optimised using the higher B3LYP/6-31G. Results are shown in tables (o) and (p) and figures (v) and (w) for chair and boat respectively.
The D-space for the chair calculation can be found here D-space
The D-space for the boat calculation can be found here D-space
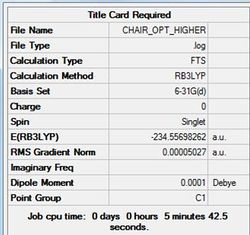
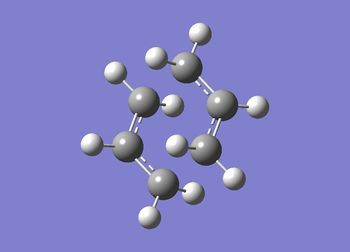
Data below shows chair calculation went to completion.
 Item               Value     Threshold  Converged?
 Maximum Force            0.000058     0.000450     YES
 RMS     Force            0.000019     0.000300     YES
 Maximum Displacement     0.000611     0.001800     YES
 RMS     Displacement     0.000155     0.001200     YES
 Predicted change in Energy=-1.196705D-07
 Optimization completed.
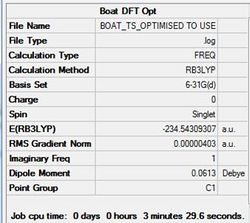
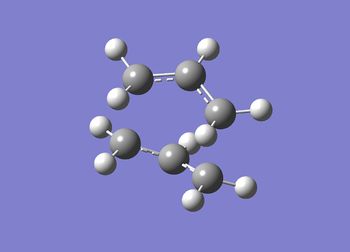
The data boat calculation went to completion.
Item               Value     Threshold  Converged?
 Maximum Force            0.000009     0.000450     YES
 RMS     Force            0.000003     0.000300     YES
 Maximum Displacement     0.000128     0.001800     YES
 RMS     Displacement     0.000052     0.001200     YES
 Predicted change in Energy=-2.676308D-09
 Optimization completed.
The energies of the higher optimised transition state structures are summarised below.
CHAIR TS= -234.55698 BOAT TS= -234.54309
The chair structure is seen to be slightly higher in energy than the boat structure.
A frequency analysis of both transition states was run at this higher basis-set.
The frequency values for the chair transition states are shown below. Again a large imaginary frequency is indicated with positive values in the second line inferring the presence of the optimal structure. The vibration that corresponds to the imaginary frequency can be seen in figure (x).
Low frequencies --- -565.6905   -0.0007   -0.0005    0.0007   22.0392   27.0711
 Low frequencies ---   40.1427  194.4985  267.7693
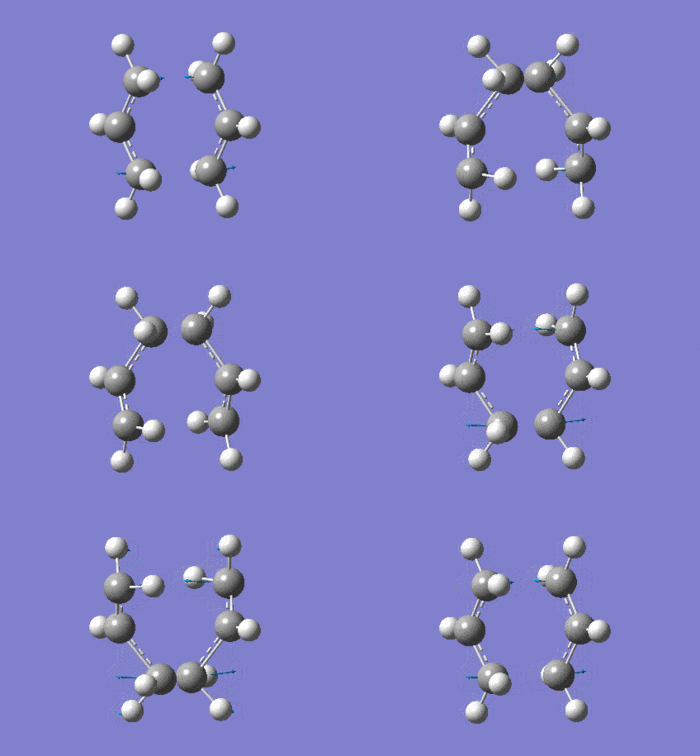
The D-space for the chair calculation can be found here D-space
The frequency values for the boat transition states are shown below. Again a large imaginary frequency is indicated with positive values in the second line inferring the presence of the optimal structure. The vibration that corresponds to the imaginary frequency can be seen in figure (y).
 Low frequencies --- -530.3618   -8.3908    0.0002    0.0002    0.0007   15.4632
 Low frequencies ---   17.6137  135.6121  261.7006
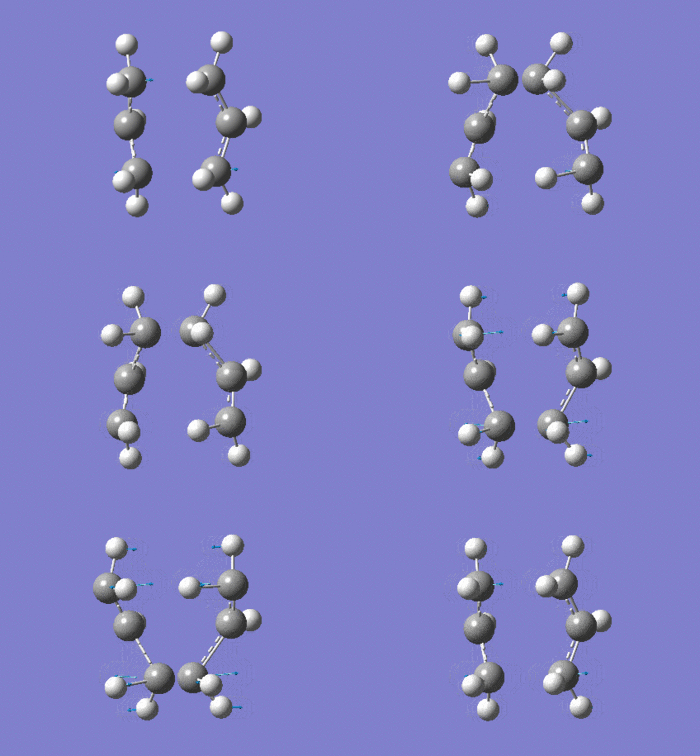
The D-space for the boat calculation can be found here D-space
From the frequency analysis 'Thermochemistry' data can be found for the two transition state structures (both shown below). The data informs us of the zero-point energy ambient conditions
Zero-point correction=                           0.142511 (Hartree/Particle)
 Thermal correction to Energy=                    0.149039
 Thermal correction to Enthalpy=                  0.149983
 Thermal correction to Gibbs Free Energy=         0.111924
 Sum of electronic and zero-point Energies=           -234.460596
 Sum of electronic and thermal Energies=              -234.454068
 Sum of electronic and thermal Enthalpies=            -234.453124
 Sum of electronic and thermal Free Energies=         -234.491183
Figure (z)- Chair TS Thermochemistry Data
Zero-point correction=                           0.140751 (Hartree/Particle)
 Thermal correction to Energy=                    0.147086
 Thermal correction to Enthalpy=                  0.148030
 Thermal correction to Gibbs Free Energy=         0.111341
 Sum of electronic and zero-point Energies=           -234.402342
 Sum of electronic and thermal Energies=              -234.396008
 Sum of electronic and thermal Enthalpies=            -234.395063
 Sum of electronic and thermal Free Energies=         -234.431752
Figure (aa)- Boat TS Thermochemistry Data
This data can be used to calculate the activation energy at 298 K for the related transition state by calculating the difference between the sums of the electronic and thermal energies of the transition states and product and at 0 K by calculating the difference between the sums of the electronic and zero-point energies energies of the transition states and reactant. The product value for the chair was found earlier from the app Ci conformer frequency analysis.
Chair Activation Energy at 298 K= -234.454068 + 234.506916 = 0.052848 au = 33.16227854 kCal/mol
All the activation energies for both the boat and chair transition state at ) and 298 K are summarised at the end of the chapter.
Before the boat activation energies could be calculated a higher optimisation and frequency analysis had to be run on the previously optimised gauche conformer- C1 gauche3 conformer. This is beacuse IRC analysis shows the transition state to relate to this conformer.
The D-space for gauche higher optimisation can be found here. D-space The D-space for gauche frequency analysis can be found here. D-space
The frequency data is shown below. Note how indicates optimal structure found in positive values in second line. Also first line roughly within -15 to 15 cm-1 range indicating centre of mass being fixed.
 Low frequencies ---   -4.4023   -0.0008   -0.0003    0.0003    7.2482    8.2759
 Low frequencies ---   75.0349  103.1964  125.5603
  Zero-point correction=                           0.142636 (Hartree/Particle)
 Thermal correction to Energy=                    0.149865
 Thermal correction to Enthalpy=                  0.150809
 Thermal correction to Gibbs Free Energy=         0.111225
 Sum of electronic and zero-point Energies=           -234.468693
 Sum of electronic and thermal Energies=              -234.461464
 Sum of electronic and thermal Enthalpies=            -234.460520
 Sum of electronic and thermal Free Energies=         -234.500105
Figure (bb)- Higher optimised C1 gauche3 conformer thermochemistry data.
| Transition State | Activation Energy at 0 K (2 dp)(KCal/mole) | Activation Energy at 298 K (2 dp) (KCal/mole) |
|---|---|---|
| Chair | 34.36 | 33.16 |
| Boat | 41.62 | 41.07 |
It is clear that the activation energies for the boat transition state are consistently higher than for the chair transition state, hence, more thermal energy is needed for the reaction to occur via the boat structure. So, under thermodynamic conditions (high temperature) the system has enough energy to equilibriate and react via the boat transition structure, but when under kinetic control (low temperatures) the reaction goes through the chair transition state as this is quicker to reach. As expected when molecules are at higher temperatures the activation energy is lower due to the increased kinetic energy in the structures to overcome the transition state barrier compared to at 0 K when only the zero point energy is available.
The Diels-Alder Cycloaddition
The Diels-Alder cycloaddition is a concerted [4+2] cycloaddition carbon-carbon bond forming reaction that occurs between a conjugated diene and an alkene dienophile. The reaction can involve 4n+2 pi electrons forming a stable cyclic alkene. The Diels-Alder is strategically employed by synthetic chemists due to its specific regio- and stereo-selectivity. Furthermore, the rate of these cycloadditions can be enhanced by the presence of and electrons withdrawing group (e.g. carbonyl) on the dienophile lowering the energy of the pi* orbital entrancing the overlap proving to be useful in synthesis. This opbservation is built on the principle that the driving-force for a Diels-Alder reaction is the interaction of the HOMO of one reactant with the LUMO of another. In this part of the project two Diels-Alder reactions will be studied in GaussView 5.0 in order to characterise their transition state structures and compute the HOMO and LUMO orbitals. From this the idea of orbital symmetry and overlap capabilities will be discussed and related to the Diels-Alder cycloaddition.
The two Diels-Alder reactions to be considered will be:
- the addition of ethylene (dienophile) to cis-butadiene (diene)
- the addition of maleic anhydride (dienophile) to cyclohexa-1,3-diene (diene)
The Reaction of Ethylene with cis-Butadiene
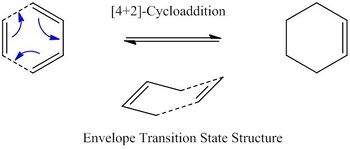
This pericyclic reaction involves the concerted formation of two new sigma bonds between a dienophile (ethylene) and conjugated diene (cis-Butadiene). The mechanism is shown in figure (cc). The reactivity of this reaction is primarily related to the frontier orbitals, as mentioned earlier, and is not heavily influenced by factors such as solvents. For the reaction to take place the butadiene fragment has to be in the cis conformation not the trans. If the tran-conformer is populated, the orbitals will not overlap sufficiently enough. In order to understand the stereo and regio occurances in the reaction the molecular orbitals of the reactants and transitions states will be generated using Gaussian. I am going to begin by optimisaing the cis-Butadiene geometry.
Optimisation of the Butadiene and Ethene Fragments
In order to appreciate the why the reactants form the envelope transitions state structure the molecualr orbitals of the reactant need to be produced. The ethene and cis-butadiene fragments were drawn then optimised. For both fragments, the optimisation method chosen was semi-empirical with the AM1 approach. The results for the cis-butadiene fragment are summarised in table (q) and the structure shown in figure (dd).
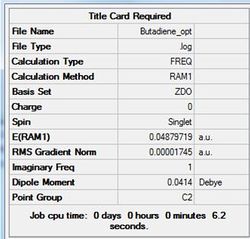
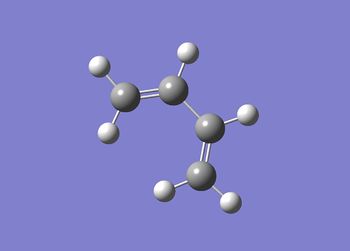
The data below shows the calculation ran to completion.
Item               Value     Threshold  Converged?
 Maximum Force            0.000047     0.000450     YES
 RMS     Force            0.000017     0.000300     YES
 Maximum Displacement     0.000390     0.001800     YES
 RMS     Displacement     0.000171     0.001200     YES
 Predicted change in Energy=-1.101305D-08
 Optimization completed.
The cis-butadiene optimisation D-space can be found here. D-space
The results for the ethene fragment are summarised in table (r) and the structure shown in figure (ee).
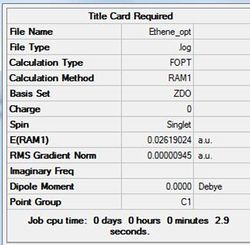
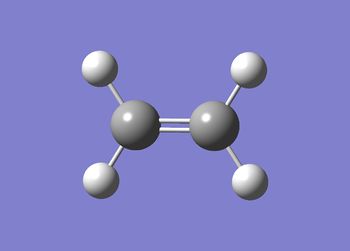
The data below shows the calculation ran to completion.
 Item               Value     Threshold  Converged?
 Maximum Force            0.000031     0.000450     YES
 RMS     Force            0.000012     0.000300     YES
 Maximum Displacement     0.000057     0.001800     YES
 RMS     Displacement     0.000037     0.001200     YES
 Predicted change in Energy=-2.644693D-09
 Optimization completed.
The ethene optimisation D-space can be found here. D-space
For both fragments the optimisation shows RMS gradients of ca. 0.00001 indicating the formation of the optimum structures as the calculation has virtually converged to the minimum point of potential energy surface where gradient would be zero.
The HOMO and LUMO orbitals for both fragments were visualised using the FCHK (formatted checkpoint) file and are shown in table (m).
Note that the HOMO of cis-butadiene contains a node, an area of no electron density (orbital overlap), between C2 and C3. Thi node destabilised the orbital with respect to lower molecular orbital. The LUMO has two nodes present and, therefore, is an anti-bonding orbital. The ethene homo is a fully bonding orbital with no nodes present and is formed by the overlap of two p orbitals. The corresponding LUMO has one node present.
The MO diagram for the froniter orbitals of cis-butadiene can be seen in figure (ff) with the related orbitals superimposed. The MO diagram for ethene is shown in figure (gg).
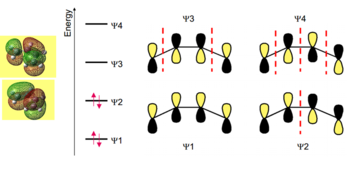
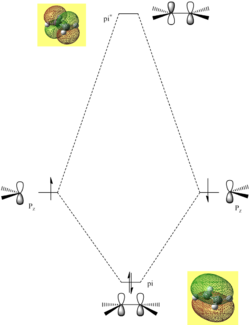
In the cis-Butadiene MO diagram the HOMO-LUMO gap is ca. 242.69 kCal Mol-1 and in the ethene MO diagram the HOMO-LUMO gap is ca. 276.48 kCal Mol-1. These energy gaps could be deemed difficult to overcome and, therefore, difficult for the fragments to access their LUMOs.
By viewing the symmetry and energy of the frontier orbital for each fragment a qualitative understanding to which orbitals overlap can be developed. The main requirement for orbitals to overlap is that they are of the same symmetry and close in energy. Viewing the symmetries clearly the HOMO of cis-butadiene can overlap with the LUMO of ethene (both Asymmetric) and the HOMO of ethene can overlap with the LUMO of cis-butadiene. Viewing the relative energy differences the HOMO ethene and LUMO cis-butadiene have a difference of 0.40484 au and the HOMO cis-butadiene and LUMO ethene have a difference of 0.39665. Based on this, the antisymmetric orbitals could be deemed to overlap most strongly and, therefore, contribute greatest to the transition state. However, the energy difference are fairly close so its is required for the transition state to be investigated.
Note how the Gaussian MOs correspond well with the LCAO molecular orbital formation. This reinforces the validity of the qualitative LCAO approach.
Calculation of Optimal Transition State Structures via Frozen Coordinate Method
The for this Diels-Alder cycloaddition the transition state is expected to be an envelope structure. In GaussView 5.0 this structure has been drawn based on the bicyclo-2,2,2-octane fragment. This structure has been optimised using the semi-empirical AM1 system using the frozen coordinate method (seen in part 1 of this project). The terminal carbons of the transition state were set to 2.2 Å[6].
The optimsised structure can be seen in figure (hh) with the summary in table (s).
D-space semi-empirical/AM1 Frozen Step 1 D-space D-space semi-empirical/AM1 Frozen Step 2 D-space
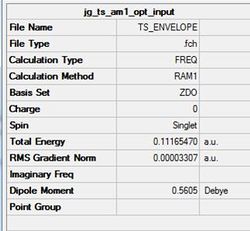
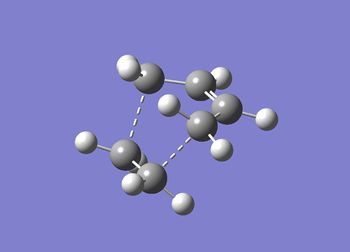
JMol can be accessed here Data below shows second calculation went to completion. This was also seen for first calculation.
 Item               Value     Threshold  Converged?
 Maximum Force            0.000130     0.000450     YES
 RMS     Force            0.000019     0.000300     YES
 Maximum Displacement     0.001477     0.001800     YES
 RMS     Displacement     0.000419     0.001200     YES
 Predicted change in Energy=-5.848845D-08
 Optimization completed.
A freqency analysis was also run at the semi-empirical AM1 level. As expected, a large imaginary frequency is seen at -955.91 cm-1 indicative of a transition state. The vibration can be seen in figure (ii) with the calculation summarised in table (t). The D-space for the frequency calculation on the AM1 semi-empirical envelope structure can be found here. D-Space
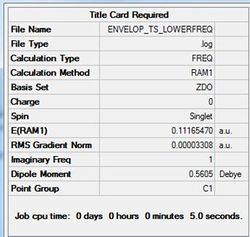
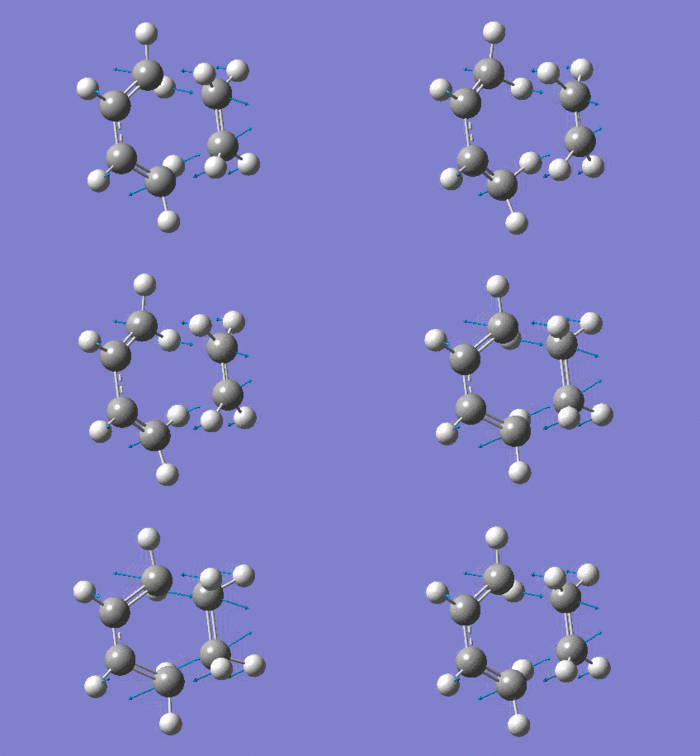
The vibration shows the concerted formation of a sigma bond and loss of pi systems in the Diels-Alder cycloaddition. Hence, this also illustrates a change in hybridisation on the ethene fragment as the carbons change from being sp2 to sp3 hybridised. The lowest frequency real vibration is found at 147.67cm-1 - this corresponds to a twist about the terminal 'C-C bond'. The vibration is shown in the figure below.
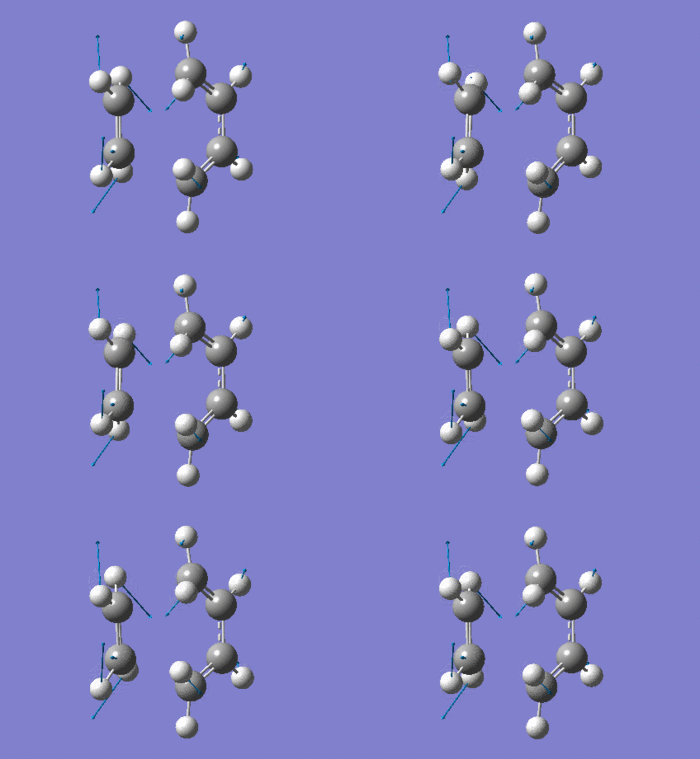
The frequency data can be viewed below.
 Low frequencies --- -955.9133   -3.6854   -0.0275   -0.0032    0.0361    1.9055
 Low frequencies ---    4.1821  147.6695  246.6094
Note presence of large imaginative frequency indicative of a transitions state as a maxima in one direction.
The data below shows the frequency calculation went to completion.
 Item               Value     Threshold  Converged?
 Maximum Force            0.000134     0.000450     YES
 RMS     Force            0.000033     0.000300     YES
 Maximum Displacement     0.001482     0.001800     YES
 RMS     Displacement     0.000569     0.001200     YES
 Predicted change in Energy=-1.146512D-07
 Optimization completed.
An IRC calculation has been run to test the pathway from the transition state generated towards the products. The IRC was run whilst calculating the force constants at every step (method 3 in previous part of project) with n=75. The iteration completed after 26 steps. The D-Space for the IRC analysis can be found here. D-Space
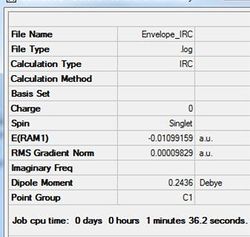
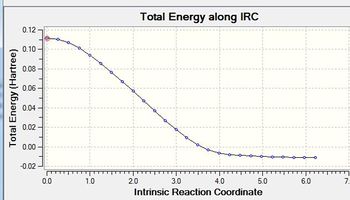
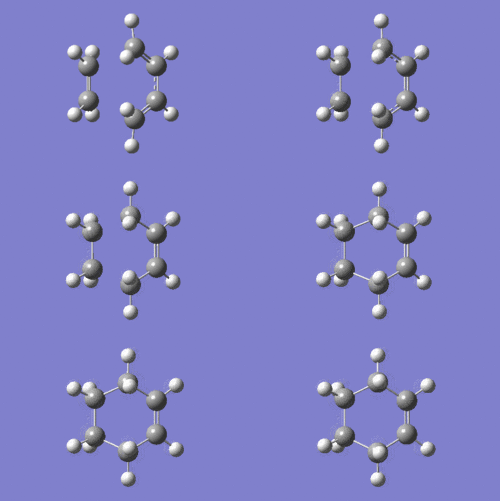
This optimal structure is formed at the local minimum point to the 'saddle point' transition state structure calculated. Indicates transition-state is accurate and forms desired product of the cycloaddition.
As a comparison to the semi-empirical method, a transition state optimisation has also been run at the DFT/6-31(G) level. Again the terminal carbons were frozen to 2.2 Å[6].
The optimsised structure can be seen in figure (jj) with the summary in table (u).
D-space DFT/6-31(G) Frozen Step 1 D-space D-space DFT/6-31(G) Frozen Step 2 D-space

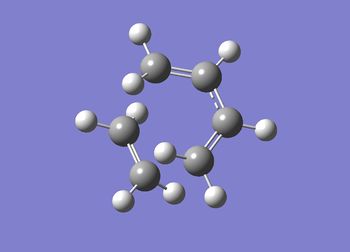
JMol can be accessed here
Data below shows calculation went to completion.
 Item               Value     Threshold  Converged?
 Maximum Force            0.000013     0.000450     YES
 RMS     Force            0.000002     0.000300     YES
 Maximum Displacement     0.000225     0.001800     YES
 RMS     Displacement     0.000066     0.001200     YES
 Predicted change in Energy=-2.359762D-09
 Optimization completed.
A frequency calcaulation was also run on this second optimisation to test the presence of a negative frequency. The vibration can be seen in figure (kk) with the calculation summarised in table (v).
The D-space for the frequency calculation on the DFT/6-31(G) envelope structure can be found here. D-Space
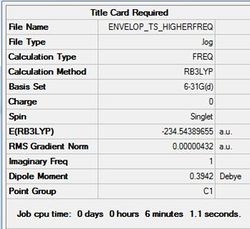
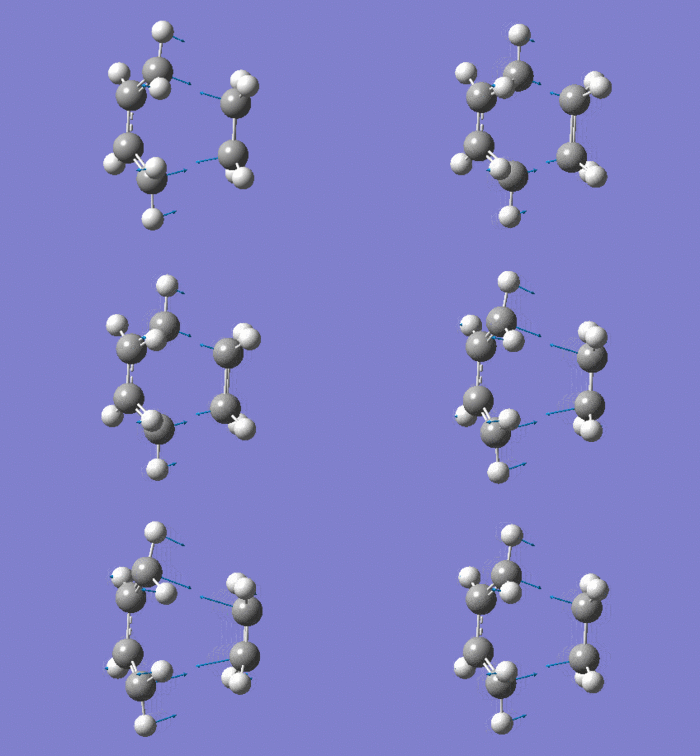
The frequency data can be viewed below.
 Low frequencies --- -524.9108   -6.1156   -0.0007   -0.0006    0.0004   10.3384
 Low frequencies ---   19.8242  135.8332  203.7832
Note presence of large imaginative frequency.
The data below shows the frequency calculation went to completion.
Item               Value     Threshold  Converged?
 Maximum Force            0.000014     0.000450     YES
 RMS     Force            0.000004     0.000300     YES
 Maximum Displacement     0.000216     0.001800     YES
 RMS     Displacement     0.000075     0.001200     YES
 Predicted change in Energy=-4.631494D-09
 Optimization completed.
An IRC calculation has been run to test the pathway from the transition state generated towards the products. The IRC was run whilst calculating the force constants at every step (method 3 in previous part of project) with n=75. The iteration completed after 51 steps. The D-Space for the IRC analysis can be found here. D-Space
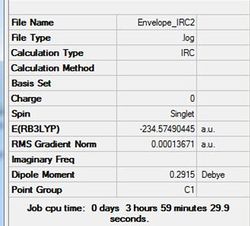
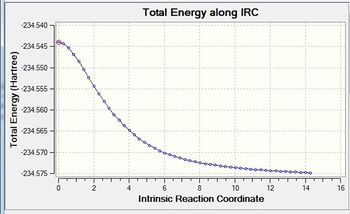
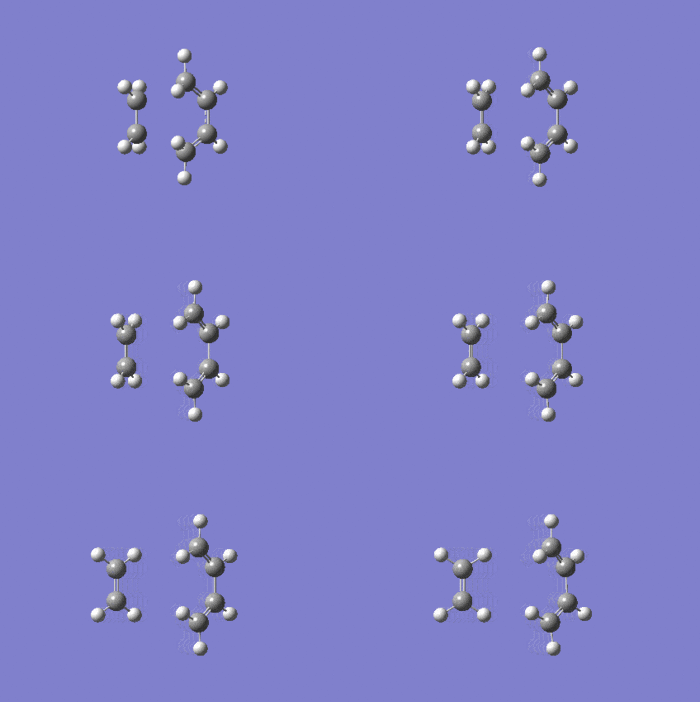
This optimal structure is formed at the local minimum point to the 'saddle point' transition state structure calculated. Not the slight difference compared to the previous IRC calculation.
Comparison of Transition State Structures
| Parameter | S-E/AM1 | DFT/6-31(G) | Literature [7] |
|---|---|---|---|
| Terminal Bond Length (Å) | 2.12 | 2.27 | 2.27 |
| C-C Bond Length in cis-Butadiene (Å) | 1.39/1.41 | 1.38/1.40 | 1.39 |
| C-C Bond Length in Ethene(Å) | 1.39 | 1.38 | 1.38 |
By viewing these bond lengths the calculation methods can be compared and the nature of the transition state they produce. The terminal bonds of the transition state are eventually going to form to new single sigma bonds. The typical bond length of a C-C bond is 1.54 Å[8]. The DFT transition state terminal bond length is clearly longer than the S-E structure. By being further away from the product bond length these observation suggests that the DFT transition state structure is an earlier transition state than the S-E structure. In transiton state, the double bonds of the ethene and cis-butadiene fragmens are longer than typical C=C 1.34 Å[8] at 1.38-1.39 Å but not quite as long as C-C; this is expected. The central C-C bond in the cis-butadiene is seen to be 1.40-1.41 Å; shorter than a single bond but not a short as a single bond. In the product state this bond will correspond to a C=C hence it is expected for the bond length to be shortening in the transition state structure. These bond lengths discussed are closer to the product form indicating the transition sates are late and in the product channel.
MO Analysis of Envelope Transition State
The HOMO and LUMO of the envelope transition state are shown below in figures (mm) and (nn) respectively. The graphics were generated via the AM1 transition state structure.
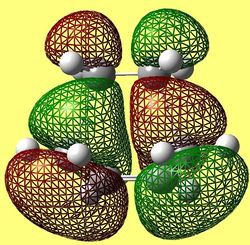
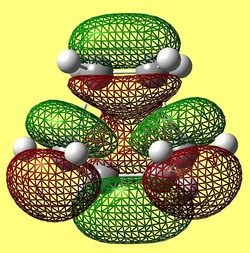
The HOMO is clearly a symmetric orbital and is weakly bonding evident in the number or nodes present. From knowing the orbital is symmetric, it can be inferred that the fragment orbitals which overlap to form the MO are both antisymmtric. The LUMO anti-symmetric with respect to the plane of symmetry and has more nodes present and is, therefore, considered to be antibonding. In addition, as before, the MO symmetry infers that the fragment orbitals used to constitute the MO are both symmetric with respect to the plane of symmetry. By viewing the orbitals generated before for the optimised fragments and comparing them to these MOs, with the knowledge of the symmetries, an estimation can be made for which orbitals constitute them. The results are summarised below.
TS HOMO- Constituted by ethene LUMO and buadiene HOMO (both antisymmetric) TS LUMO- Constituted by ethene HOMO and butadiene LUMO (both symmetric)
The reaction is allowed to proceed because the movement of electrons into low lying pi* orbitals with maximal overlap forms a more energetically stable structure.
The Reaction of Cyclohexadiene with Maleic Anhydride
I am now going to investigate a second Diels-Alder cycloaddition; the addition of maleic anhydride to cyclohexadiene (mechanism shown in figure (oo)). As indicted in figure (oo), the mechanism can feasibly form either the exo and or endo adduct. According to literature [9], the endo product is the kinetically favored product with the exo being thermodynamicaly favored. This kinetic preference to the endo product is due to the favorable orbital interactions present in the transition state stabilising it thereby requiring less energy to overcome; this will be discussed in detail later. Using Gaussian, this idea will be investigated computationally.

Optimising Cyclohexadiene and Maleic Anhydride Fragments
Before constructing the guess endo and exo transition states, the fragments were optimised. Due to its success so far, the fragments were optimised at the DFT/6-31(G) level.
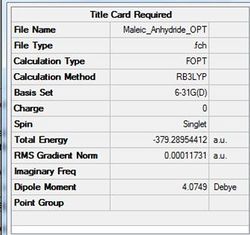
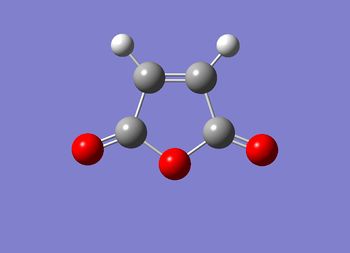
D-Space for maleic anhydride Opt+Freq. D-Space
Data below shows calculation went to completion.
 Item               Value     Threshold  Converged?
 Maximum Force            0.000292     0.000450     YES
 RMS     Force            0.000094     0.000300     YES
 Maximum Displacement     0.001546     0.001800     YES
 RMS     Displacement     0.000551     0.001200     YES
 Predicted change in Energy=-4.590508D-07
 Optimization completed.
The cyclohexadiene was then optimsied using the same method.
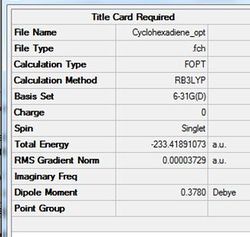
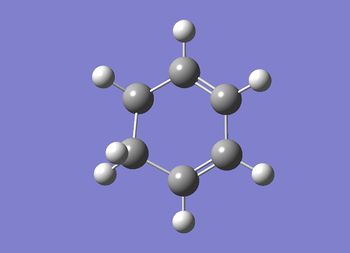
D-Space for cyclohexadiene Opt+Freq. D-Space
Data below shows calculation went to completion.
Item               Value     Threshold  Converged?
 Maximum Force            0.000038     0.000450     YES
 RMS     Force            0.000014     0.000300     YES
 Maximum Displacement     0.000621     0.001800     YES
 RMS     Displacement     0.000227     0.001200     YES
 Predicted change in Energy=-6.689732D-08
 Optimization completed.
The HOMOs and LUMOs for both fragments have been generated and are presented in table (aa).
The maleic anhydride HOMO is largely bonding due to the favourable bonding seen on the ring and oxygen substituents whilst LUMO is seen to have antibonding character due to the nodes present on the C=C and the C=O bonds. The cyclohexadiene LUMO is symmetric and largely antibonding due to the nodes present Converesely, the HOMO is largely bonding.
For the cyclohexa-1,3-diene, the HOMO is symmetric and has a node in the middle, and the antibonding (between red and green lobes) relationships are clear to see. However, there are also bonding interactions, making this orbital weakly bonding overall. The LUMO is visibly symmetric, and the nodes make the orbital antibonding overall.
The energies of the orbitals indicate that the LUMO of the maleic anhydride is low lying as a result of the large HOMO-LUMO gap of maleic anhydride and, therefore, is able to accept electron density from the HOMO of the cyclohexadiene. The opposite case where the cyclohexadiene accepts electrons from the maleic anhydride would not be so easy. This favourable HOMO-LUMO interaction is also allowed due the orbitals both being anti-symmetric and similar in energy.
Analysis of Endo and Exo Transition States
Using the optimised fragments, an exo transition state structure has been drawn. This structure has been optimised using the forzen coordinate method at the DFT/6-31(G) level. The terminal carbons were frozen at 2.1 Å. The structure and summary are shown in figure (rr) and table (bb).
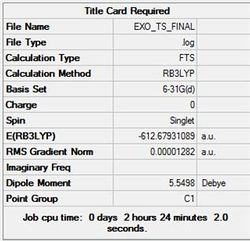
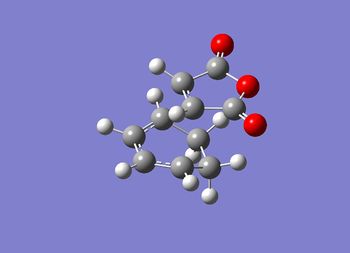
The JMol graphic can be accessed here
EXO FROZEN 1 D-SPACE D-Space EXO FROZEN 2 D-SPACE D-Space
Data below shows calculation ran to completion
      Item               Value     Threshold  Converged?
 Maximum Force            0.000047     0.000450     YES
 RMS     Force            0.000008     0.000300     YES
 Maximum Displacement     0.001112     0.001800     YES
 RMS     Displacement     0.000247     0.001200     YES
 Predicted change in Energy=-2.619466D-08
 Optimization completed.
A frequency analysis was performed on the exo structure. The data can be seen below with the summary in table (cc).
Low frequencies --- -448.6385  -14.1094  -11.7125    0.0010    0.0012    0.0012
 Low frequencies ---    2.4609   53.3409  109.1465
Note the presence of a large negative frequency indicative of a transition state. The vibration is shown in figure (ss).
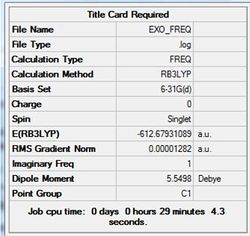
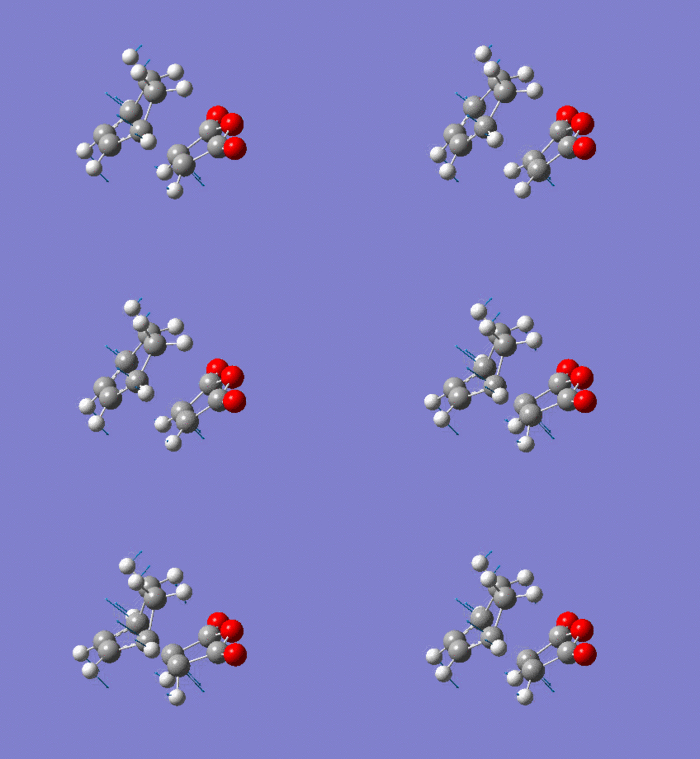
This vibration relates to the concerted formation of two sigma bonds.
The D-space for the exo frequency analysis can be found here D-Space
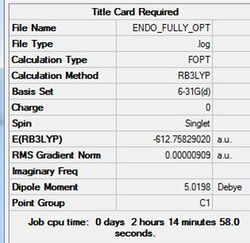
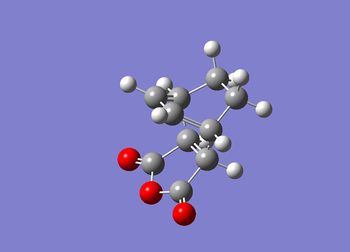
The endo transition state has been constructed using the optimised fragments and is shown below in figure (tt) with the calculation summary in table (dd).
The JMol graphic can be accessed here
ENDO FROZEN 1 D-SPACE D-Space
ENDO FROZEN 2 D-SPACE D-Space
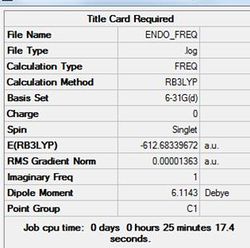
Again a frequency anaylsis was run this time on the endo transition state structure.
The data can be seen below with the summary in table (ee).
Low frequencies --- -448.6385  -14.1094  -11.7125    0.0010    0.0012    0.0012
 Low frequencies ---    2.4609   53.3409  109.1465
Note the presence of a large negative frequency indicative of a transition state. The vibration is shown in figure (ss).
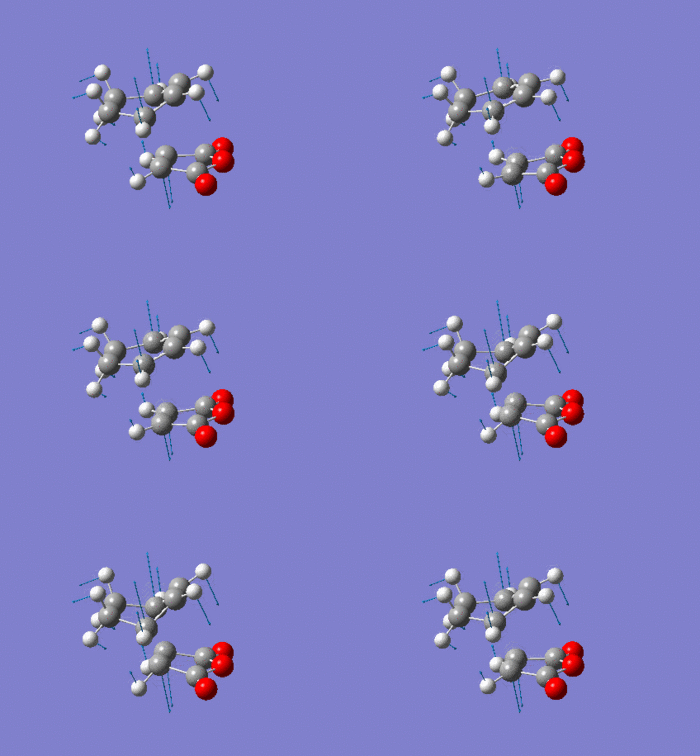
This vibration relates to the concerted formation of two sigma bonds.
ENDO FREQUENCY ANALYSIS D-SPACED-Space
Discussion of Endo and Exo Transition State Structures
As mentioned previously, the endo product is formed under kinetic conditions (low temperatures) and the exo product is formed under thermodynamic conditions (high temperatures). The justification for this has been spoken about in terms of the exo transitions state being stabilised with respect to the endo structure due to favorable orbital interactions causing it to form faster. However, by looking at the optimised structures generated and by calculation the activation energies a deeper understanding can be developed.
| Parameter | Exo | Endo |
|---|---|---|
| C-C Inter-fragment Bond Length (Å) | 2.29 | 2.27 |
| C-C Bond Length in Maleic (Å) | 1.48 | 1.48 |
| Average C-C Bond Length in cyclohexadiene (Å) | 1.53 | 1.54 |
| C-C Bond Length Former (C=C)(Å) | 1.40 | 1.39 |
| C=C Bond Length Former (C-C)(Å) | 1.40 | 1.40 |
| Through Space Distance (C=C)-(C-C) (Å) | 2.96 | 2.87 |
The table shows there to be no major difference in the endo and exo structures, however, there is a discrepancy of 0.02 Å between the inter-fragment bond lengths. This slight difference in geometry will prove important in explaining why exo is thermodynamically favored and endo is kinetic. I am going to begin this explanation by clarifying the bond making and breaking processes that occur in the reaction.
In short, the mechanism involves the movement of electrons from π orbitals into σ orbitals causing the disappearance of two π bonds with two σ bonds taking their place. This process also causes the formation of new π bond in the diene at the previous C-C bond to accommodate for valency. For similar reasons, the maleic anhydride sees the previous C=C bond form and C-C σ bond. Viewing the parameters, the C=C double bond to form is 1.40 Å in both the exo and endo transition states; very close to the literature value of 1.34 Å[8]. Conversely, the former C=C forming C-C is 1.40 Å in both the exo and endo transition states; significantly different to the literature C-C length of 1.54 Å[8]. This difference is expected in a transition state, however, as the two parameters have different degrees of closeness to the product bond lengths, it is difficult to define whether the exo and endo structures are early or late transition states.
The through space distance for the diene and maleic anydride in the transition states goes some way to explaining why the exo is thermodynamicaly favored over the endo product. It is clear that the distance is longest in the exo structure (2.96 Å compared to 2.87 Å in the eno TS). This indicates that the exo structure exhibits less steric repulsion between the two fragments so less repulsive energy is exhibited. Note that both structures do experience hindrance as the through space distances are both shorter than the C-C van der Waals distance of 3.2 Å[10]. It can, therefore, be concluded that the exo product is more thermodynamically stable as it experiences less steric hinderance in line with Clayden [11].
Despite the exo structure being thrmodynamically favored, the endo product is predominately favored in the Diels-Alder reaction; i.e. the endo transition state structure is the kinetic product. This means that the activation energy of the endo pathway must be lower than the exo pathway. Using the same method as the chair and boat transition state calculations, I have calculated the activation energies of the exo and endo transition states. The values are presented in table (gg).
| Thermodynamic Value | Exo | Endo |
|---|---|---|
| Total 'Sum of electronic and thermal energies' for the fragments (maleic anhydride + cyclohexadiene)(au) | -612.53459 | -612.53459 |
| Sum of electronic and thermal energies for the transition states (au) | -612.481358 | -612.488746 |
| Activation Energy (au)) | 0.053232 | 0.045844 |
| Activation Energy (kCal mol-1) (3 dp) | 33.403 | 28.767 |
The activation energy values indicate that the energy barrier needed to be overcome in order for product to form is smaller for the endo transition state structure. Hence, for non- equilibriating, kinetic, conditions (low temperatures) the endo product will be favored as it forms fastest and there is not enough energy to reform the reactants and form the endo product. The reason for this enhanced stability in the transition state is due to secondary orbital overlap (SOO) in the frontier orbitals. In the endo transition state there are more of these SOO compared to the exo structure, hence, the observed greater stability. These SOO are depicted in figure (vv) and (ww).
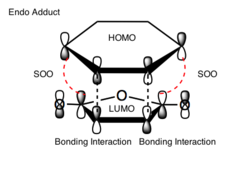
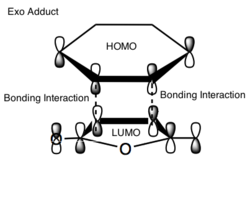
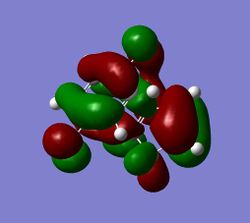
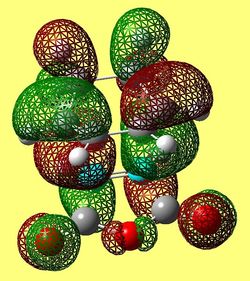
These secondary orbital overlaps can also be seen in the HOMO of the exo and endo structures (see figures (xx) and (yy)).
Conclusion
The ability to predict transition state structure using computational methods has been a major break though in research as transition state structures cannot be seen by standard spectroscopic methods. This allows chemists to predict outcomes of reactions based on optimisation and frequency analysis on these predicted structures. Moreover, these computational techniques prove key in understanding kinetic and thermodynamic observations in reactions, such as, rates and enthalpies of transitions.
In this project two reactions, the Cope rearrangement and Dies-Alder cycloaddition, have been studied. Calculations have shown that the Cope rearrangement proceeds via a stabilised chair transition state. Furthermore, the Diels-Alder reaction between ethene and cis-butadiene is seen to proceed via an enveloped transition state and that this pathway arose due to the dependence on the structures of the frontier orbitals. This concept of orbital overlap was reinforced in the analysis of the maleic anhydride and cyclohexadiene reaction. It was discovered that the endo structure predominates under kinetic conditions due to favoring secondary orbital overlap stabilising the transition state. Hence, computational techniques were used here to justify regioselectivity in chemical reactions.
In conclusion, computational chemistry allows one to predict, analyse and verify a reaction pathway or outcome whilst being able to accommodate for simple and complicated systems.
References
- ↑ http://myttex.net/forum/Thread-Potential-energy-Surface
- ↑ 2.0 2.1 2.2 2.3 Module 3 Appendix 1; https://wiki.ch.ic.ac.uk/wiki/index.php?title=Mod:phys3
- ↑ Gung, W.; Zhu, Z.; J. Am. Chem. Soc.,1995, 117
- ↑ G. Schultz, I. Hrgittai, J. Mol. Struct., 1995, 346,63-69
- ↑ Module 3 Appendix 2; https://wiki.ch.ic.ac.uk/wiki/index.php?title=Mod:phys3
- ↑ 6.0 6.1 Suarez, D.; Sordo, T. L.; Sordo, J. A.; J. Org. Chem., 60, 2848-2852.
- ↑ Goldstein, E.; Beno, B.; Houk, K. N.; J. Am. Chem. Soc., 1996, 118, 6036-6043.
- ↑ 8.0 8.1 8.2 8.3 http://www.science.uwaterloo.ca/~cchieh/cact/c120/bondel.html
- ↑ James H. Cooley and Richard Vaughan Williams; J. Chem. Educ., 1997, 74 (5), p 582
- ↑ JBondi, A. (1964). "Van der Waals Volumes and Radii". J. Phys. Chem. 68 (3): 441–51.
- ↑ Clayden, J.; Greeves, N.; Warren, S.; Wothers, P.; Organic Chemistry, 2011, Oxford University Press.


