Rep:Mod:jcl08M2
Chemistry Computational Lab - Module 2
Part 1: BH3 analysis
optimisation of BH3


A BH3 molecule was optimised using a calculation type of FOPT, a method of RB3LYP with the basis set 3.21G. The final energy obtained was -26.46 Hartree a.u. and the dipole moment was 0.00 Debye. The B-H bond length was found to be 1.19 Angstroms, and the H-B-H angle was 120 degrees. The molecule has a point group of D3H
The RMS and Energy curves can be viewed after the run. The graphs represent the change in energy and RMS gradient against the calculation step. Knowing from the .log file that the calculation converged, and as the RMS value is almost zero( 0.00020672), we therefore know that the lowest energy geometry is obtained. The RMS shows the derivative of the energy with respect to the spatial separation of atoms, this becomes 0 when the calculation reaches the optimised geometry for the molecule.
The Jmol of the molecule can be opened below
Jmol of the optimised BH3
NBO analysis of BH3
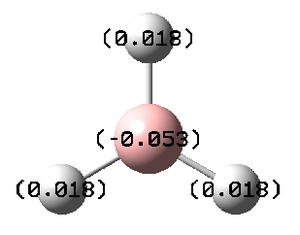
The nbo investigates the charge distribution and the molecular orbitals. Looking at the log file, the overall charge was zero as expected from the symmetry of the molecule. All 3 hydrogen atoms has a full s contribution, while the boron atom has 33.3% contribution from the s orbital and 66.6% from the p orbitals. This matches with the fact that the boron is sp2 hybridised.
The charge distribution indicates that the electron of the B-H bonds are likely to be near the Boron atom than the H atom. Therefore, we have a positive charge on the hydrogen and a negative charge on the Boron.
Molecular Orbital of BH3
Using Mulliken Population Analysis, the orbital of BH3 was generated computationally. The result is compared to qualitative molecular orbitals predicted using linear combination of atomic orbitals (LCAO)method, shown in the diagram below.
The two orbital prediction from both methods matches very well. This indicated that qualitative prediction is reliable in determination of the orbital shape. However, qualitative MO theory is incapable of predicting the energies of the MOs accurately, as quantitative information regarding the energies of the atomic orbitals or splitting energies are not provided. For example, there are no indication on whether 2e' orbital is lower in energy than 3a1' orbital or vice versa. This is not known unless we carried out computational calculation like the population analysis. In the case of BH3, 3a1' orbital is found to be higher in energy by 4 kJ mol-1.
The job is published on D-Space: http://hdl.handle.net/10042/to-5394
Vibrational analysis of BH3
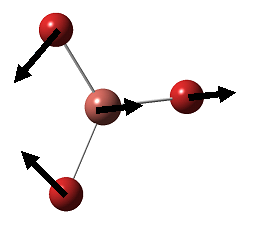
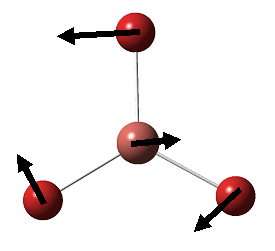
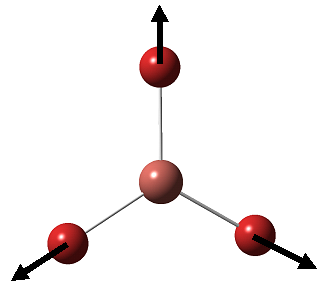
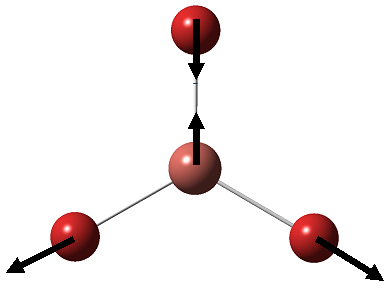
BH3 is a nonlinear molecule, we would therefore expect it to have 3N-6 vibration modes(3×4-6 = 6 vibration modes)
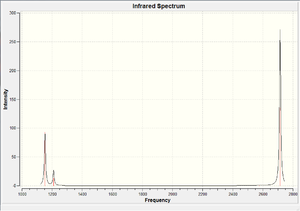
The result obtained matches with the prediction, where 6 vibration modes are identified. We might therefore expect 6 peaks in the IR spectrum of BH3, yet only 3 peaks shown up. This is due to the fact that there are two sets of degenerate vibration at 1210cm-1 and 2715cm-1, and one vibration being IR inactive(IR spectrum detects vibration by measuring any changes in dipole moments. Due to the symmetry of the BH3 molecule, there is no change in dipole moment observed from the a1' symmetric stretching. Hence it is not shown in the IR spectrum.) Comparing the literature value with the calculation, we would see error as large as 4.3% (2715cm-1). We would therefore consider the calculation as a tool to help identifying the number of vibration, but not to obtain the exact numerical value of the vibrations.
The job is published on D-Space: http://hdl.handle.net/10042/to-5395
| No. | Form of Vibration | Calculated Frequency / cm-1 | Intensity | Literature Frequency [1] cm-1 | Symmetry (D3h Point Group) |
|---|---|---|---|---|---|
| 1 | 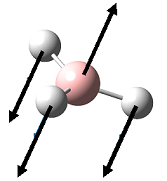 |
1153 | 93 | 1148 | A2" |
| 2 |  |
1210 | 13 | 1197 | E' |
| 3 | 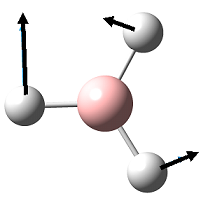 |
1210 | 13 | 1197 | E' |
| 4 | 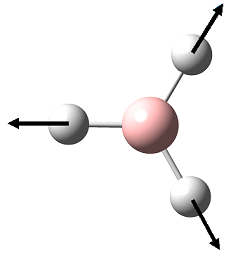 |
2576 | 0 | 2502 | A1' |
| 5 | 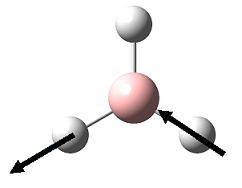 |
2715 | 136 | 2602 | E' |
| 6 |  |
2715 | 136 | 2602 | E' |
Part 2: TlBr3 analysis
Optimisation of TlBr3
An optimisation was carried out for TlBr3, using the same method as BH3(FOPT-RB3LYP) but with a medium-level basis set, LanL2DZ, to give a more accurate result.

The final energy obtained was -91.22 Hartree a.u. and the dipole moment was 0.00 Debye. The Tl-Br bond length was found to be 2.65 Angstroms, and the Br-Tl-Br angle was 120 degrees. Both the bond length and the angle matches well with literature value (2.55 Angstroms and 120 degrees)[2]. The point group remained as D3H because tight restrain (0.0001 tolerance) was applied for the optimisation.
The job is published on D-Space: http://hdl.handle.net/10042/to-5396
Vibrational analysis of TlBr3
| Low frequencies (cm-1) | -3.4213 | -0.0026 | -0.0004 | 0.0015 | 3.9362 | 3.9362 |
| "Real" normal frequencies (cm-1) | 46.43 | 46.43 | 52.14 | 165.27 | 210.69 | 210.69 |
Importance of frequency analysis
From above, Geometry Optimisation give a structure in which the derivative of the curve is found to be zero. However, it can be a minimum or a maximum turning point. Therefore, frequency analysis is required to provide further information on the energy of the optimised molecule. This is done by finding whether the optimised structure is at the point where second derivative of the potential energy curve is positive. By that we can then confirm that the geometry optimisation reaches a minimum. As all wavenumbers are positive, we can deduce that the lowest minimum is reached. If there are any negative wavenumbers, the calculation might have reached a local minimum potential well.
Restrain on basis set
The same basis set was used for the frequency calculation as the geometry optimisation. In order to compare the two, it is vital to have used the same basis set as any change would lead to a minimum turning point of slightly different potential energy. The frequency analysis would inaccurate derivative values if a different basis set was used.
Missing bond in Guassview
In some structure, we would notice that no bonds are drawn between the atoms, yet this does not necessarily mean that there are no bonding interaction between them. The bonds are not shown on Gaussview as the electronic interaction between the atoms are not sufficient enough to be considered as a localised bond under the criteria required by the program. The Guassview database indicates the program to draw bonds only when the calculated distance is within the set limit.
Definition of a bond
Bonding would regard as a force of attraction between two or more atoms which stabilise the energy of the system. Bonding can be a result of electromagnetic interaction between positively charged nuclei and negatively charged shared electrons (covalent bond), electrostatic interaction due to difference in electronegativity(ionic bond, dipole-dipole bond, ionic dipole bond and hydrogen bond), or temperate shift of electron position (Van der Waals).
Analysis of Mo(CO)4(PCl3)2 isomers
Optimisation
Both cis and trans isomers were optimised using FOPT calculation with a method of RB3LYP and a basis set of LANL2MB. The final energy of the two isomer are almost the same, yet cis-isomer is slightly more stable (by 7.9 kJ/mol). This can be seen as a result contributed by both electronic and steric factors, with the electronic effect dominating. For the trans-isomer, it is sterically less hindered. However, with CO ligands being such a strong π-acceptors, the trans effect for the CO ligands in the trans-isomer is large and as a result higher in energy. Cis-isomer has a smaller trans effect as there are only one pair of CO being trans in position to each other, hence it is lower in energy despite the two PCl3 is sterically hindered in space. Therefore, it is possible to alter the ordering of isomer structure by fine-tuning at the ligand groups PR3, changing the R affect the size of trans effect in the complex structure, where larger trans effect is more likely to give cis-isomer and lowering it give the trans-isomer. The trans-isomer has no dipole moment as expected from its symmetric structure, while cis-isomer has a dipole moment of 8.5 Debye. Both isomer has a RMS gradient smaller than 0.002, and by observing the log file we know that they have reached a global minimum. For the trans-isomer, Mo-C bond has a distance of 2.11 Angstroms and Mo-P is slightly longer with a distance of 2.48 Angstroms. In the case of cis-isomer, Mo-C is 2.06 Angstroms and Mo-P is 2.52 Angstroms in length.
| Summary | Final energy | dipole moment | Jmol of the molecule |
|---|---|---|---|
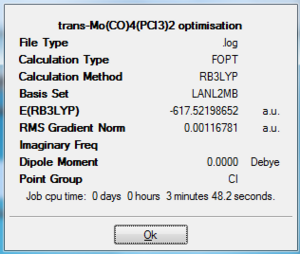 |
-617.53 Hartree a.u. | 0.00 Debye |
Output file: https://www.ch.ic.ac.uk/wiki/index.php/Image:Jcl08transopt.out |
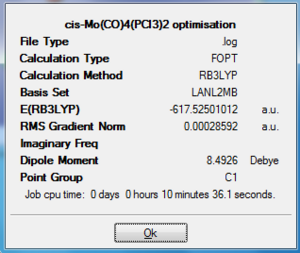 |
-617.52 Hartree a.u. | 8.5 Debye |
Output file: https://www.ch.ic.ac.uk/wiki/index.php/Image:Jcl08cisopt.out |
A second optimisation was carried out using FOPT calculation with a method of RB3LYP and a improved basis set of LANL2DZ. The final energy of the two isomer lowered by 6 a.u., but the fact that Cis-isomer is slightly lower in energy ( by 2.0 kJ/mol which is a fairly small amount in comparison to the total energy of the molecule) maintained with the electronic and steric reasoning mentioned above. However, the trans isomer is no long totally symmetric and has a dipole moment of 0.3 Debye. Both isomer has a RMS gradient smaller than 0.00004,closer to zero than the LANL2MB basis set calculation. Once again by observing the log file we know that they have reached a global minimum. After a refining optimisation, the bond in the trans-isomer has shorten, where Mo-C bond has a distance of 2.06 Angstroms and Mo-P with a distance of 2.44 Angstroms(corresponding well with 2.5 Angstroms in literature [3]). In the case of cis-isomer, Mo-C bond length remained as 2.06 Angstroms and Mo-P is shorten by 0.01 to 2.51 Angstroms. No other bond length and angle data was found on the isomer. Therefore comparison are made with L=PPh3 instead. The bond length and angles correspond well with the literature, yet there are some differences in value due to the fact that not the exact molecule we are comparing.
Geometry data of trans-isomer compared to literature value
| lit.[4] trans [Cr(CO)4(PPh3)2] | trans [Mo(CO)4(PCl3)2] | |
| mean Mo-P bond length / Å | 2.36 | 2.44 |
| mean Mo-C bond length / Å | 1.87 | 2.06 |
| P-Mo-P bond angle/ ° | 176.7 | 177.4 |
| P-Mo-C bond angle / ° | 89.5 | 90.0 |
Geometry data of cis-isomer compared to literature value
| lit.[5] cis [Mo(CO)4(PPh3)2] | cis [Mo(CO)4(PCl3)2] | |
| mean P-Mo bond length / Å | 2.58 | 2.48 |
| mean Mo-C bond length / Å | 2.04 | 2.03 |
| P-Mo-P bond angle / ° | 104.6 | 95.6 |
| P-Mo-C (trans to P) bond angle / ° | 163.7 | 174.4 |
| P-Mo-C (cis to P) bond angle/ ° | 80.6 | 87.3 |
| Summary | Final energy | dipole moment | Jmol of the molecule |
|---|---|---|---|
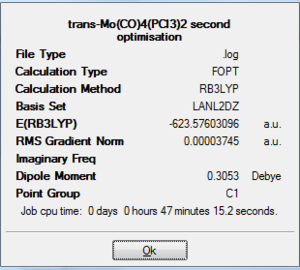 |
-623.58 Hartree a.u. | 0.3053 Debye |
On D-space: http://hdl.handle.net/10042/to-5427 |
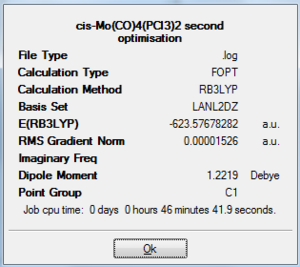 |
-623.58 Hartree a.u. | 1.2219 Debye |
On D-space: http://hdl.handle.net/10042/to-5426 |
Frequency/IR analysis
Trans frequency output on D-space: http://hdl.handle.net/10042/to-5435 Cis frequency output on D-space: http://hdl.handle.net/10042/to-5436
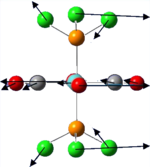
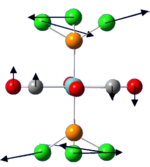
All the low frequencies are positive for both molecule indicating that the global maximum is reached.
The low frequencies vibrations in both isomers are rocking vibrational mode where the entire molecule behaves like a continuous elastic body. As frequency is directly proportional to energy, these low frequencies vibrations occur even at room temperature as the energy required is small. There are sufficient energy for excitation from the ground state vibrational levels population.
The low frequencies vibrations of both Mo(CO)4(PCl3)2 isomers are shown below:
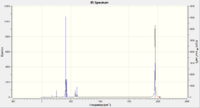
The carbonyl stretch vibrations match with literature data, but the frequencies are slightly shifted by around 40-50 cm-1. Due to symmetry of the vibration, trans-isomer should have two modes being IR inactive and not shown on the IR spectrum.
| Isomer | Calculated Frequency / cm-1 | Calculated Intensity | Experimental Frequency[6] / cm-1 | Point Group (C2v Symmetry)[6] |
|---|---|---|---|---|
| cis | 1945 | 763 | 1986 | B2 |
| cis | 1949 | 1948 | 1994 | B1 |
| cis | 1958 | 633 | 2004 | A1 |
| cis | 2023 | 598 | 2072 | A1 |
| trans | 1950 | 1475 | 1896 | Eu |
| trans | 1951 | 1467 | 1896 | Eu |
| trans | 1977 | 1 | - | B1g |
| trans | 2031 | 4 | - | A1g |
 |
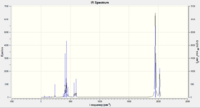 |
All four vibration was observed for the cis-isomer while two for the trans-isomer as expected. However, due to degeneracy there are only one CO stretch peak shown on the IR spectrum of the trans-isomer.
Mini Project: Variation in stability, charge distribution and aromaticity to P6 if an Arsenic is substituted instead of one of the phosphor.
Optimisation of P6 and P5As
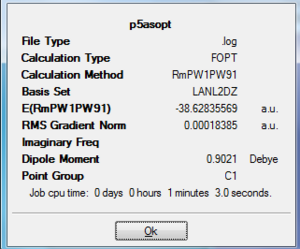
The two molecules are optimised with FODT calculation using RmPW1PW91method and a LANL2DZ basis set. The energy are lower for P6 (-38.99 a.u.) than P5As (-38.63 a.u.), this can be explained by the fact that the As is larger in size and has greater electron density and steric hinderince. The RMS Gradient for both molecules are close to zero. The dipole moment is 0 for P6 due to its symmetric geometry, while it is 0.9 Debye for P5As.
 |
 |
|
| |
| Output on D-Space: http://hdl.handle.net/10042/to-5441 | Output on D-Space: http://hdl.handle.net/10042/to-5442 |
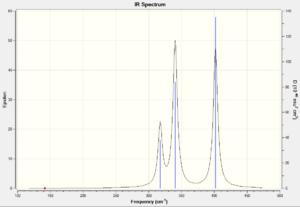
According to the 3N-6, the molecules should have 12 vibration mode.
The frequency calculation for P6 also give 12 vibration as expected. However, only 5 of those are IR active with two pairs being degenerate. Thus there are only 3 peaks in the IR spectrum
| Vibration mode (frequency/cm-1) | intensity |
| 141.48 | 0.0000 |
| 218.91 | 0.0000 |
| 218.93 | 0.0000 |
| 285.47 | 0.0000 |
| 285.58 | 0.0000 |
| 317.38 | 3.0392 |
| 317.44 | 3.0177 |
| 340.22 | 7.1383 |
| 340.25 | 7.1222 |
| 377.23 | 0.0000 |
| 401.76 | 13.6142 |
| 448.46 | 0.0000 |
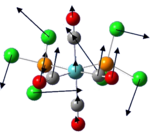
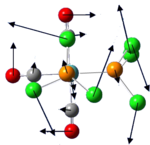
The IR active vibration modes are shown below:
 |
 |
 |
 |
|---|
frequency Output on D-Space: http://hdl.handle.net/10042/to-5443

frequency Output on D-Space: http://hdl.handle.net/10042/to-5444
References
- ↑ Schuurman, M. S., Allen, W. D. and Schaefer, H. F. (2005), The ab initio limit quartic force field of BH3. Journal of Computational Chemistry, 26: 1106–1112. DOI:10.1002/jcc.20238/
- ↑ M. Atanasov and D. Reinen, J. Phys. Chem. A, 2001, 105 (22), pp 5450–5467DOI:10.1021/jp004511j
- ↑ Structural characterizations of cis-Mo(CO)4(PPhMe2)(NHC5H10) and cis-Mo(CO)4(PPhMe2)(PPh3) and their solution reactivities toward carbon monoxide F. Albert. Cotton, Donald J. Darensbourg, Simonetta. Klein, Brian W. S. Kolthammer, Inorg. Chem., 1982, 21 (4), pp 1651–1655. Inorganica Chimica Acta, Volume 254, Issue 1, 1 January 1997, Pages 167-171, Crystal structures of trans-[Mo(CO)4(PPh3)2] and 1,4-bis (diphenylphosphino)-2,5-difluorobenzene, Graeme Hogarth and Tim Norman
- ↑ D. W. Bennett, T. A. Siddiquee, D. T. Haworth, S. E. Kabir, F. K. Camellia, J. Chem. Crys., 2004, 34, 353-359.DOI:10.1023/B:JOCC.0000028667.12964.28
- ↑ D. J. Darensbourg, R. L. Kump, Inorg. Chem., 1978, 17, 2680-2682. DOI:10.1021/ic50187a062
- ↑ 6.0 6.1 F.A. Cotton, Inorg. Chem., 1964, 3, 702: DOI:10.1021/ic50015a024


