Rep:Mod:jc6116
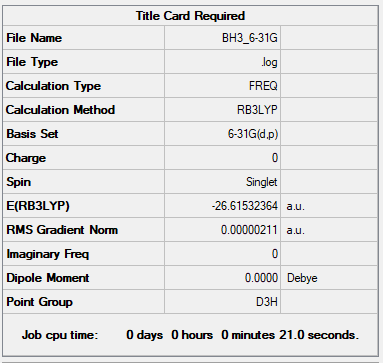
BH3 Molecule
Basis Set
B3LYP/6-31G(d.p.)
Summary Table
Item Table
        Item               Value     Threshold  Converged?
Maximum Force            0.000004     0.000450     YES
RMS     Force            0.000003     0.000300     YES
Maximum Displacement     0.000017     0.001800     YES
RMS     Displacement     0.000011     0.001200     YES
BH molecule |
Frequency Analysis
Low frequencies ---  -11.6892  -11.6814   -6.5475    0.0011    0.0281    0.4290
Low frequencies --- 1162.9746 1213.1390 1213.1392
Frequency Link
Media:JC6116_DAY1_BH3_2_FRE.LOG
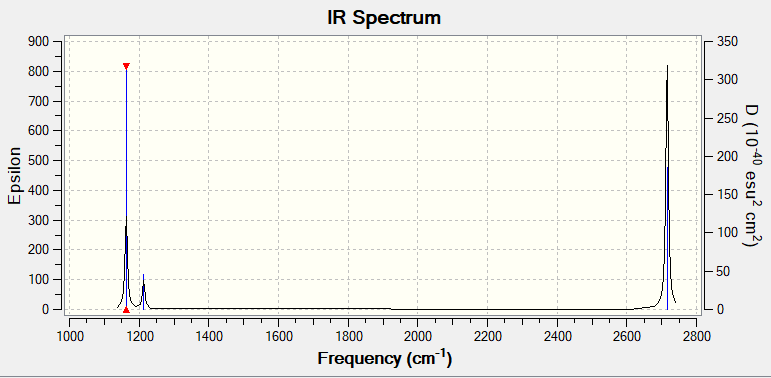
Vibrational spectrum of BH3
| wavenumber (cm-1) | Intensity (arbitrary units) | symmetry | IR active? | type |
| 1163 | 96 | A2" | yes | out-of-plane bend |
| 1213 | 14 | E' | very slight | in-plane bend |
| 1213 | 14 | E' | very slight | in-plane bend |
| 2582 | 0 | A1' | no | symmetric stretch |
| 2716 | 125 | E' | yes | asymmetric stretch |
| 2716 | 125 | E' | yes | asymmetric stretch |
There are totally 6 vibration modes, but from the IR spectrum only 3 peaks can be observed, which are 1163.6 cm-1, 1213.6 cm-1, 2713.1 cm-1.
Due to the fact that Mode 2 and Mode 3 are degenerate, Mode 5 and Mode 6 are degenerate.
In addition, Mode 4 (2580 cm-1) is not shown in the spectrum since all the dipole moments cancelled out with each other due to it is symmetric stretch hence it's IR inactive.
LCAO MO of BH3
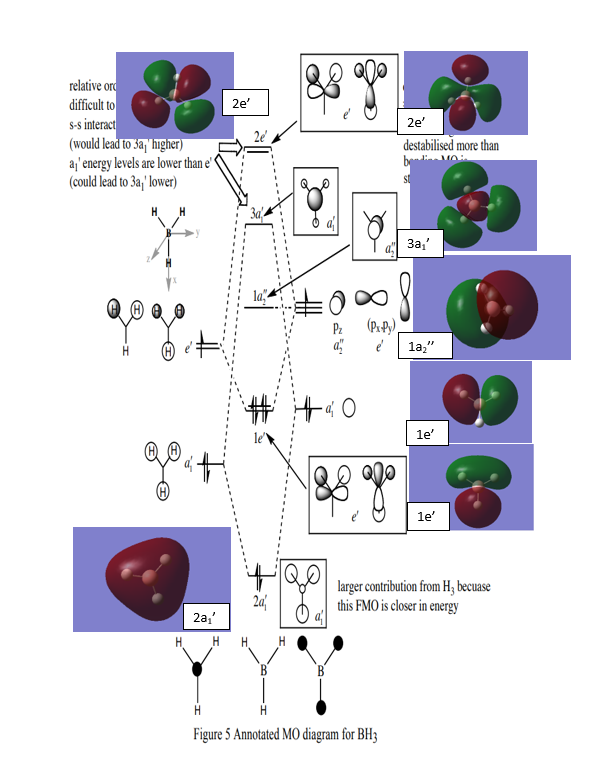
Q1. Are there any significant differences between the real and LCAO MOs?
Both of the diagrams give the similar results. the LACO MO is not gives very accurate MOs. In comparison to the real MOs and LCAO MOs, it can be confirmed that the method of LCAO can be used into the prediction of the MOs of Molecule.
Ng611 (talk) 16:03, 4 June 2019 (BST) I disagree, MO theory actually gives very accurate MOs that predict the general shape and phase relationship very well. There are SOME differences (more significant than differences in shape), can you identify them?
Q2. What does this say about the accuracy and usefulness of qualitative MO theory?
The accuracy of the LACO MO is not as high as the real MOs simulation but it is a reliable prediction of the real MOs in small molecule. In addition, the LCAO MOs can be used in prediction of small molecule but for more complex molecule. It will not be that useful.
Association energies: Ammonia-Borane
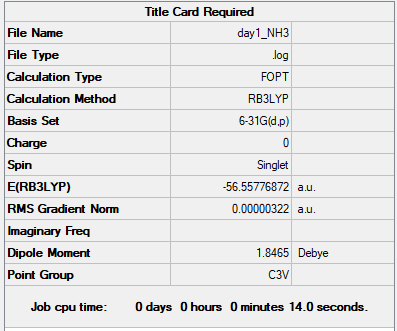
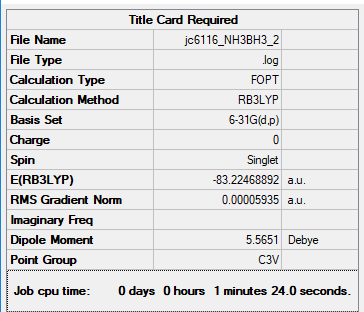
basis set of NH3 and NH3BH3
B3LYP/6-31G(d.p.)
Summary Table of NH3
Item table of NH3
        Item               Value     Threshold  Converged?
Maximum Force            0.000006     0.000450     YES
RMS     Force            0.000004     0.000300     YES
Maximum Displacement     0.000016     0.001800     YES
RMS     Displacement     0.000011     0.001200     YES
Low frequency of NH3
Low frequencies ---   -0.0138   -0.0032   -0.0015    7.0783    8.0932    8.0937
Low frequencies --- 1089.3840   1693.9368    1693.9368
NH3 molecule |
Summary Table of NH3BH3
Item Table of NH3BH3
        Item               Value     Threshold  Converged?
Maximum Force            0.000123     0.000450     YES
RMS     Force            0.000058     0.000300     YES
Maximum Displacement     0.000515     0.001800     YES
RMS     Displacement     0.000296     0.001200     YES
Low Frequency of NH3BH3
Low frequencies ---   -0.0254   -0.0034   -0.0012   17.0395   17.0420   36.9083
Low frequencies ---  265.7476  632.2122  639.3355
NH3BH3 molecule |
Association energies
E(NH3)= -56.55776872	 a.u.
E(BH3)=-26.61532364	 a.u.
E(NH3BH3)= -83.22468864	 a.u.
ΔE=E(NH3BH3)-[E(NH3)+E(BH3)]
 =-0.05159631 a.u.
 =-135.4660523 kJ/mol
 = ca. -135.47 kJ/mol
Ng611 (talk) 16:05, 4 June 2019 (BST) Too precise, your calculations are only accurate to ~1 kJ/mol and your answers should reflect this accuracy.
Based on your energy calculation is the B-N dative bond weak, medium or strong? What comparison have you made to come to this conclusion?
The dative bond of the B-N is reality weak (135 KJ/mol) compare with the C-C (346 KJ/mol) bond B-H bond (345 kJ/mol) 2.
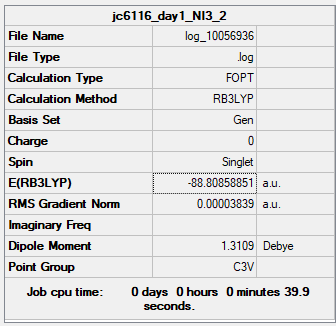
PPs and NI3
basis set
Summary Table
Item Table
        Item               Value     Threshold  Converged?
Maximum Force            0.000068     0.000450     YES
RMS     Force            0.000044     0.000300     YES
Maximum Displacement     0.000493     0.001800     YES
RMS     Displacement     0.000333     0.001200     YES
Low frequency
Low frequencies ---  -12.7380  -12.7319   -6.2907   -0.0040    0.0188    0.0633
Low frequencies ---  101.0326  101.0333  147.4124
NI molecule |
Bond Length
The Optimized bond distance is 2.184Å
Mini Project : Ionic Liquids
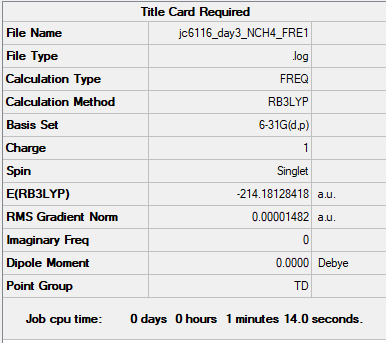
[N(CH3)4]+
B3LYP/6-31G(d,p)
Summary Table
Item Table
       Item               Value     Threshold  Converged?
Maximum Force            0.000068     0.000450     YES
RMS     Force            0.000017     0.000300     YES
Maximum Displacement     0.000922     0.001800     YES
RMS     Displacement     0.000282     0.001200     YES
Low Frequency
Low frequencies ---   -0.0004    0.0004    0.0009   22.4056   22.4056   22.4057
Low frequencies ---  188.7251  292.7157  292.7157
Media:JC6116_DAY3_NCH4_FRE1.LOG
JSOML
[N(CH3)4]+ |
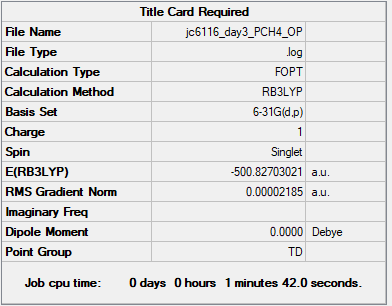
[P(CH3)4]+
B3LYP/6-31G(d,p)
Summary Table
Item Table
        Item               Value     Threshold  Converged?
Maximum Force            0.000128     0.000450     YES
RMS     Force            0.000032     0.000300     YES
Maximum Displacement     0.000666     0.001800     YES
RMS     Displacement     0.000277     0.001200     YES
Low Frequency
Low frequencies ---    0.0006    0.0015    0.0029   26.3157   26.3157   26.3157
Low frequencies ---  160.9744  195.4740  195.4740
Media:JC6116_DAY3_PCH4_FRE.LOG
JSOML
[P(CH3)4]+ |
Comparison of Charge Distribution
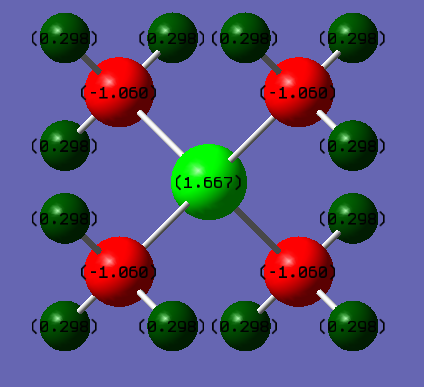
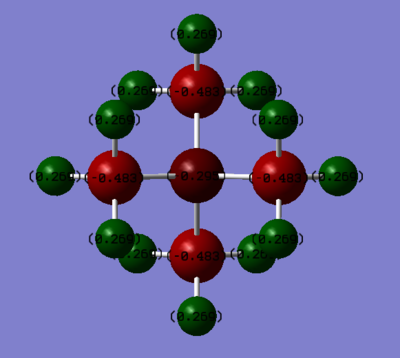
 Real Charge Distribution on Molecule
 [N(CH3)4]+   N:-0.295   C: -0.483    H: +0.269
 [P(CH3)4]+   P:+1.667   C: -1.252    H: +0.298
In the transitional formal charge assignment both ionic molecules [N(CH3)4]+ and [P(CH3)4]+ have +1 charge and the centre atom N and P have +1 charge. However, in the real situation, in [N(CH3)4]+, all the positive charge sit on each H atoms (+0.269), while in [P(CH3)4]+ positive charge spread on both H each (+0.298) and P (+1.667) atoms. This result can be explained by the electronegativity difference between atoms.3
In [P(CH3)4]+, C is the most electronegative atom while P and H have nearly the same electronegativity.(P: 2.1, H: 2.1, C: 2.5). Thus, the electron densities on the H and P atoms are pulled toward C atoms
In [N(CH3)4]+, N is the most electronegative atom (N: 3.0, C: 2.5, H: 2.1), therefore positive charge are all on H atoms.
The total charge are conserved to +1 for both ionic molecule
The Charge distribution are symmetrical through all space because the dipole moment are zero for both ionic molecules.
Ng611 (talk) 16:07, 4 June 2019 (BST) Good!
Ng611 (talk) 16:08, 4 June 2019 (BST) What about the discussion on formal charges for nitrogen?
Visualisation of [N(CH3)4]+ MOs
| MO | Real MOs | LCAO MOs | Ligand FO | Occupied? |
|---|---|---|---|---|
| MO = 10 | 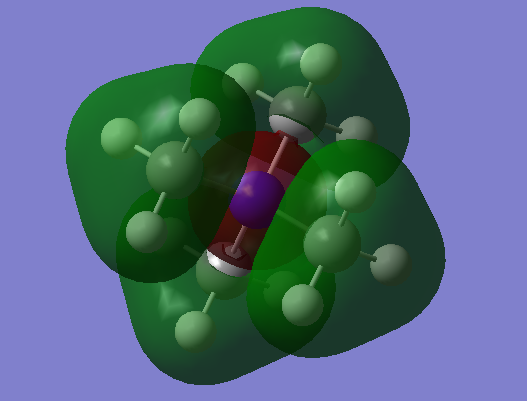 |
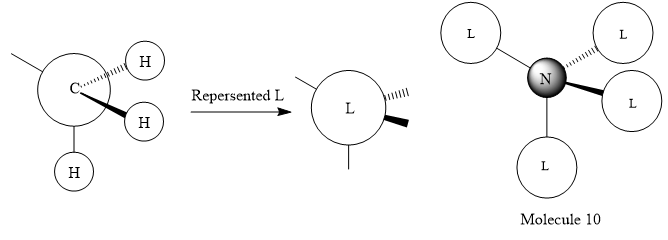 |
s-orbital of C, s-orbitals of 3 H | Yes |
| MO = 18 | 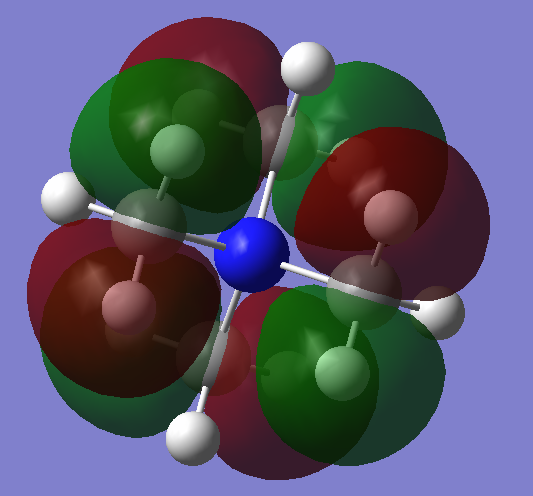 |
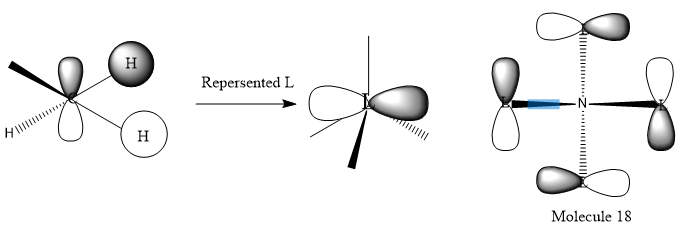 |
p-orbital of C, s-orbitals of 2 H | Yes |
| MO = 19 | 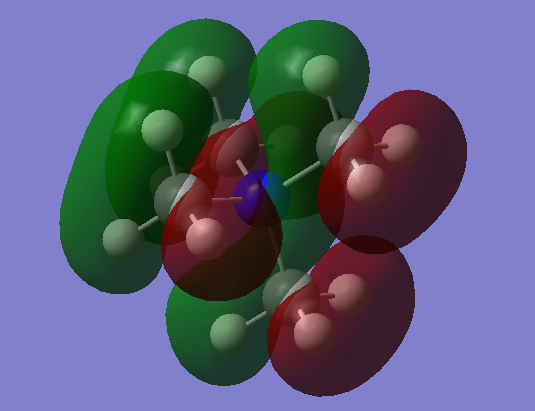 |
 |
p-orbital of C, s-orbitals of 3 H | Yes |
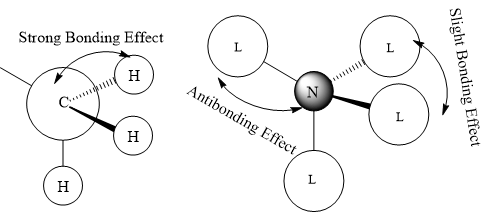
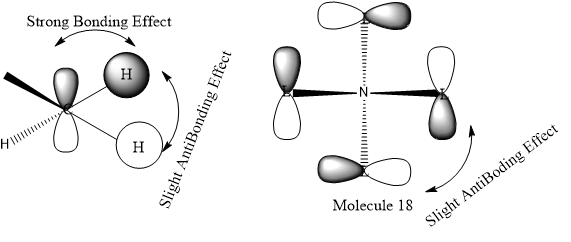
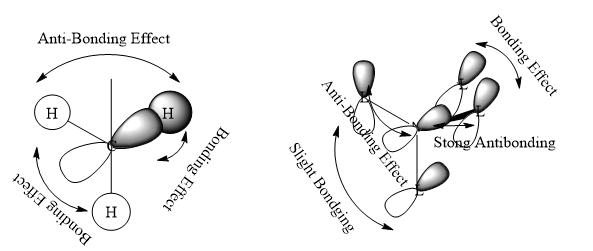
The Anti-bonding character increasing from MO 10 to MO 19.
In MO 10, all methyl groups are have strong bonding character and anti-bonding only take place at N s-orbital with the ligands. The Mo 10 are Bonding orbital.
In MO 18, in the methyl group there are strong bonding effect between p-orbital of carbon and the two H s-orbitals and slight anti-bonding effect through space between two H s-orbital. After hybridisation, the p-orbital like ligand orbital have anti-bonding effect through space with each other. The MO 18 are likely be the anti bonding orbital. It does not overlap with N atom.
In MO 19, in the methyl group there are strong bonding effect between p-orbital of carbon and the three H s-orbitals and slight anti-bonding effect through space between three H s-orbitals. After hybridisation, the p-orbital like ligand orbital have Strong anti-bonding effect with the N p-orbital and slight anti-bonding effect through space.
Ng611 (talk) 16:13, 4 June 2019 (BST) Good LCAO. You've done well to include your descriptions of the key interactions but you should label the interactions with more specificity. For example, are your interactions through space or along a bond. Are your nodal planes through your atomic centres or through bonds (and how strongly this affects your interactions). Comments about directionality and overlap are also important.
Reference
1.Hunt P. Lecture_4_Tut_MO_diagram_BH3. Inorganic Lecture Course. London: Imperial College London; 2019.
2.Yu-Ran Luo and Jin-Pei Cheng "Bond Dissociation Energies" in CRC Handbook of Chemistry and Physics, 96th Edition.
3.A.M. James and M.P. Lord in Macmillan's Chemical and Physical Data, Macmillan, London, UK, 1992.

