Rep:Mod:jamesmac1
TlBr3
The TlBr3 molecule was first drawn into GaussView 3.0. The molecule's point group symmetry was then restricted to the D3h point group and the tolerance increased to "very tight". A Gaussian optimisation was then run using the B3LYP method and the LanL2DZ "medium" level basis set. The optimised molecule was then viewed by opening the corresponding .out .log file. The optimised Tl-Br bond length is 2.651ű0.005Å and the optimised bond angle 120o±0.05o . Unfortunately a reference length for the Tl-Br bond could not be found, however a reference value was found for the Al-Cl bond in Aluminium trichloride. Given that Aluminium is in the same group as Thallium and that Aluminium trichloride is also planar with D3h point group symmetry (in solid and free gaseous states) this value can be used to gauge whether or not the computationally obtained value is sensible or not. The literature quotes the Al-Cl bond length to be 2.063Å[4]; as such it can be assumed that the value obtained from our Gaussian calculation is a sensible one. The summary file contained the following information.
| File Type | .log |
| Calculation Type | FOPT |
| Calculation Method | RB3LYP |
| Basis Set | LANL2DZ |
| E(RB+HF-LYP) | -91.22 a.u. |
| RMS Gradient Norm | 0.00000090 a.u. |
| Imaginary Freq | - |
| Dipole Moment | 0.0000 Debye |
| Point Group | D3h |
Here is the corresponding optimisation file and the molecule itself. https://wiki.ch.ic.ac.uk/wiki/images/2/2e/TLBR3_OPTIMISATION_JM.LOG
Some molecules, when optimised using GaussView, return a molecule which may have some bonds missing. At first sight it may appear that the bonds simply don't exist or have dissociated, this is not the case however. GaussView has a list of reference optimum bond lengths which it "consults" upon optimisation. A lot of these bond lengths are set-up with organic molecules in mind. The "real" bond lengths of inorganic molecules in particular often fall outside the values used by GaussView (the inorganic bonds are often longer than their organic counterparts). When this happens GaussView doesn't put the bonds in, making it appear that the atoms in question are not connected when in reality they are bonded together, just at a greater than "expected" internuclear separation.
In simple terms, a bond is an electrostatic attractive interaction between two nuclei which effectively connects the nuclei together so as to enter a more stable state (this is why many free radicals or isolated atoms are particularly reactive toward bond formation). On an electronic scale, the bond refers to the positive overlap of atomic orbitals (contributed from each atom) in which a nuclei's electrons are found. It is energetically favourable to combine those atomic orbitals which are of the correct symmetry to form molecular orbitals which extend across the entire molecule. It is in these molecular orbitals that the electron density of both nuclei reside; the resultant electrostatic attraction between the 2 positively charged nuclei to the electron rich molecular orbitals results in the two being chemically "bonded" together.
After optimising the molecule a frequency calculation was run, again using the B3LYP method and the LanL2DZ basis set. The B3LYP method is based on the density functional theory and is used to solve Schrodinger's equation so as to determine the electronic state and structure of the computed molecule. In DFT methods (B3LYP included) Schrodinger's equation is solved by finding the electronic density of the ground state. This is done by way of varying and ultimately minimising an external potential to which a ground state's electron density is intrinsically linked. The basis set effectively defines the number of different functions which may be combined to solve Schrodinger's equation and calculate the ground state electronic wave function. Using a larger basis set of smaller functions will allow for the wave function to be more accurately determined.
Naturally, using a different basis set and method will yield different ground state electronic wave functions for the same molecule. A different wave function means a different total energy as the two are linked by the Hamiltonian (energy) operator. The optimisation of a molecule's geometry is done by minimising the molecule's total energy; it is therefore not unreasonable to expect that different methods and/or basis sets will result in different geometries. The vibrational modes seen in a molecule are largely dependent upon bond strain and geometry. Keeping the method and basis set the same for both the optimisation and frequency calculations will ensure the two geometries and corresponding properties "match" up allowing for an accurate and valid analysis of the results.
We are performing all of these calculations so as to find the potential energy minimum of the molecule as dictated by its potential energy surface. Where the first derivative can tell us if there is a minimum or maximum present it is the second derivative of this surface which tells us whether it is a minimum or maximum that has been reached. A positive second derivative is characteristic of a minimum whereas a negative second derivative is characteristic of a maximum. The vibrational frequency of a molecule is effectively the second derivative of the potential energy surface and as such vibrational analysis may be used to determine whether the optimised geometry is in fact a minimum. All positive values for a molecule's vibrational frequencies will suggest a minimum has been reached and that the molecule has optimised correctly.
All of the vibrational frequencies returned were in fact positive and as such it may be concluded that this molecule has been optimised to a minimum. The real frequencies are tabulated below along with the corresponding "low" frequencies (vibrations of a molecule's centre of mass).
Note: Because these bond vibrations are computed as harmonic oscillations as opposed to anharmonic ones (which they are in reality) there is approximately a 10% error associated with each frequency quoted below; this will be taken into consideration.
| no | Vibrational Frequency/cm-1 | Intensity | Low Frequency/cm-1 |
|---|---|---|---|
| 1 | 46±5 | 4 | -3.4 |
| 2 | 46±5 | 4 | -0.0026 |
| 3 | 52±5 | 6 | -0.00040 |
| 4 | 165±17 | 0 | 0.0015 |
| 5 | 211±21 | 25 | 3.9 |
| 6 | 211±21 | 25 | 3.9 |
As the table above shows, the lowest "real" frequency is 46cm-1±5cm-1 . Ideally the low frequencies need to be as close to zero as possible representing little movement in the molecule's centre of mass. These low frequencies are therefore relatively accurate as they are all close to zero.
BH3
The optimisation that was carried out for TlBr3 was repeated here for BH3 using the B3LYP method and the 3-21G basis set. The corresponding .chk file was then opened and an energy calculation run using the B3LYP method and 6-31G basis set. The additional keywords "pop=full" were added to the input file and "full NBO" was selected for these calculations. Here is the published result and optimised geometry itself. http://hdl.handle.net/10042/to-5695
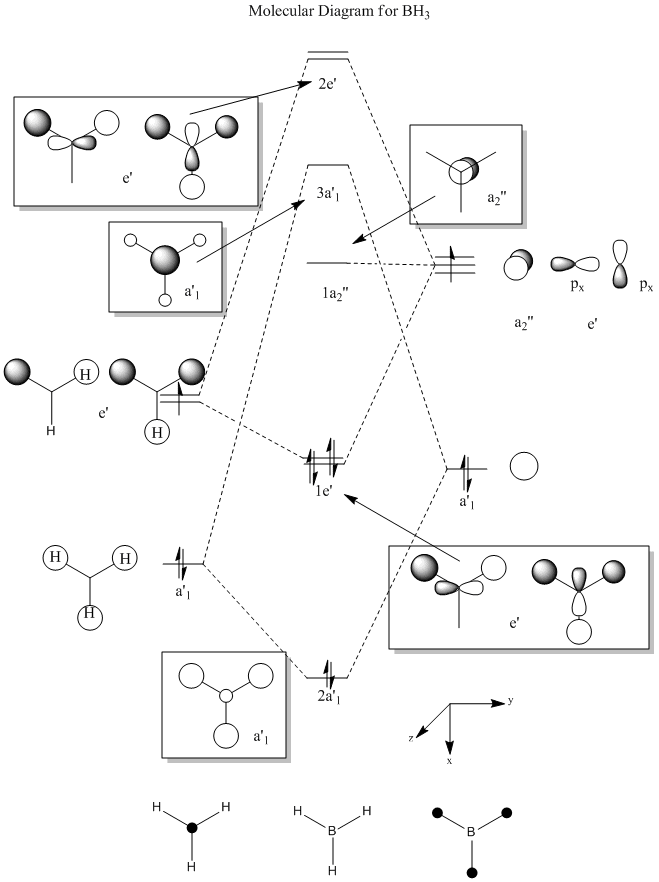
The first 8 molecular orbitals were then computed and visualised, and then added to the following molecular orbital diagram (drawn using ChemDraw).
Comparing the GaussView-visualised molecular orbitals and those resulting from simple linear combination of atomic orbitals shows good agreement between the two with respect to orbital shape and alignment. The two don't agree as well with respect to orbital size, however. This is particularly prominent with regards to the 1a2" non-bonding orbital. According to LCAO the molecular orbital will resemble the sole p-orbital it is made from. Whilst the molecular orbital obtained from GaussView is accurate in so much that there are 2 lobes of opposing phases aligned along the z-axis, the lobes themselves are much larger and more (semi-) spherical in shape compared to lobes expected of a p-type orbital. Despite this discrepancy (which isn't a big problem) GaussView provides a very good means of generating and analysing molecular orbitals of (simple) molecules by virtue of its relatively high accuracy. It is likely however this accuracy will fall with larger and more complex molecules.
Now natural bond orbital analysis may be carried out; to do so the corresponding Gaussian .log file was opened. First of all the NBO charges were calculated with the Boron atom carrying an atomic charge of +0.332 and the Hydrogen atoms each -0.111. This result reflects the electron deficient Lewis acidic nature of the Boron atom.
A new Gaussian Logfile was then created to calculate the vibrational modes of BH3 . 6 vibrational modes were calculated for this molecule, they are summarised in the table below.
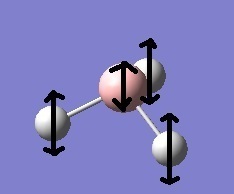
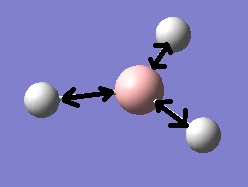
The first vibrational mode consists of a concerted bending of all 3 B-H bonds moving the 3 Hydrogen atoms both above and below the molecular plane in an oscillating fashion.
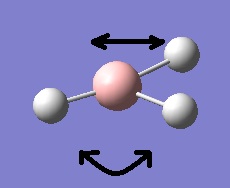
In the second vibrational mode 1 of the B-H bonds remains static whilst the other 2 bend causing the 2 corresponding Hydrogen atoms to move toward each other and then away in a concerted manner.
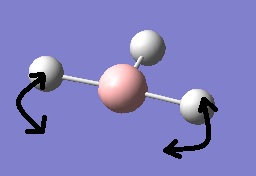
The third vibrational mode consists of 1 B-H bond swinging in an exaggerated pendulum-like swing with the other 2 B-H bonds swinging (to a lesser extent) in the opposing direction; these 2 B-H bonds are fixed with respect to each other.
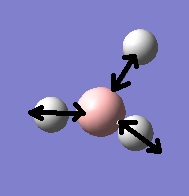
The fourth vibrational mode is a concerted symmetric stretching of all 3 B-H bonds.
In the fifth vibrational mode, 2 of the B-H bonds undergo asymmetric stretching with respect to each other. The Boron atom moves slightly in these stretches whilst the third Hydrogen atom remains fixed, resulting in slight distortion of the third B-H bond.
In the final vibrational mode 1 of the B-H bonds undergoes significant stretching whilst the other 2 stretch to a lesser extent and in the opposing direction (symmetrical stretching with respect to each other).
The corresponding IR spectrum is pictured right.
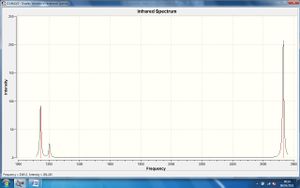
In this spectrum there are only 3 observable peaks despite there being 6 vibrational modes. As the table above shows, modes 2 and 4 and 5 and 6, have the same vibrational frequency as each other. As such, the peaks arising at approximately 1200cm-1 and 2700cm-1 are a result of combined IR emissions from 2 vibrational modes at the same frequency thus giving rise to combined readings on the spectrometer. There is no peak observed at approximately 2600cm-1 corresponding to the fourth vibrational mode because this mode is not IR active. For a molecule or bond to be IR active the corresponding vibration must result in a change in overall dipole moment. Because the fourth vibration is completely symmetric (as defined by its symmetry label) the dipole moment is unchanged upon bond stretching; it is therefore not IR active and does not give rise to a peak in the spectrum.
Mo(CO)4(PCl3)2
First of all, the two isomers were optimised using the B3LYP method and LANL2MB basis set. Convergence was also set to "loose". This provided an "approximate" for the optimised geometry. It was noted that the P-Cl bonds had seemingly disappeared after carrying out this optimisation (and the following one). As explained previously, this simply means that the "real" bond length falls outside the expected range used by Gaussian. To improve it further (to truly achieve a minimum) some of groups were manually changed. In the case of the trans-isomer the the Phosphorous trichloride groups were rotated so that all of the P-Cl bonds were eclipsed with those of the opposing PCl3 group. For the cis-isomer the Cl-P-Mo-C torsional angle (for one P-Cl bond in both PCl3 groups) were set to 0o . Having done this the new geometries were optimised again, this time using the LANL2DZ basis set with the B3LYP method. The loose convergence was removed and a tighter electronic convergence set. The links for these two optimisations are provided.
Trans-isomer optimisation- http://hdl.handle.net/10042/to-5703 Cis-isomer optimisation- http://hdl.handle.net/10042/to-5704
Next, the frequency calculations were run of the two molecules, again using the B3LYP method, LANL2DZ basis set and tight electronic convergence. To ensure both of the optimised geometries were at potential energy minima the frequency tables were checked for both molecules to make sure there were no negative frequencies (representing transitions states normally). Neither molecules display any negative vibrational modes so it may be concluded that energy minima have been reached. The links to both frequency calculations are given below.
Trans-isomer frequency- http://hdl.handle.net/10042/to-5705 Cis-isomer frequency- http://hdl.handle.net/10042/to-5706
First of all the geometries and related geometric parameters of the two isomers will be compared. In particular the dihedral angles and bond lengths will be compared. The optimised geometries were as follows.
Trans-Complex
Cis-Complex
| Bond | Bond Length/ű0.005Š|
|---|---|
| Mo-C | 2.06 |
| Mo-P | 2.45 |
| P-Cl | 2.24 |
| CO | 1.17 |
| Bond | Bond Length/ű0.005Š|
|---|---|
| Mo-C | 2.06 |
| Mo-P | 2.51 |
| P-Cl | 2.24 |
| CO | 1.18 |
Literature values have been found for these bonds to ensure these results are sensible and to check the calculations have worked properly. It should be noted that some of these reference values aren't necessarily for the same bond and are certainly not from the same molecule. They are approximate figures purely for checking sensibility more than anything.
| Bond | Bond Length/Å |
|---|---|
| Mo-CO(R) | 2.11[1] |
| Mo-PMe3 | 2.46[1] |
| P-Cl | 2.04[3] |
| C=O | 1.13[2] |
These values are close to those predicted computationally so it may be concluded that the calculations did in fact work and the results are valid for analysis.
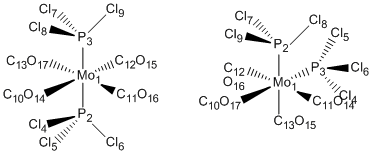
Next, the dihedral angles were computed for both molecules, these have been tabulated below. For an easier comparison between the two the atoms have been numerically labelled as follows.
| Torsion | Dihedral Angle/o±0.05o |
|---|---|
| Cl4-P2-Mo-C10O | 0.025 |
| Cl5-P2-Mo-C13O | 32 |
| Cl6-P2-Mo-C12O | 32 |
| Cl7-P3-Mo-C13O | 0.066 |
| Cl8-P3-Mo-C10O | 32 |
| Cl9-P3-Mo-C12O | 32 |
| Torsion | Dihedral Angle/o ±0.05o |
|---|---|
| Cl4-P3-Mo-C13O | 24 |
| Cl6-P3-Mo-C11O | 6.5 |
| Cl5-P3-Mo-P2 | 40 |
| Cl7-P2-Mo-C12O | 6.5 |
| Cl9-P2-Mo-C10O | 24 |
| Cl8-P2-Mo-P3 | 40 |
As these tables show, the Dihedral angle made between neighbouring ligands are very similar for both complexes. It is interesting to see that the Cl-P-Mo-C torsional angle is smaller in the cis-isomer (by 8o) however the Cl-P-Mo-P torsional angles are larger (by 8o as well) than the corresponding Cl-P-Mo-C angles of the trans-isomer. It may well be the case that an overlap of a P-Cl and Mo-P bond is electronically more repulsive (and hence less favourable) than an overlap of a P-Cl and Mo-C bond. It is possible that the Mo-P bond contains greater electron density than the Mo-C bond causing greater repulsion and a need to maintain a slightly larger Dihedral angle. In rotating the PCl3 group to reduce this repulsive term the Cl-P-Mo-C Dihedral angle would be smaller as seen.
Rather interestingly the summary file shows that both isomers have the same energy. Initially the simpler LANL2MB basis set was used returning a total energy of 617 a.u. for both isomers. To enhance the accuracy of these calculations the geometry was modified and then optimisation run again with the better LANL2DZ basis set. This has also yielded the same total energy for both isomers, this time a value of 624 a.u.. One would expect the two to have a difference in energy between the two because the cis-isomer suffers steric hindrance by virtue of the neighbouring PCl3 groups whereas the axial P-Mo bonds may be expected to be somewhat weakened by the trans-effect of the opposing electron-withdrawing PCl3 groups. Bearing this in mind it may be concluded that there has been an error somewhere either before or during the creation of the Gaussian optimisation file and as such no valid conclusions may be reached. It may be predicted however that steric and geometric effects will dominate over electronic effects and as such one would expect the trans-isomer to be more stable.
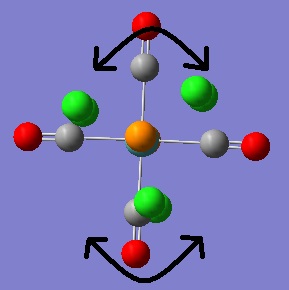
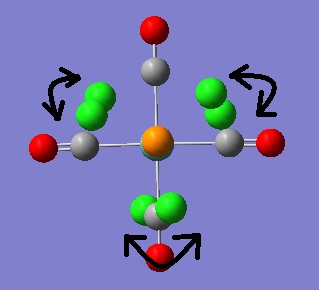
The vibrational analysis will now be carried out. Whilst no negative frequencies were obtained for the vibrational modes of both isomers there were a couple of vibrations at very low frequency, they are illustrated below.
| Vibrational Mode | Frequency/cm-1 | Intensity |
|---|---|---|
 |
5±0.5 | 0.09 |
 |
6±0.6 | 0 |
The first vibrational mode shown is a result of twisting of the CO ligands about the P-Mo-P axis. The second mode shown is the twisting of the PCl3 groups themselves. If these are "real" vibrational modes (hard to tell with such low intensities) then it may be assumed that these motions occur readily at room temperature because they are so low in energy.
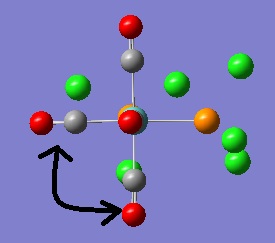
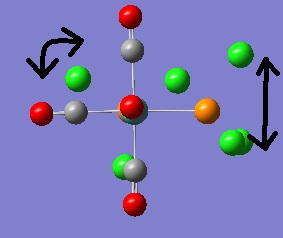
The first couple of very low vibrations are the same in the cis-isomer with the first mode a twisting of the CO ligands about the primary rotational axis and the second mode a twisting of the PCl3 groups. Again these vibrations would be observed at room temperature due to their low frequencies, assuming they are in fact "real" modes of vibration.
| Vibrational Mode | Frequency/cm-1 | Intensity |
|---|---|---|
 |
11±1.1 | 0.03 |
 |
18±1.8 | 0.007 |
| Frequency/cm-1 | Intensity |
|---|---|
| 1945±195 | 763 |
| 1949±195 | 1498 |
| 1958±196 | 633 |
| 2023±202 | 598 |
In 2nd year synthetic labs analogous cis- and trans- M(CO)4L2 Molybdenum complexes were made and then analysed with IR spectroscopy. The "real" CO stretching frequencies obtained for the cis-isomer were 1890cm-1, 1913cm-1, 1996cm-1 and 2012cm-1. Numerically, these values compare favourably suggesting the computational results are valid. More importantly however, the fact that 4 CO stretching bands were observed in the real spectrum confirm that the 4 computed modes are real and IR active.
The cis-isomer is a part of the C2v point group. Taking the 4 possible CO vibrations in this molecule and applying all of the appropriate symmetry operations (as dictated by the point group) none of the vibrational modes come back as being totally symmetric with respect to each symmetry element. Therefore all 4 of the stretching bands are IR active which agrees with the prediction made computationally.
| Frequency/cm-1 | Intensity |
|---|---|
| 1950±195 | 1475 |
| 1951±195 | 1467 |
| 1977±198 | 1 |
| 2031±203 | 4 |
The CO stretching frequencies obtained in the lab for the trans-isomer were 1890cm-1 and 2013cm-1. Numerically the two correlate well, suggesting valid results. Most interestingly however, only two stretching bands were seen in reality confirming that the two highest predicted frequencies are of sufficiently low intensity that these vibrational modes are effectively IR inactive and thus not observed. Oddly enough however it is expected that there will only be 1 CO stretching band for this isomer; this is covered below.
The trans-isomer belongs to the D4h point group. Taking the 4 potential modes of vibration and applying the necessary symmetry operations 3 of the 4 modes are totally symmetric and are as such IR inactive. Only 1 band is therefore expected to be seen in the IR spectrum. This disagrees with what is observed both in the computationally predicted results and reality. It may well be that more complex vibrations are seen in reality; for instance distortion of other parts of the complex may alleviate the symmetry of the CO stretches giving rise to another band. Vibronic motion (resulting from combined electronic and vibrational transitions) may also distort the molecule in ways that can't be predicted by simply looking at the CO stretches. Again the effect of such an unaccounted for motion would be the loss of symmetry of one of the vibrational modes resulting in a second band in the IR spectrum.
Mini-Project
In this mini-project Borazine and some of its organic and inorganic analogues will be explored. First of all, Borazine's electronic structure will be investigated and explained with benzene as a reference for comparison. Using this knowledge as a foundation, the properties (electronic, geometric) will be predicted for an Aluminium/Phosphorous Borazine analogue and then confirmed/disapproved with "exploratory" calculations. The final part of this project will look at the differences/similarities between a Borazine dimer and it's corresponding Benzene analogue. The primary aim here is to determine which dimer is more stable and whether it is largely electronic (Molecular orbital) factors or energetics (geometric) which result in the observed difference.
First, Borazine and it's properties are going to be studied. The molecule was drawn using GaussView 3.0 and then saved as an input file (.gjf). Due to the similarities between Borazine and Benzene on account of isoelectronics and aromaticity Borazine was drawn as a flat planar molecule like Benzene. The molecule was then submitted for an energy optimisation calculation. Because this molecule is relatively simple both in its size and geometry a medium-level basis set will be used; in this case the B3LYP (DFT) and LANL2DZ basis set was used. The electronic convergence was increased by typing "int=ultrafine scf=conver=9" into the additional keywords box of the Gaussian input window. These calculations ran to completion in a matter of minutes so it may be assumed that a higher basis set may be used for more accurate results without requiring too much computing time. The optimised molecule from before was optimised again, this time using the MP2 method and 6-311G basis set.
Whilst Benzene will not be looked at in any detail it will make for a good reference point when discussing Borazine's electronic properties (namely its aromaticity). As such Benzene was drawn into GaussView and then optimised in the same way as above (using the same basis set and method).
The optimised Borazine molecule is planar as shown below.
http://hdl.handle.net/10042/to-5845
Having optimised the molecule, a frequency calculation was run using the same method and basis set as before. In the additional keywords section "pop=(full,nbo)" was typed to allow for a molecular oribital and natural bond orbital analysis to be carried out.
Here is the published result from this calculation. http://hdl.handle.net/10042/to-5848
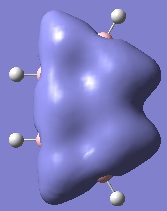
The NBO calculations will be looked at first in order to get an idea of the polarity and charge distribution within this molecule. The picture to the right shows the charge distribution within the molecule where bright green represents a large positive charge, red represents a large negative charge and black is an intermediate between the two.
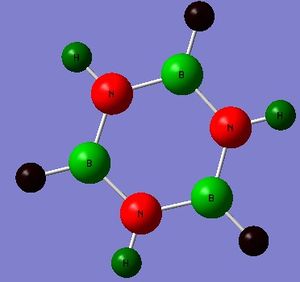
Below are the tabulated charges for ease of comparison.
| Atom | Charge |
|---|---|
| N | -1.16 |
| B | 0.881 |
| H(-N) | 0.397 |
| H(-B) | -0.118 |
This data illustrates the fact that there is a build up of electron density and charge on the Nitrogen atoms as shown by the relatively large negative value whereas at the Boron atoms there is a distinct electron deficiency and corresponding positive charge (again relatively large). Whilst the charges of the Hydrogen atoms are much smaller the sign of the values supports the fact that the Nitrogen atoms are electronegative and the Boron atoms somewhat electropositive in this molecule. This correlates with the fact that the Nitrogen atoms are Lewis basic (electron rich) and each contain a lone pair-filled p-orbital whereas the Boron atoms are Lewis acidic (electron deficient) and contain a vacant p-orbital. It is therefore reasonable to expect that electron delocalisation may be observed where the Nitrogen atoms may donate electrons into the vacant Boronic p-orbitals. The typical donor-acceptor molecular orbital diagram has been illustrated below.
As the diagram shows, the donor orbital in this case is a lone pair-filled 2p orbital on a Nitrogen atom and the acceptor orbital a vacant 2p orbital on an adjacent Boron atom. The donor atomic orbital is relatively low in energy due to the electronegativity of the Nitrogen atom; Boron on the other hand is electropositive so the acceptor atomic orbital is relatively high in energy. These 2 atomic orbitals combine to form a bonding MO and corresponding anti-bonding MO. The overall energy of the system is lowered by forming such interactions as only the stabilised bonding MO is occupied by electrons. If the stabilisation E2 is large then participating in donor-acceptor interactions becomes even more energetically favourable and hence more likely. The log file for this calculation shows the stabilisation energy (E2) between the Boron and Nitrogen atoms to be 10-12kcal mol-1 . This is a relatively large stabilisation energy and as such it may be concluded that electron donation from Nitrogen to Boron will occur. Below are the resonance delocalisation forms resulting from the above N-B donor-acceptor interactions.
Although these resonance forms are extreme "snap-shots" they clearly illustrate how the electrons are able to move around the ring. It is this cyclic delocalisation of electrons that allows for the conclusion that Borazine is in fact aromatic. Each Nitrogen atom contributes 2 π-electrons to the system equating to 6 π-electrons in total. Borazine therefore obeys Huckel's rule (4n+2) where n is equal to 1 and can be said to be aromatic.
Also of interest is the orbital hybridisation of each atom in Borazine; this is also found in the NBO log file. It can be seen that the hybrid orbitals formed by the Boron atoms are composed of 32% s-character and 68% p-character. This means that the Boron atoms are effectively sp2 hybridised. The Nitrogen-bound orbitals are comprised of 39% s-character and 61% p-character meaning that the Nitrogen atoms are approximately sp2 hybridised as well. This supports the fact that electron delocalisation is occurring because if the Nitrogen lone pair was bound entirely to the atom (localised) then the atom would need to be sp3 hybridised to accommodate the additional electrons. Isolated sp2 hybridised molecules are often planar (trigonal planar) such as BH3 and it is therefore fair to argue that Borazine is also planar on account of all of its ring-centres being sp2 hybridised as well.
To confirm the aromatic character of Borazine, its molecular orbitals will now be looked at.
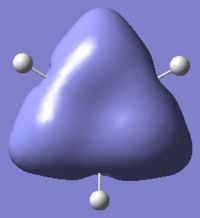
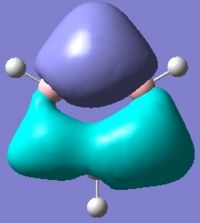
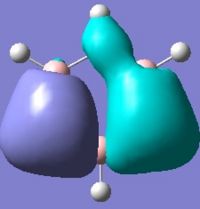
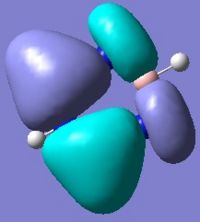
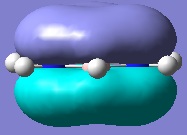
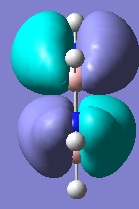
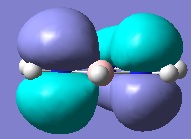
Below are pictures of the molecular orbitals which best illustrate the extensive electron delocalisation seen for this molecule.
| Aromatic MOs of Borazine | ||
|---|---|---|
|
|
|
|
|
|
| ||
The earlier molecular orbitals are predominantly made up from s-type atomic orbital contributions from the ring's Boron and Nitrogen atoms. They combine to form small localised molecular orbitals which closely resemble the s-type atomic orbitals they are derived from. Going higher in energy, larger and more complex molecular orbitals such as the ones pictured above are observed. It can be seen that these molecular orbitals span the entire ring, effectively "clouding" the molecule in electron density. This is a very strong argument for aromaticity because it shows the electrons are able to move across the entire molecule as opposed to being restricted to smaller localised molecular orbitals as seen for non-aromatic molecules.
For comparison, the molecular orbitals of Benzene were briefly looked at. The molecule was first optimised using the MP2 method and 6-311G basis set (http://hdl.handle.net/10042/to-5861) and then a frequency calculation was run using the same method and basis set (http://hdl.handle.net/10042/to-5864). Molecular orbitals which are very similar in appearance to those of Borazine (see above) were also observed in Benzene. It also worth noting that all of the occupied molecular orbitals of Borazine are bonding overall with energies lower than the non-bonding level (i.e. negative energy values); the HOMO resides just below the non-bonding level and the LUMO slightly above it. It's a similar case in Benzene where all of its occupied MOs are also bonding overall. In the case benzene however, there are also some unoccupied MOs just below the non-bonding level. These similarities are of course on account of the fact that Benzene and Borazine are isoelectronic to one another, the difference being that each Carbon atom contributes a single electron to the delocalised π-system.
On moving down the group by a period and replacing the Boron atoms with Aluminium atoms and Nitrogen with Phosphorous it would perhaps be expected that the geometry of the ring would stay the same so as to remain planar and maintain optimal delocalisation. At first this seems reasonable as the sizes of the atoms are not changing dramatically and the valency isn't changing at all. It is interesting then that the structure returned after optimisation is in fact bent with respect to the ring centres. Because the molecule is no more complex than before the higher level 6-311G basis set and MP2 method was used again for the optimisation and proceeding frequency calculation.
http://hdl.handle.net/10042/to-5878
This is the published frequency calculation. http://hdl.handle.net/10042/to-5879
As before, the NBO analysis will be looked at first.
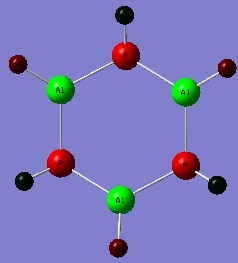
| Atom | Charge |
|---|---|
| P | -0.811 |
| Al | 1.10 |
| H(-P) | 0.0620 |
| H(-Al) | -0.352 |
These charge values are to be expected as the Phosphorous atom is electronegative and the Aluminium atom is electropositive. On moving down the group the atomic radii increases and the effective nuclear charge decreases. With a smaller effective nuclear charge a nuclei's electron "pulling-power" is reduced and as such the electronegativity decreases and the electropositivity increases. This reflects the respective decrease in negative charge on the Phosphorous atom and increased positive charge on the Aluminium atom. The negative charge of the Phosphorous atom shows that it is still inherently Lewis basic whilst the positively charged Aluminium atom is still Lewis acidic. As such this analogue has the potential to be aromatic like Borazine. Interestingly the stabilisation energy (E2) of the Al-P interaction is smaller than that of the B-N interaction at 8-10 kcal mol-1. This shows that forming donor-acceptor interactions between the Phosphorous and Aluminium atoms whilst still stabilising in energy, will be less favourable and perhaps somewhat weaker. It is also worth noting that Al-P bond polarity is still close to the B-N bond polarity so it is therefore sensible to conclude that these bonds are just as reactive as those in Borazine.
The most interesting part of the NBO log file however is the atomic hybridisation data. In Borazine both the Boron and Nitrogen atoms were said to be sp2 hybridised. The log file shows that the orbital character on the Aluminium atoms is similar to what it was before with a 31% s-type contribution and a 69% p-type contribution. The Phosphorous atoms on the other hand now consists of 21% s-type character and 79% p-type character. Such orbital contributions are close to the ideal 25%/75% ratio expected of an sp3 hybridised orbital. As was mentioned above, sp2 hybridised molecules tend to to be planar; the BH3 as explored at the beginning of this module is trigonal planar for instance. NH3 , for example is sp3 hybridised with the additional orbital accommodating the Nitrogen lone pair. Because of this, the geometry adopted is bent instead of planar as dictated by Valence-Shell Electron Pair Repulsion (VSEPR) theory. It can then be imagined that in this Borazine analogue when the p-orbital character increases (moving from sp2 and closer to sp3 ) the bonds surrounding the Phosphorous atom become bent resulting in the observed bent geometry of the molecule.
This leads onto another important conclusion. In Borazine the Nitrogen atoms are sp2 hybridised and as such it has no orbitals to accommodate its lone pair leading to the conclusion that these electrons must be delocalised across the ring. In the case of the analogue however, moving toward sp3 hybridisation suggests there is now an orbital available on the Phosphorous atom to contain the lone pair. This suggests that the lone pairs are much more localised with very little delocalisation. Based on this argument it can be concluded that this analogue is much less aromatic in comparison to Borazine and perhaps not aromatic at all. By looking at the molecular orbitals of this molecule it may be confirmed whether or not this is the case.
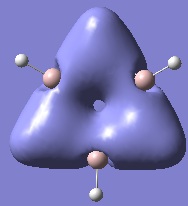
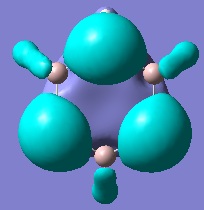
The two MOs shown on the right correspond to pictures 1 and 5 respectively in the tabulated aromatic MOs of Borazine. It can be seen here however that the orbitals no longer cover the Aluminium atoms and some parts of the ring. It is therefore plausible to conclude that these molecular orbitals are predominantly made up of the lone pair-containing sp3 hybrid orbitals of the Phosphorous atoms. The other molecular orbitals that showed aromaticity and electron delocalisation in Borazine no longer do to such a great extent. Before, these orbitals were much larger and were separated only by nodal planes. Now the molecular orbitals are split into much smaller lobes and are separated by larger areas of space. This is conclusive evidence that the extent of electron delocalisation and hence its aromaticity is severely reduced in this Borazine analogue. Because the bonds in this molecule are still polar and the molecule is much less aromatic it can be predicted that this analogue will be much more reactive than Borazine itself.
Finally, a Borazine dimer in which 2 rings are laterally fused to one another will be investigated and compared to the corresponding Benzene analogue (Napthalene). The aim here is to determine which dimer is the most stable and the reason for this stability.
Because these two molecules are larger a simpler medium level basis set will be used for both the optimisation and frequency calculations, in this case the LANL2DZ basis set and DFT B3LYP method.
The published optimisation file for Napthalene is here. http://hdl.handle.net/10042/to-5931 . The published optimisation file for the Boron nitride analogue of Napthalene is here. http://hdl.handle.net/10042/to-5932 .
The molecules are as follows.
A frequency analysis with corresponding full NBO and MO analysis was run next.
The published frequency file for Napthalene is here. http://hdl.handle.net/10042/to-5933 . The published frequency file for the Boron nitride analogue of Napthalene is here. http://hdl.handle.net/10042/to-5934 .
The natural bond orbitals of each Carbon atom in Napthalene are shown to consist of 35% s-orbital character and 65% p-orbital character. In the Boron nitride analogue the Nitrogen NBOs show 34% s-orbital character and 66% p-orbital character and the Boron NBOs show 32% s-orbital character and 68% p-orbital character. The hybridisation seen in both molecules is the same then, with the Carbon, Nitrogen and Boron ring centres all displaying sp2 hybridisation.
The NBO log file also shows the stabilisation energy (E2) that arises from the C-C and B-N donor-acceptor interactions. The stabilisation energy ranges between 11 and 14 kcal mol-1 for the C-C and B-N bonds in the respective molecules. Bearing this information in mind it is hard to predict which dimer would be more stable as the C-C and B-N donor-acceptor interactions are equally favourable and the hybridisation suggests a similar level of electron delocalisation ( i.e. aromaticity).
Although the NBO log file is not needed to know this, the B-N bond is particularly polar on account of the electronegativity difference between the two atoms and as such is much more reactive than the C-C bond which isn't very polar at all. This hints that the Boron nitride analogue is more reactive and hence less stable than Napthalene, however more conclusive evidence will be required to support this conclusion.
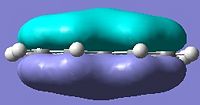
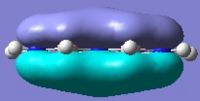
A brief look at the molecular orbitals will confirm if the extent of delocalisation and aromatic stabilisation is similar for the two dimers.
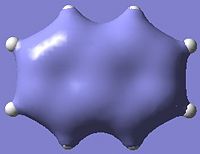
| Aromatic MOs of Napthalene and Boron Nitride Analogue | ||
|---|---|---|
|
| |
|
| |
Unfortunately those molecular orbitals which show extensive electron delocalisation and aromatic character (some of which are illustrated above) are so similar to each other in both molecules that it is difficult to quantitatively distinguish between the two, let alone determine which of the two would be more stable.
A detailed look at the frequency analysis may prove useful it making a prediction.
The Infra-red spectra for the two molecules are provided on the right.
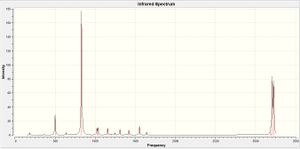
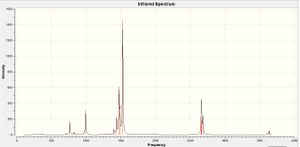
Below are a couple of frequency tables noting the intense vibrations observed in both molecules.
| Frequency | Intensity | Vibrational Mode |
|---|---|---|
| 830±83 | 177 | C-H bending |
| 3209±321 | 79 | C-H stretching |
| 3226±323 | 71 | C-H stretching |
| Frequency | Intensity | Vibrational Mode |
|---|---|---|
| 769±77 | 172 | B-H/N-H bending |
| 996±100 | 309 | B-H/N-H bending |
| 1441±144 | 211 | B-N stretching |
| 1477±148 | 573 | B-N stretching |
| 1489±149 | 273 | B-H/N-H bending |
| 1530±153 | 1469 | B-N stretching |
| 2659±266 | 237 | B-H stretching |
| 2662±266 | 187 | B-H stretching |
| 2665±267 | 119 | B-H stretching |
| 2683±268 | 225 | B-H stretching |
| 3639±364 | 39 | N-H stretching |
One of the first things to notice is that there are multiple sharp high intensity peaks in the spectrum of the Boron nitride analogue compared to the Napthalene spectrum. The vibrational results table shows that there are just as many vibrational modes for Napthalene as there are for the analogue, however many of them have an intensity of 0. For many modes this will simply be a question of symmetry. In Napthalene all of the ring atoms are the same and so all of the bonds to the outer Hydrogen atoms are the same length (1.09ű0.005Å). This means that many of the vibrational modes will be symmetric giving rise to no overall change in dipole moment and as such are not IR active. In the analogue however the difference in electronegativity between the Boron and Nitrogen atoms results in the respective B-H and N-H bonds varying in strength and consequently in length as well. In this molecule the B-H bonds are 1.19ű0.005Å and the N-H bonds 1.01ű0.005Å suggesting the N-H bonds are somewhat stronger than the B-H bonds. This difference in bond length and strength means that any bond stretching or bending that occurs will affect the 2 types of bond differently. This will give rise to asymmetric vibrational modes and a change in the overall dipole moment meaning these modes will now become IR active giving rise to non-zero intensities.
For some of the vibrational modes however the intensities may be zero or very low if said modes are not "real" modes of vibration (i.e. not observed in reality). In the IR spectrum it can be seen that there are multiple peaks of very low intensity between 1000 and 1600cm-1 reaching an intensity of 160 at the most. The analogue's spectrum on the other hand, shows a few high intensity peaks as high as approximately 1500. This region corresponds to vibrational modes pertaining to the movement of the ring atoms. Low intensities in this region for Napthalene suggest that vibrations resulting in significant movement of the Carbon atoms do not occur in reality. The corresponding vibrations for the analogue are much more intense leading to the conclusion that vibrations and movements of the B-N bonds are more likely to be observed in reality. This is summarised well in the tables above which show no significant C-C stretches or bends in Napthalene whereas there are intense B-N stretches in the BN analogue.
Although the C-C vibrational modes are not considered "real" the frequencies they would occur at are higher than those of the B-N bonds as given by GaussView. This suggests that the C-C bonds are stronger and require more energy to perturb compared to the B-N bonds.
A couple of conclusions may be drawn from this information. First of all, it tells us that perhaps the C-C bonds are stronger than the corresponding B-N bonds and are less easily perturbed by vibrational motion. As an extension of this idea it suggests that the entire napthalene molecule is inherently more stable in its ground vibrational state and is less easily perturbed in comparison to the Boron nitride analogue. The most likely reason for this is the aromatic character of the two dimers. Whilst the MO and NBO analysis show little difference with regards to donor-acceptor and delocalisation effects, it may well be that the aromatic character of Napthalene is much greater than that of its BN analogue. If the aromatic character of Napthalene is higher on account of increased electron delocalisation and stronger conjugation it's sensible to assume that the molecule will be much harder to excite vibrationally; reducing the number of "real" modes observed in the IR spectrum. If the BN analogue on the other hand, has weaker B-N bonds and reduced stabilising aromatic character the structure will be more easily perturbed vibrationally giving rise to much more intense IR peaks, reflecting strong "real" vibrational modes. If this is the case it may be predicted that Napthalene is more stable than the BN analogue on account of electronics and an increased aromatic character.
Literature[5] is available that suggests that the aromatic character of Borazine is roughly half that of Benzene. As an extension of this one may assume that Napthalene does in fact display greater aromatic character relative to the BN analogue. This validates the prediction made above allowing one to conclude with confidence that Napthalene is more stable than the Borazine analogue.
References
[1] 1. Orpen, A. G., Brammer, L., Allen, F.H., Kennard, O., Watson, D. G., Taylor, R., J. Chem. Soc. Dalton Trans., 1989, S1-S83.
[2] G. Broden, G. Pirug, H.P. Bonzel, Chemical Physical Letters., 1977, 51.
[3] M. D., Laurie, V. W., Kuczkowski, R. L., Schwendeman, R. H., Ramsay, D. A., Lovas, F. J., Lafferty, W. J., Maki, A. G., Molecular structure of gas-phase polyatomic molecules determined by spectroscopic methods, J. Phys. Chem. Ref. Data 8, 619, 1979.
[4] Structure of Free Molecules in the Gas Phase, Handbook of Chemistry and Physics., 2010-2011, 91.
[5] H.F. Bettinger, T. Kar, E. Sanchez-Garcfa, Borazine and Benzene Homo- and Heterodimers., J. Phys. Chem, 2009, 113, 3353.
[6] P. Atkins, T. Overton, J. Rourke, M. Weller, F. Armstrong, Shriver and Atkins Inorganic Chemistry., 4th edition, 2006, pp. 50-51.

