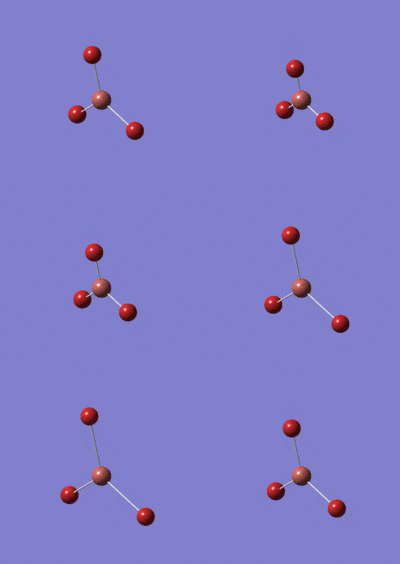
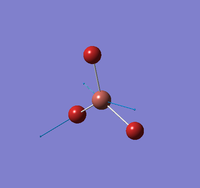
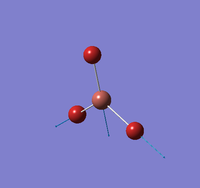
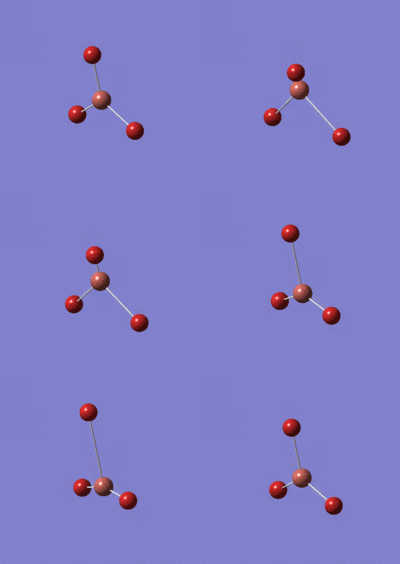
Rep:Mod:jacz1
Week 1 - Optimisation and electronic analysis of BH3 and other simple molecules
Leung, Jackie Tsun Kei (00636554) Year 3 Computational Lab, Module 2
Basic optimisations
This section consists of exercises in Day 1 and 2, including basic optimisations of BH3, TlBr3 and BBr3 using various methods of calculations. The summary of setup, results and discussions are described in detail below.
Optimisation of BH3 using B3LYP/3-21G basis set
The log file of this optimisation is available here.
The optimisation using B3LYP/3-21G is very basic and quick to calculate, however the accuracy is relatively low. This is improved by a better method in the next sub-section.
BH |
Summary of setup and data
BH3 optimisation
| File Name | JTL10_BH3_OPT_321G |
|---|---|
| File Type | .log |
| Calculation Type | FOPT |
| Calculation Method | RB3LYP |
| Basis Set | 3-21G |
| Charge | 0 |
| Spin | Singlet |
| E(RB3LYP) | -26.46226338 a.u. |
| RMS Gradient Norm | 0.00020672 a.u. |
| Imaginary Freq | |
| Dipole Moment | 0 Debye |
| Point Group | D3h |
Job cpu time: 0 days 0 hours 0 minutes 13.0 seconds.
keywords: # opt b3lyp/3-21g geom=connectivity
Results
Item Table
Item               Value     Threshold  Converged?
 Maximum Force            0.000413     0.000450     YES
 RMS     Force            0.000271     0.000300     YES
 Maximum Displacement     0.001610     0.001800     YES
 RMS     Displacement     0.001054     0.001200     YES
 Predicted change in Energy=-1.071764D-06
 Optimization completed.
    -- Stationary point found.
                           ----------------------------
                           !   Optimized Parameters   !
                           ! (Angstroms and Degrees)  !
 --------------------------                            --------------------------
 ! Name  Definition              Value          Derivative Info.                !
 --------------------------------------------------------------------------------
 ! R1    R(1,2)                  1.1935         -DE/DX =    0.0004              !
 ! R2    R(1,3)                  1.1935         -DE/DX =    0.0004              !
 ! R3    R(1,4)                  1.1935         -DE/DX =    0.0004              !
 ! A1    A(2,1,3)              120.0            -DE/DX =    0.0                 !
 ! A2    A(2,1,4)              120.0            -DE/DX =    0.0                 !
 ! A3    A(3,1,4)              120.0            -DE/DX =    0.0                 !
 ! D1    D(2,1,4,3)            180.0            -DE/DX =    0.0                 !
 --------------------------------------------------------------------------------
 GradGradGradGradGradGradGradGradGradGradGradGradGradGradGradGradGradGrad
Both the forces and displacements are converged, indicating the optimisation was successful.
Discussions
B-H length: 1.19 Å (to the nearest 0.01 Å)
H-B-H angle : 120.0o (to the nearest 0.1o)
All bond lengths and angles are equal which is as expected, an optimised BH3 molecule has all H atoms in the same chemical environment.
Optimisation of BH3 using B3LYP/6-31G(d,p) basis set
The log file of this optimisation is available here.
The optimisation B3LYP/6-31G(d,p) is of a higher level basis set which is more accurate than the one used in previous section 1.1.1. The time consumed for calculation remained low.
Summary of setup and data
BH3 optimisation
| File Name | JTL10_BH3_OPT_631G_DP |
|---|---|
| File Type | .log |
| Calculation Type | FOPT |
| Calculation Method | RB3LYP |
| Basis Set | 6-31G(d,p) |
| Charge | 0 |
| Spin | Singlet |
| E(RB3LYP) | -26.61532363 a.u. |
| RMS Gradient Norm | 0.00000235 a.u. |
| Imaginary Freq | |
| Dipole Moment | 0 Debye |
| Point Group | D3h |
Job cpu time: 0 days 0 hours 0 minutes 8.0 seconds.
Keywords: # opt b3lyp/6-31g(d,p) geom=connectivity
Results
Item Table
 Item               Value     Threshold  Converged?
 Maximum Force            0.000005     0.000450     YES
 RMS     Force            0.000003     0.000300     YES
 Maximum Displacement     0.000019     0.001800     YES
 RMS     Displacement     0.000012     0.001200     YES
 Predicted change in Energy=-1.304899D-10
 Optimization completed.
    -- Stationary point found.
                           ----------------------------
                           !   Optimized Parameters   !
                           ! (Angstroms and Degrees)  !
 --------------------------                            --------------------------
 ! Name  Definition              Value          Derivative Info.                !
 --------------------------------------------------------------------------------
 ! R1    R(1,2)                  1.1923         -DE/DX =    0.0                 !
 ! R2    R(1,3)                  1.1923         -DE/DX =    0.0                 !
 ! R3    R(1,4)                  1.1923         -DE/DX =    0.0                 !
 ! A1    A(2,1,3)              120.0            -DE/DX =    0.0                 !
 ! A2    A(2,1,4)              120.0            -DE/DX =    0.0                 !
 ! A3    A(3,1,4)              120.0            -DE/DX =    0.0                 !
 ! D1    D(2,1,4,3)            180.0            -DE/DX =    0.0                 !
 --------------------------------------------------------------------------------
 GradGradGradGradGradGradGradGradGradGradGradGradGradGradGradGradGradGrad
Both the forces and displacements are converged, indicating the optimisation was successful.
Discussions
B-H length: 1.19 Å (to the nearest 0.01 Å)
H-B-H angle: 120.0o (to the nearest 0.1o)
Total energy for 3-21G optimised structure: -26.46226338 a.u.
total energy for 6-31G(d,p) optimised structure: -26.61532363 a.u.
Difference in energy: 0.15306035 a.u. = kJmol-1
All bond lengths and angles are equal similar to the previous results which is expected. From the item tables a difference in bond length can be observed which is directly related to the difference in total energy reported above. This can only suggest the methods provide different degrees of accuracy as the energies are incomparable.
Optimisation of TlBr3 using B3LYP/LANL2DZ basis set
The log of file of this optimisation is available here, or in the chemical database D-space: DOI:10042/21615
TlBr3 is a larger molecule than BH3 consists of more electrons, therefore the calculation was carried out on HPC using a medium basis set B3LYP/LANL2DZ that is appropriate for heavier elements.
TlBr |
Summary of setup and data
TlBr3 optimisation
| File Name | JTL10_TLBR3_OPT_LANL2DZ |
|---|---|
| File Type | .log |
| Calculation Type | FOPT |
| Calculation Method | RB3LYP |
| Basis Set | LANL2DZ |
| Charge | 0 |
| Spin | Singlet |
| E(RB3LYP) | -91.21750131 a.u. |
| RMS Gradient Norm | 0.00275003 a.u. |
| Imaginary Freq | |
| Dipole Moment | 0 Debye |
| Point Group | D3h |
Job cpu time: 0 days 0 hours 0 minutes 37.5 seconds.
keywords: # opt b3lyp/lanl2dz geom=connectivity
Results
Item Table
Item               Value     Threshold  Converged?
 Maximum Force            0.000002     0.000450     YES
 RMS     Force            0.000001     0.000300     YES
 Maximum Displacement     0.000022     0.001800     YES
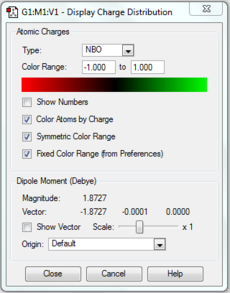
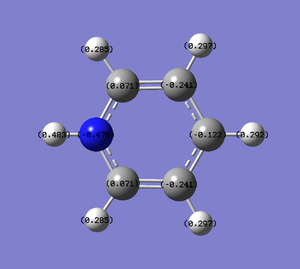
 RMS     Displacement     0.000014     0.001200     YES
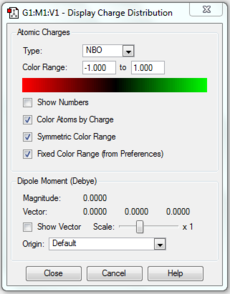
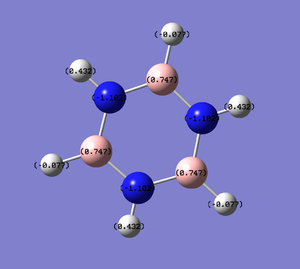
 Predicted change in Energy=-6.084012D-11
 Optimization completed.
    -- Stationary point found.
                           ----------------------------
                           !   Optimized Parameters   !
                           ! (Angstroms and Degrees)  !
 --------------------------                            --------------------------
 ! Name  Definition              Value          Derivative Info.                !
 --------------------------------------------------------------------------------
 ! R1    R(1,2)                  2.651          -DE/DX =    0.0                 !
 ! R2    R(1,3)                  2.651          -DE/DX =    0.0                 !
 ! R3    R(1,4)                  2.651          -DE/DX =    0.0                 !
 ! A1    A(2,1,3)              120.0            -DE/DX =    0.0                 !
 ! A2    A(2,1,4)              120.0            -DE/DX =    0.0                 !
 ! A3    A(3,1,4)              120.0            -DE/DX =    0.0                 !
 ! D1    D(2,1,4,3)            180.0            -DE/DX =    0.0                 !
 --------------------------------------------------------------------------------
 GradGradGradGradGradGradGradGradGradGradGradGradGradGradGradGradGradGrad
Both the forces and displacements are converged, indicating the optimisation was successful.
Discussions
Tl-Br length: 2.65 Å (to the nearest 0.01 Å)
Br-Tl-Br angle: 120.0o (to the nearest 0.1o)
Literature Tl-Br length: 2.51 Å [1]
All bond lengths and angles are equal, suggesting TlBr3 also adapts a similar structure like BH3. The computed value agrees fairly closely to the reported literature value at a reasonable degree of similarity, suggesting the gaussian computation has calculated accurately.
Optimisation of BBr3 using B3LYP/GEN basis set
The log of file of this optimisation is available here, or in the chemical database D-space: DOI:10042/21681 .
BBr3 contains both heavy and light atoms, to treat the calculation more accurately with a full basis set, a mixed pseudo-potentials and basis sets with B3LYP/GEN is used.
BBr |
Summary of setup and data
BBr3 optimisation
| File Name | JTL10_BBR3_OPT_GEN |
|---|---|
| File Type | .log |
| Calculation Type | FOPT |
| Calculation Method | RB3LYP |
| Basis Set | Gen |
| Charge | 0 |
| Spin | Singlet |
| E(RB3LYP) | -64.43645296 a.u. |
| RMS Gradient Norm | 0.00000382 a.u. |
| Imaginary Freq | |
| Dipole Moment | 0 Debye |
| Point Group | D3h |
Job cpu time: 0 days 0 hours 0 minutes 36.2 seconds.
keywords:# opt b3lyp/gen geom=connectivity pseudo=read gfinput
pseudo=read gfinput was added manually to allow optimisation using different basis set on different atoms.
Results
Item Table
Item               Value     Threshold  Converged?
 Maximum Force            0.000008     0.000450     YES
 RMS     Force            0.000005     0.000300     YES
 Maximum Displacement     0.000036     0.001800     YES
 RMS     Displacement     0.000023     0.001200     YES
 Predicted change in Energy=-4.027554D-10
 Optimization completed.
    -- Stationary point found.
                           ----------------------------
                           !   Optimized Parameters   !
                           ! (Angstroms and Degrees)  !
 --------------------------                            --------------------------
 ! Name  Definition              Value          Derivative Info.                !
 --------------------------------------------------------------------------------
 ! R1    R(1,2)                  1.934          -DE/DX =    0.0                 !
 ! R2    R(1,3)                  1.934          -DE/DX =    0.0                 !
 ! R3    R(1,4)                  1.934          -DE/DX =    0.0                 !
 ! A1    A(2,1,3)              120.0            -DE/DX =    0.0                 !
 ! A2    A(2,1,4)              120.0            -DE/DX =    0.0                 !
 ! A3    A(3,1,4)              120.0            -DE/DX =    0.0                 !
 ! D1    D(2,1,4,3)            180.0            -DE/DX =    0.0                 !
 --------------------------------------------------------------------------------
 GradGradGradGradGradGradGradGradGradGradGradGradGradGradGradGradGradGrad
Both the forces and displacements are converged, indicating the optimisation was successful.
Discussions
B-Br length: 1.93 Å (to the nearest 0.01 Å)
Br-B-Br angle: 120.0o (to the nearest 0.1o)
All bond lengths and angles are equal, suggesting BBr3 also adapts a similar structure like BH3.
Structure comparisons
| Bond length / Å
(to the nearest 0.01 Å) |
Bond angle / o
(to the nearest 0.1o) | |
|---|---|---|
| BH3 | 1.19 | 120.0 |
| BBr3 | 1.93 | 120.0 |
| TlBr3 | 2.65 | 120.0 |
- The bond angles are 120.0o which is the same for all three structures, indicating that they all adopt the same trigonal planar structure. This can also be predicted from the valence bond theory of the central atom, since boron and thallium are both in group 13, it is expected to form 3 valence bonds with 3 X-type ligands such as hydrides and bromides. BH3, BBr3 and TlBr3 all fall into this category hence adopt the same structure although central atoms and ligands are different.
- The bond lengths however show an obvious trend. Firstly, rB-H < rB-Br, this is due to the bromide ligand being much more larger in terms of atomic size and consist of more electrons than the hydride ligand. Down the table,
- rB-Br < rTl-Br is also observed. This shows that a larger central atom with more electrons also causes the bond length to be longer, in this case thallium replacing boron.
Bonding in Gaussview software
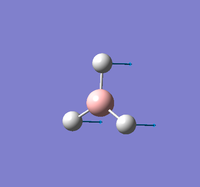
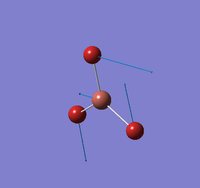
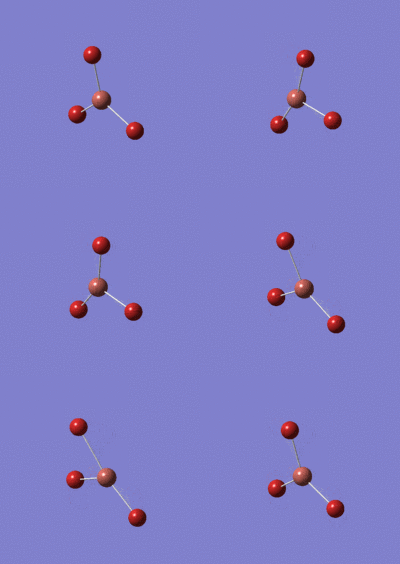
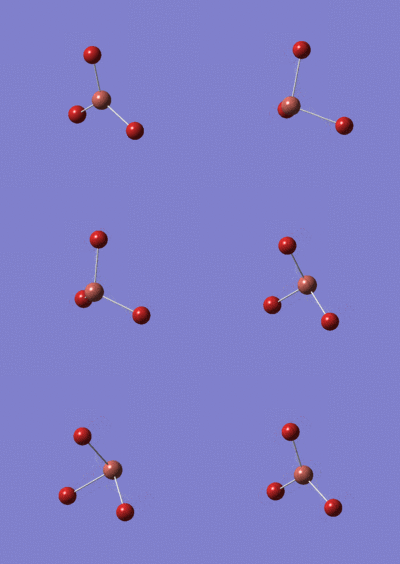
- The gaussview software can display the intermediates of optimisation of a molecule. In the case of BH3 optimisation using B3LYP/3-21G, the first two steps did not display any bonds between boron and the hydrides.
- A bond between atoms essentially represents their attractive interaction towards each other. Two simple categories are ionic and covalent but there can be combined effects of both. Bond strength defines the combination of repulsion of nuclei, repulsion of electrons and attraction of charges due to difference in electronegativities, and directly affects the bond length.
- Therefore, at the point where the interaction is too weak, a bond will not be shown in Gaussview. Note that it is just not significant to be considered as a bond, not that there are no interactions between them.
Frequency analysis, Population analysis and Association energy
This section consists of exercises in Day 3 and 4, including frequency analysis, population analysis and association energy of various simple molecules.
BH3 frequency analysis
The log file of this frequency analysis is available here.
The frequency analysis provides the details of vibrational modes and an infrared spectrum can be obtained. It must be carried out using an optimised BH3 molecule with RB3LYP/6-31G(d,p) from the previous section 1.1.2.
Summary of setup and data
BH3 frequency
| File Name | JTL10_BH3_FREQ |
|---|---|
| File Type | .log |
| Calculation Type | FREQ |
| Calculation Method | RB3LYP |
| Basis Set | 6-31G(d,p) |
| Charge | 0 |
| Spin | Singlet |
| E(RB3LYP) | -26.61532363 a.u. |
| RMS Gradient Norm | 0.00000237 a.u. |
| Imaginary Freq | |
| Dipole Moment | 0 Debye |
| Point Group | D3h |
Job cpu time: 0 days 0 hours 0 minutes 26.0 seconds.
keywords: # freq b3lyp/6-31g(d,p) geom=connectivity
The total energy remains the same, indicating there is no change in structure.
Results
Low frequency table
Low frequencies ---   -0.9033   -0.7343   0.0054   6.7375   12.2491   12.2824

Low frequencies --- 1163.0003 1213.1853 1213.1880
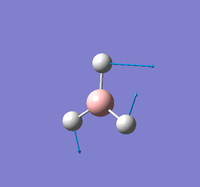
The 'zero' frequencies are within a small order of magnitude compare to the actual frequencies observed. The real frequencies are all positive. This suggests the frequency analysis was successful.
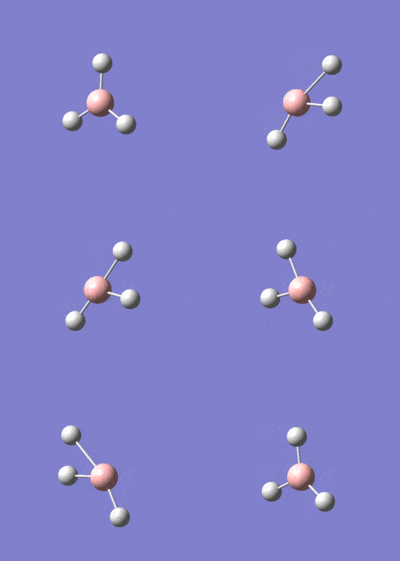
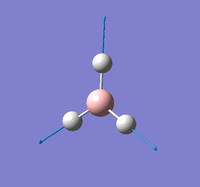
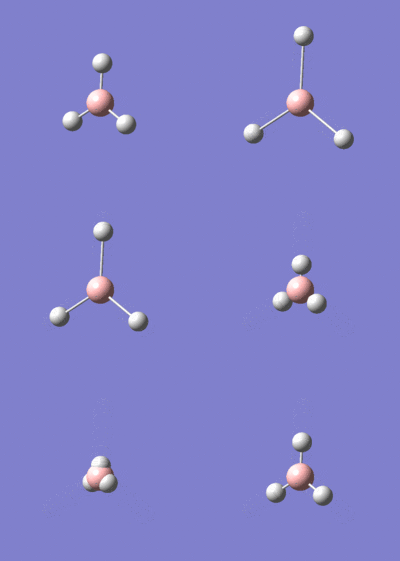
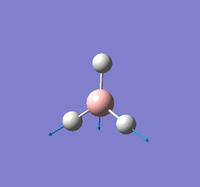
Summary of frequency vibrational modes of BH3
(All data rounded to nearest whole integer by convention)
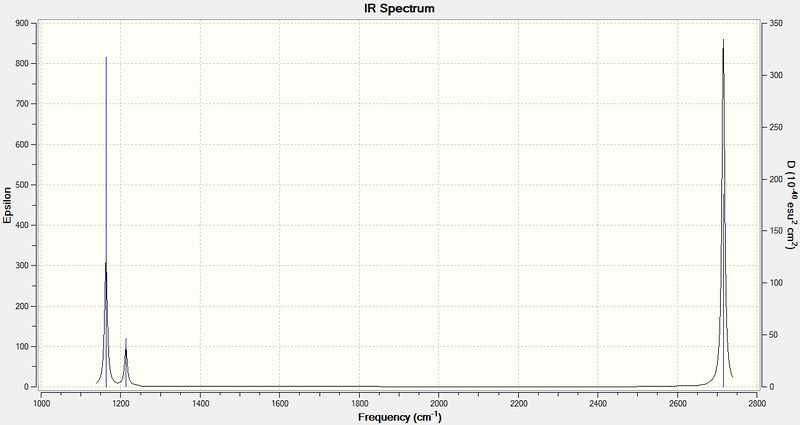
Infrared spectrum of BH3
Discussions
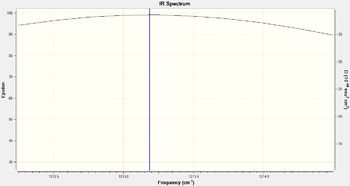
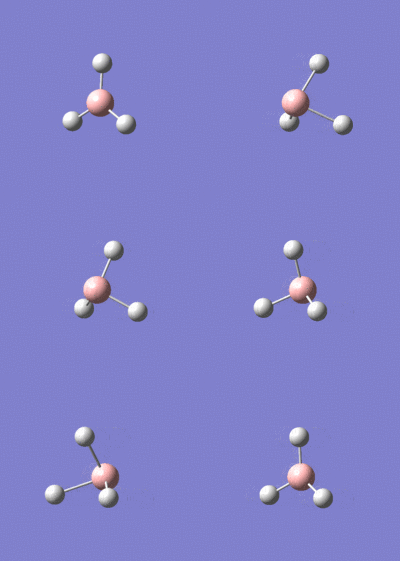
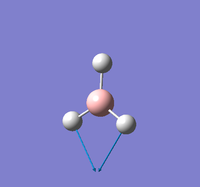
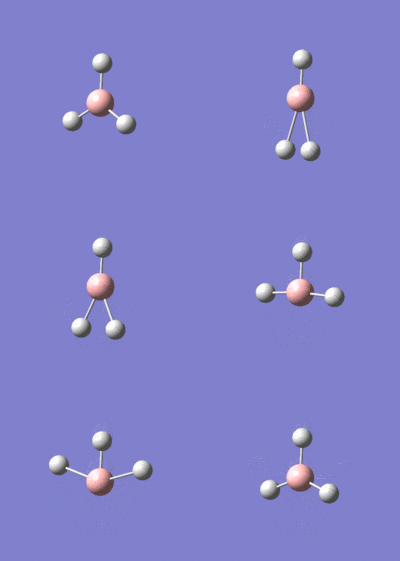
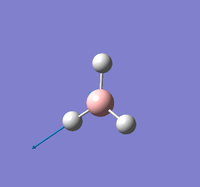
From the spectrum above, only three apparent peaks are observed, whilst the vibrational modes table show six. This is because there are overlapping area between vibrations that have very similar frequency, i.e. vibrational modes 2 and 3 as well as 5 and 6, of which they have close peaks at 1213 and 2715 cm-1 respectively for each pair. If the spectrum is zoomed into a very small scale (example shown on the right), two lines can be observed, indicating there are indeed two separate vibrations.
Vibration mode 4 at 2582 cm-1 has a zero intensity, although it is vibrationally allowed, it is not physically observable in the spectrum. Therefore overall there are 5 peaks with 2 pairs overlapped to give 3 obvious ones.
TlBr3 frequency analysis
The log file of this frequency analysis is available here or in the chemical database D-space: DOI:10042/21665 .
This frequency analysis is carried out on HPC using an optimised TlBr3 molecule with RB3LYP/LANL2DZ from the previous section 1.1.3.
Summary of setup and data
TlBr3 frequency
| File Name | JTL10_TLBR3_FREQ |
|---|---|
| File Type | .log |
| Calculation Type | FREQ |
| Calculation Method | RB3LYP |
| Basis Set | LANL2DZ |
| Charge | 0 |
| Spin | Singlet |
| E(RB3LYP) | -91.21812851 a.u. |
| RMS Gradient Norm | 0.00000088 a.u. |
| Imaginary Freq | |
| Dipole Moment | 0 Debye |
| Point Group | D3h |
Job cpu time: 0 days 0 hours 0 minutes 34.2 seconds.
keywords: # freq b3lyp/lanl2dz geom=connectivity
The total energy remains the same, indicating there is no change in structure.
Results
Low frequency table
Low frequencies ---   -3.4213   -0.0026   -0.0004    0.0015    3.9367    3.9367
 Low frequencies ---   46.4289   46.4292   52.1449
The 'zero' frequencies are within a small order of magnitude compare to the actual frequencies observed. The real frequencies are all positive. This suggests the frequency analysis was successful.
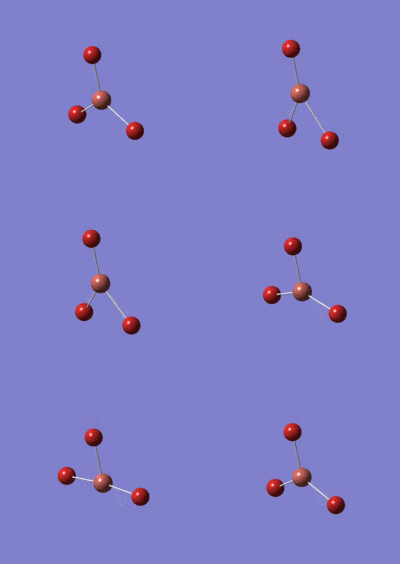
Summary of frequency vibrational modes of TlBr3
(All data rounded to nearest whole integer by convention)
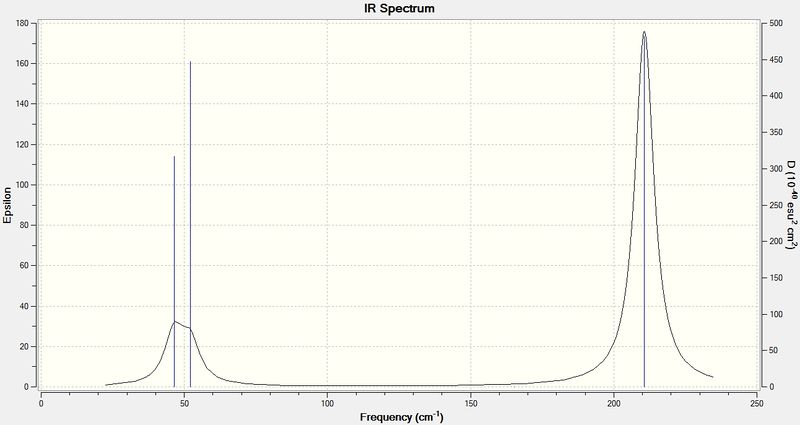
Infrared spectrum
Discussions
Summary frequencies Table of BH3 and TlBr3
| BH3/cm-1 | TlBr3/cm-1 | |
|---|---|---|
| Mode 1 | 1163 (a2") | 46 (e') |
| Mode 2 | 1213 (e') | 46 (e') |
| Mode 3 | 1213 (e') | 52 (a2") |
| Mode 4 | 2582 (a1') | 165 (a1') |
| Mode 5 | 2715 (e') | 211 (e') |
| Mode 6 | 2715 (e') | 211 (e') |
Frequency and spectral comparison between BH3 and TlBr3
- Both molecules show similar vibrational modes since they have the same trigonal planar structure. However the frequencies of the corresponding vibration modes show a large difference, this is due to the atomic masses of the molecules analysed. BH3 is a much lighter molecule than TlBr3, the B-H bonds are able to vibrate more easily and frequently than Tl-Br bonds, hence higher frequencies are observed for BH3 in contrast to TlBr3. As frequency is directly proportional to energy, this also suggests that BH3 has a higher vibrational energy.
- Both spectra show similar patterns of peaks, with two small (overlapped) peaks close to each other at low frequency and large (overlapped) peaks at relatively higher frequency. They can be distinguished from their vibrational modes, a2" and e' modes (1-3) are at lower frequency where a1' and e' modes (4-6) are at higher. This is because modes 4-6 are all stretching frequencies and modes 1-3 are bending frequencies. Generally stretching and compressing a bond require more energy than bending a bond.
- The lowest real normal modes of BH3 and TlBr3 are a2" and e' respectively. From this, reordering of modes is observed, as the frequencies are dependent on the masses of the atoms, there can be effect on the ability of certain vibration modes. From the results, it is suggesting that scissoring and rocking vibrational modes are less able to perform as frequently than wagging motion in a heavier molecule of TlBr3; and vice-versa for the lighter BH3.
Gerneral discussions on frequency analysis
- It is essential to use the same basis set as the optimisation of the molecule when carrying out frequency analysis, as the calculations and level of accuracy must be the same, otherwise large errors can be introduced. A small difference in calculated energies can produce a wide range of error of a magnitude of 102 kJ mol-1, which is significant in terms of bonding or vibrational energies.
- The frequency analysis process determines whether an optimisation is successful. The calculation involves finding the second derivative of the potential energy surface; a positive frequency gives a minimum which is the ground state and a negative frequency gives a maximum which is the transition state. For an optimisation to be successful, there cannot be more than one negative values as this means it has failed to find a critical point. The low frequencies are basically the first derivatives of the energy, which must be close to zero as much as possible, in order to show that a minimum (or maximum) optimised structure has been obtained.
Population analysis of BH3
The log file of this population analysis is available hereor chk file in chemical database D-space: DOI:10042/21663 .
The population analysis can compute the molecular orbitals of BH3, in order to generate accurate results, the optimised BH3 by B3LYP/6-31G(d,p) is used with NBO calculation on HPC. The computed MOs are retrieved from checkpoint file downloaded on HPC.
Summary of setup and data
BH3 population
| File Name | JTL10_BH3_NBO_631G_DP |
|---|---|
| File Type | .log |
| Calculation Type | SP |
| Calculation Method | RB3LYP |
| Basis Set | 6-31G(D,P) |
| Charge | 0 |
| Spin | Singlet |
| E(RB3LYP) | -26.61532363 a.u. |
| RMS Gradient Norm | |
| Imaginary Freq | |
| Dipole Moment | 0 Debye |
| Point Group | D3h |
Job cpu time: 0 days 0 hours 0 minutes 13.2 seconds.
keywords: # b3lyp/6-31g(d,p) pop=(nbo,full) geom=connectivity
pop=full was added manually to carry out full NBO analysis.
Results
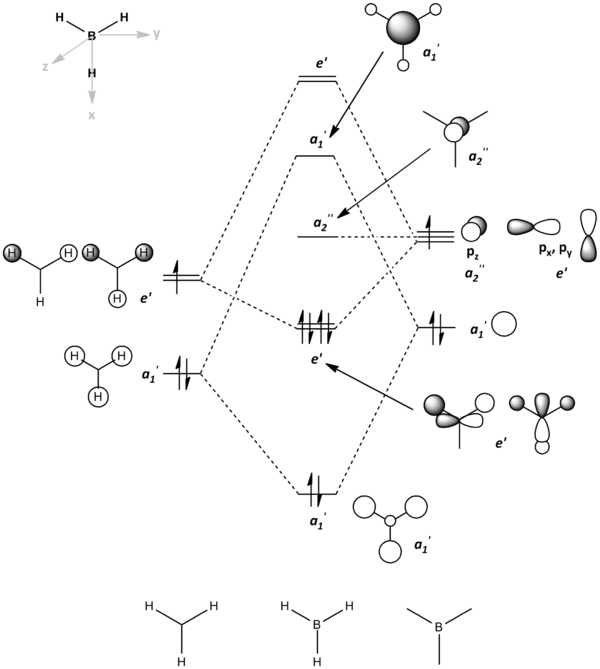
Theoretical MO diagram of BH3
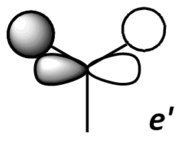
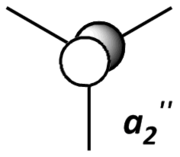
Using linear combination of atomic orbitals of B and H3, a predicted molecular orbital diagram of BH3 can be concluded below.
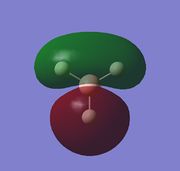
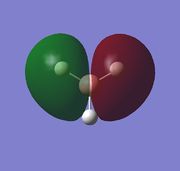
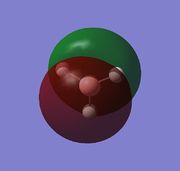
Comparison of theoretical (LCAO) and actual computed MOs
| Theoretical MO (LCAO) | 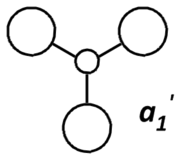
|

|
|
|
|---|---|---|---|---|
| Actual computed MO | 
|
|
|
|
Discussions
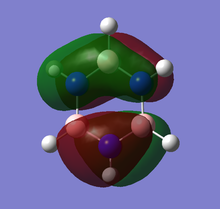
The theoretical and computed MOs illustrated in the above table have shown a very good similarity, this suggests that the qualitative approach of linear combination of atomic orbitals theory has an appropriate accuracy and significance to the actual ones.
(Molecular orbitals that are core or above LUMO are not shown)
Optimisation of NH3 using B3LYP/6-31G(d,p) basis set
The log file of this optimisation is available here.
NH |
Summary of setup and data
NH3 optimisation
| File Name | JTL10_NH3_OPT_631G_DP |
|---|---|
| File Type | .log |
| Calculation Type | FOPT |
| Calculation Method | RB3LYP |
| Basis Set | 6-31G(d,p) |
| Charge | 0 |
| Spin | Singlet |
| E(RB3LYP) | -56.55776856 a.u. |
| RMS Gradient Norm | 0.00000887 a.u. |
| Imaginary Freq | |
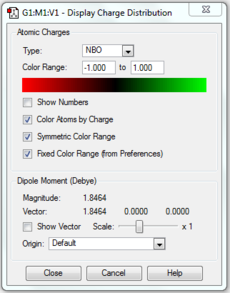
| Dipole Moment | 1.8464 Debye |
| Point Group | C1 |
Job cpu time: 0 days 0 hours 0 minutes 4.0 seconds.
keywords: # opt b3lyp/6-31g(d,p) nosymm geom=connectivity
'no symm' is added manually therefore no symmetry is given and point group is C1.
Calculations can be speeded up if no symmetry is present.
Results
Item table
 Item               Value     Threshold  Converged?
 Maximum Force            0.000024     0.000450     YES
 RMS     Force            0.000012     0.000300     YES
 Maximum Displacement     0.000088     0.001800     YES
 RMS     Displacement     0.000056     0.001200     YES
 Predicted change in Energy=-1.758799D-09
 Optimization completed.
    -- Stationary point found.
                           ----------------------------
                           !   Optimized Parameters   !
                           ! (Angstroms and Degrees)  !
 --------------------------                            --------------------------
 ! Name  Definition              Value          Derivative Info.                !
 --------------------------------------------------------------------------------
 ! R1    R(1,2)                  1.018          -DE/DX =    0.0                 !
 ! R2    R(1,3)                  1.018          -DE/DX =    0.0                 !
 ! R3    R(1,4)                  1.018          -DE/DX =    0.0                 !
 ! A1    A(2,1,3)              105.7414         -DE/DX =    0.0                 !
 ! A2    A(2,1,4)              105.7486         -DE/DX =    0.0                 !
 ! A3    A(3,1,4)              105.7478         -DE/DX =    0.0                 !
 ! D1    D(2,1,4,3)           -111.8631         -DE/DX =    0.0                 !
 --------------------------------------------------------------------------------
 GradGradGradGradGradGradGradGradGradGradGradGradGradGradGradGradGradGrad
Both the forces and displacements are converged, indicating the optimisation was successful.
Frequency analysis of NH3
The log file of this frequency analysis is available here.
Summary of setup and data
NH3 frequency
| File Name | JTL10_NH3_FREQ |
|---|---|
| File Type | .log |
| Calculation Type | FREQ |
| Calculation Method | RB3LYP |
| Basis Set | 6-31G(d,p) |
| Charge | 0 |
| Spin | Singlet |
| E(RB3LYP) | -56.55776856 a.u. |
| RMS Gradient Norm | 0.00000887 a.u. |
| Imaginary Freq | |
| Dipole Moment | 1.8464 Debye |
| Point Group | C1 |
Job cpu time: 0 days 0 hours 0 minutes 9.0 seconds.
keywords: # freq b3lyp/6-31g(d,p) nosymm geom=connectivity
The total energy remains the same, indicating there is no change in structure.
Results
Low frequency table
Low frequencies ---  -30.7013   -0.0018   -0.0016   -0.0008   20.2662   28.2997
 Low frequencies --- 1089.5562 1694.1246 1694.1863
The 'zero' frequencies are within a small order of magnitude compare to the actual frequencies observed. The real frequencies are all positive. This suggests the frequency analysis was successful.
Population and NBO analysis of NH3
The log file of this population analysis is available here or in the chemical database D-space:DOI:10042/21667 .
Summary of setup and data
NH3 population
| File Name | JTL10_NH3_NBO_631G_DP |
|---|---|
| File Type | .log |
| Calculation Type | SP |
| Calculation Method | RB3LYP |
| Basis Set | 6-31G(d,p) |
| Charge | 0 |
| Spin | Singlet |
| E(RB3LYP) | -56.55776856 a.u. |
| RMS Gradient Norm | |
| Imaginary Freq | |
| Dipole Moment | 1.8464 Debye |
| Point Group | C1 |
Job cpu time: 0 days 0 hours 0 minutes 31.5 seconds.
keywords: # b3lyp/6-31g(d,p) nosymm pop=(nbo,full) geom=connectivity
pop=full was added manually to carry out full NBO analysis.
Results
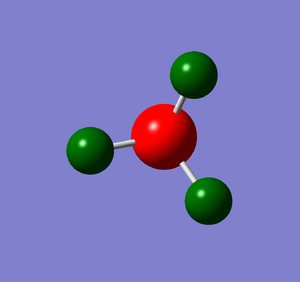
| Charge distribution by colour | Charge colour range | Charge distribution by numbers |
|---|---|---|
|
|

|
Discussions
Optimisation of NH3BH3 using B3LYP/6-31G(d,p) basis set
The log file of this optimisation is available here
NHBH |
Summary of setup and data
NH3BH3 optimisation
| File Name | JTL10_NH3BH3_OPT_631G_DP |
|---|---|
| File Type | .log |
| Calculation Type | FOPT |
| Calculation Method | RB3LYP |
| Basis Set | 6-31G(d,p) |
| Charge | 0 |
| Spin | Singlet |
| E(RB3LYP) | -83.22468918 a.u. |
| RMS Gradient Norm | 0.00006806 a.u. |
| Imaginary Freq | |
| Dipole Moment | 5.5654 Debye |
| Point Group | C1 |
Job cpu time: 0 days 0 hours 1 minutes 28.0 seconds.
keywords:# opt b3lyp/6-31g(d,p) geom=connectivity
Results
Item Table
Item               Value     Threshold  Converged?
 Maximum Force            0.000137     0.000450     YES
 RMS     Force            0.000063     0.000300     YES
 Maximum Displacement     0.000606     0.001800     YES
 RMS     Displacement     0.000336     0.001200     YES
 Predicted change in Energy=-1.993999D-07
 Optimization completed.
    -- Stationary point found.
                           ----------------------------
                           !   Optimized Parameters   !
                           ! (Angstroms and Degrees)  !
 --------------------------                            --------------------------
 ! Name  Definition              Value          Derivative Info.                !
 --------------------------------------------------------------------------------
 ! R1    R(1,7)                  1.0186         -DE/DX =   -0.0001              !
 ! R2    R(2,7)                  1.0186         -DE/DX =   -0.0001              !
 ! R3    R(3,7)                  1.0186         -DE/DX =   -0.0001              !
 ! R4    R(4,8)                  1.2101         -DE/DX =   -0.0001              !
 ! R5    R(5,8)                  1.2101         -DE/DX =   -0.0001              !
 ! R6    R(6,8)                  1.2101         -DE/DX =   -0.0001              !
 ! R7    R(7,8)                  1.668          -DE/DX =   -0.0001              !
 ! A1    A(1,7,2)              107.87           -DE/DX =    0.0                 !
 ! A2    A(1,7,3)              107.8652         -DE/DX =    0.0                 !
 ! A3    A(1,7,8)              111.0329         -DE/DX =    0.0                 !
 ! A4    A(2,7,3)              107.8697         -DE/DX =    0.0                 !
 ! A5    A(2,7,8)              111.0286         -DE/DX =    0.0                 !
 ! A6    A(3,7,8)              111.0291         -DE/DX =    0.0                 !
 ! A7    A(4,8,5)              113.8693         -DE/DX =    0.0                 !
 ! A8    A(4,8,6)              113.8721         -DE/DX =    0.0                 !
 ! A9    A(4,8,7)              104.6003         -DE/DX =    0.0                 !
 ! A10   A(5,8,6)              113.8747         -DE/DX =    0.0                 !
 ! A11   A(5,8,7)              104.6003         -DE/DX =    0.0                 !
 ! A12   A(6,8,7)              104.5984         -DE/DX =    0.0                 !
 ! D1    D(1,7,8,4)           -179.9867         -DE/DX =    0.0                 !
 ! D2    D(1,7,8,5)            -59.9892         -DE/DX =    0.0                 !
 ! D3    D(1,7,8,6)             60.0135         -DE/DX =    0.0                 !
 ! D4    D(2,7,8,4)            -59.9839         -DE/DX =    0.0                 !
 ! D5    D(2,7,8,5)             60.0136         -DE/DX =    0.0                 !
 ! D6    D(2,7,8,6)           -179.9837         -DE/DX =    0.0                 !
 ! D7    D(3,7,8,4)             60.0161         -DE/DX =    0.0                 !
 ! D8    D(3,7,8,5)           -179.9864         -DE/DX =    0.0                 !
 ! D9    D(3,7,8,6)            -59.9837         -DE/DX =    0.0                 !
 --------------------------------------------------------------------------------
 GradGradGradGradGradGradGradGradGradGradGradGradGradGradGradGradGradGrad
Both the forces and displacements are converged, indicating the optimisation was successful.
Frequency analysis of NH3BH3
The log file of this frequency analysis is available here.
Summary of setup and data
NH3BH3 frequency
| File Name | JTL10_NH3BH3_FREQ |
|---|---|
| File Type | .log |
| Calculation Type | FREQ |
| Calculation Method | RB3LYP |
| Basis Set | 6-31G(d,p) |
| Charge | 0 |
| Spin | Singlet |
| E(RB3LYP) | -83.22468918 a.u. |
| RMS Gradient Norm | 0.00006805 a.u. |
| Imaginary Freq | |
| Dipole Moment | 5.5654 Debye |
| Point Group | C1 |
Job cpu time: 0 days 0 hours 0 minutes 59.0 seconds.
keywords: # freq b3lyp/6-31g(d,p) geom=connectivity
The total energy remains the same, indicating there is no change in structure.
Results
Low frequency table
Low frequencies ---   -0.0010    0.0002    0.0012   17.1579   22.5687   38.9093
 Low frequencies ---  265.8799  632.3786  639.0712
The 'zero' frequencies are within a small order of magnitude compare to the actual frequencies observed. The real frequencies are all positive. This suggests the frequency analysis was successful.
Association energy of NH3BH3
E(NH3)= -56.55776856 a.u.
E(BH3)= -26.61532363 a.u.
E(NH3BH3)= -83.22468918 a.u.
Association/dissociation energy:
ΔE = E(NH3BH3) − [E(NH3) + E(BH3)] = -0.05159699 a.u. = -135.47 = -135 kJ mol-1
The final value of association energy is of a reasonable degree of magnitude.
Week 2 - Mini project - Optimisation and MO analysis of aromatic molecules
This section contains the studies of four simple aromatic molecules: benzene, boratabenzene, pyridinium and borazine. Optimisation, frequency analyses and population analyses are all carried out on HPC. The molecular orbitals and other properties are discussed according to the effects of their structure.
Optimisation of Benzene using B3LYP/6-31G(d,p) basis set
The log file of this optimisation is available here or in the chemical database: DOI:10042/21947
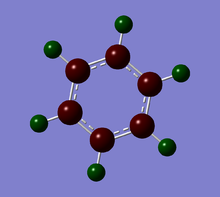
Benzene |
Summary of setup and data
Benzene optimisation
| File Name | JTL10_BENZENE_OPT_631G_DP |
|---|---|
| File Type | .log |
| Calculation Type | FOPT |
| Calculation Method | RB3LYP |
| Basis Set | 6-31G(d,p) |
| Charge | 0 |
| Spin | Singlet |
| E(RB3LYP) | -232.25820551 a.u. |
| RMS Gradient Norm | 0.00009549 a.u. |
| Imaginary Freq | |
| Dipole Moment | 0.0001 Debye |
| Point Group | C1 |
Job cpu time: 0 days 0 hours 2 minutes 3.3 seconds.
keywords: # opt b3lyp/6-31g(d,p) geom=connectivity
Results
Item Table
Item               Value     Threshold  Converged?
 Maximum Force            0.000212     0.000450     YES
 RMS     Force            0.000085     0.000300     YES
 Maximum Displacement     0.000991     0.001800     YES
 RMS     Displacement     0.000315     0.001200     YES
 Predicted change in Energy=-5.157454D-07
 Optimization completed.
    -- Stationary point found.
                           ----------------------------
                           !   Optimized Parameters   !
                           ! (Angstroms and Degrees)  !
 --------------------------                            --------------------------
 ! Name  Definition              Value          Derivative Info.                !
 --------------------------------------------------------------------------------
 ! R1    R(1,2)                  1.3963         -DE/DX =    0.0001              !
 ! R2    R(1,6)                  1.3961         -DE/DX =    0.0002              !
 ! R3    R(1,7)                  1.0861         -DE/DX =    0.0002              !
 ! R4    R(2,3)                  1.3961         -DE/DX =    0.0002              !
 ! R5    R(2,8)                  1.0861         -DE/DX =    0.0002              !
 ! R6    R(3,4)                  1.3963         -DE/DX =    0.0001              !
 ! R7    R(3,9)                  1.086          -DE/DX =    0.0002              !
 ! R8    R(4,5)                  1.3961         -DE/DX =    0.0002              !
 ! R9    R(4,10)                 1.086          -DE/DX =    0.0002              !
 ! R10   R(5,6)                  1.3963         -DE/DX =    0.0001              !
 ! R11   R(5,11)                 1.0861         -DE/DX =    0.0002              !
 ! R12   R(6,12)                 1.0861         -DE/DX =    0.0002              !
 ! A1    A(2,1,6)              119.9972         -DE/DX =    0.0                 !
 ! A2    A(2,1,7)              119.9949         -DE/DX =    0.0                 !
 ! A3    A(6,1,7)              120.0079         -DE/DX =    0.0                 !
 ! A4    A(1,2,3)              120.0079         -DE/DX =    0.0                 !
 ! A5    A(1,2,8)              119.9881         -DE/DX =    0.0                 !
 ! A6    A(3,2,8)              120.004          -DE/DX =    0.0                 !
 ! A7    A(2,3,4)              119.9948         -DE/DX =    0.0                 !
 ! A8    A(2,3,9)              120.0086         -DE/DX =    0.0                 !
 ! A9    A(4,3,9)              119.9966         -DE/DX =    0.0                 !
 ! A10   A(3,4,5)              119.9972         -DE/DX =    0.0                 !
 ! A11   A(3,4,10)             119.9934         -DE/DX =    0.0                 !
 ! A12   A(5,4,10)             120.0094         -DE/DX =    0.0                 !
 ! A13   A(4,5,6)              120.0083         -DE/DX =    0.0                 !
 ! A14   A(4,5,11)             120.0014         -DE/DX =    0.0                 !
 ! A15   A(6,5,11)             119.9904         -DE/DX =    0.0                 !
 ! A16   A(1,6,5)              119.9946         -DE/DX =    0.0                 !
 ! A17   A(1,6,12)             120.0106         -DE/DX =    0.0                 !
 ! A18   A(5,6,12)             119.9948         -DE/DX =    0.0                 !
 ! D1    D(6,1,2,3)             -0.0059         -DE/DX =    0.0                 !
 ! D2    D(6,1,2,8)            180.0023         -DE/DX =    0.0                 !
 ! D3    D(7,1,2,3)           -180.01           -DE/DX =    0.0                 !
 ! D4    D(7,1,2,8)             -0.0019         -DE/DX =    0.0                 !
 ! D5    D(2,1,6,5)             -0.0055         -DE/DX =    0.0                 !
 ! D6    D(2,1,6,12)          -179.9972         -DE/DX =    0.0                 !
 ! D7    D(7,1,6,5)           -180.0013         -DE/DX =    0.0                 !
 ! D8    D(7,1,6,12)             0.007          -DE/DX =    0.0                 !
 ! D9    D(1,2,3,4)              0.0117         -DE/DX =    0.0                 !
 ! D10   D(1,2,3,9)           -179.9914         -DE/DX =    0.0                 !
 ! D11   D(8,2,3,4)            180.0036         -DE/DX =    0.0                 !
 ! D12   D(8,2,3,9)              0.0005         -DE/DX =    0.0                 !
 ! D13   D(2,3,4,5)             -0.0062         -DE/DX =    0.0                 !
 ! D14   D(2,3,4,10)          -180.0059         -DE/DX =    0.0                 !
 ! D15   D(9,3,4,5)            179.9969         -DE/DX =    0.0                 !
 ! D16   D(9,3,4,10)            -0.0028         -DE/DX =    0.0                 !
 ! D17   D(3,4,5,6)             -0.0051         -DE/DX =    0.0                 !
 ! D18   D(3,4,5,11)           180.0058         -DE/DX =    0.0                 !
 ! D19   D(10,4,5,6)          -180.0055         -DE/DX =    0.0                 !
 ! D20   D(10,4,5,11)            0.0054         -DE/DX =    0.0                 !
 ! D21   D(4,5,6,1)              0.011          -DE/DX =    0.0                 !
 ! D22   D(4,5,6,12)           180.0027         -DE/DX =    0.0                 !
 ! D23   D(11,5,6,1)          -179.9999         -DE/DX =    0.0                 !
 ! D24   D(11,5,6,12)           -0.0082         -DE/DX =    0.0                 !
 --------------------------------------------------------------------------------
 GradGradGradGradGradGradGradGradGradGradGradGradGradGradGradGradGradGrad
Both the forces and displacements are converged, indicating the optimisation was successful.
Frequency analysis of Benzene
The log file of this frequency analysis is available here or in the chemical database: DOI:10042/21950
Summary of setup and data
Benzene frequency
| File Name | JTL10_BENZENE_FREQ |
|---|---|
| File Type | .log |
| Calculation Type | FREQ |
| Calculation Method | RB3LYP |
| Basis Set | 6-31G(d,p) |
| Charge | 0 |
| Spin | Singlet |
| E(RB3LYP) | -232.25820551 a.u. |
| RMS Gradient Norm | 0.00009549 a.u. |
| Imaginary Freq | |
| Dipole Moment | 0.0001 Debye |
| Point Group | C1 |
Job cpu time: 0 days 0 hours 5 minutes 37.7 seconds.
keywords:# freq b3lyp/6-31g(d,p) geom=connectivity
The total energy remains the same, indicating there is no change in structure.
Results
Low frequency table
Low frequencies ---  -17.2788  -14.5868   -9.6527    0.0004    0.0006    0.0010
 Low frequencies ---  413.7971  414.4697  620.8545
The 'zero' frequencies are within a small order of magnitude compare to the actual frequencies observed. The real frequencies are all positive. This suggests the frequency analysis was successful.
Population and NBO analysis of Benzene
The log file of this population analysis is available here or in the chemical database: DOI:10042/21953
Summary of setup and data
Benzene population
| File Name | JTL10_BENZENE_POP |
|---|---|
| File Type | .log |
| Calculation Type | SP |
| Calculation Method | RB3LYP |
| Basis Set | 6-31G(d,p) |
| Charge | 0 |
| Spin | Singlet |
| E(RB3LYP) | -232.25820551 a.u. |
| RMS Gradient Norm | |
| Imaginary Freq | |
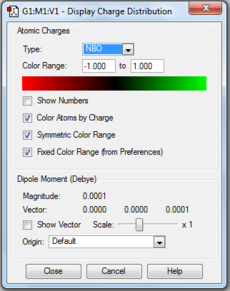
| Dipole Moment | 0.0001 Debye |
| Point Group | C1 |
Job cpu time: 0 days 0 hours 1 minutes 5.2 seconds.
keywords:# rb3lyp/6-31g(d,p) pop=(nbo,full) geom=connectivity
pop=full was added manually to carry out full NBO analysis.
Results
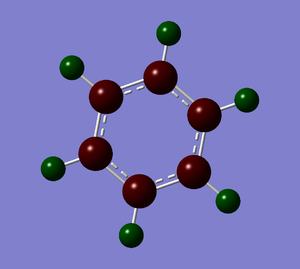
| Charge distribution by colour | Charge colour range | Charge distribution by numbers |
|---|---|---|
|
|
|
Optimisation of Boratabenzene using B3LYP/6-31G(d,p) basis set
The log file of this optimisation is available here or in the chemical database: DOI:10042/21948
Boratabenzene |
Summary of setup and data
Boratabenzene optimisation
| File Name | JTL10_BORATABENZENE_OPT_631G_DP |
|---|---|
| File Type | .log |
| Calculation Type | FOPT |
| Calculation Method | RB3LYP |
| Basis Set | 6-31G(d,p) |
| Charge | -1 |
| Spin | Singlet |
| E(RB3LYP) | -219.02052984 a.u. |
| RMS Gradient Norm | 0.00015840 a.u. |
| Imaginary Freq | |
| Dipole Moment | 2.8465 Debye |
| Point Group | C1 |
Job cpu time: 0 days 0 hours 3 minutes 59.6 seconds.
keywords:# opt b3lyp/6-31g(d,p) geom=connectivity
Results
Item Table
Item               Value     Threshold  Converged?
 Maximum Force            0.000159     0.000450     YES
 RMS     Force            0.000069     0.000300     YES
 Maximum Displacement     0.000878     0.001800     YES
 RMS     Displacement     0.000326     0.001200     YES
 Predicted change in Energy=-6.589451D-07
 Optimization completed.
    -- Stationary point found.
                           ----------------------------
                           !   Optimized Parameters   !
                           ! (Angstroms and Degrees)  !
 --------------------------                            --------------------------
 ! Name  Definition              Value          Derivative Info.                !
 --------------------------------------------------------------------------------
 ! R1    R(1,2)                  1.4053         -DE/DX =   -0.0001              !
 ! R2    R(1,5)                  1.3989         -DE/DX =    0.0                 !
 ! R3    R(1,6)                  1.0968         -DE/DX =    0.0001              !
 ! R4    R(2,3)                  1.4053         -DE/DX =   -0.0001              !
 ! R5    R(2,7)                  1.0916         -DE/DX =   -0.0001              !
 ! R6    R(3,4)                  1.3989         -DE/DX =    0.0                 !
 ! R7    R(3,8)                  1.0968         -DE/DX =    0.0001              !
 ! R8    R(4,9)                  1.097          -DE/DX =   -0.0001              !
 ! R9    R(4,12)                 1.5137         -DE/DX =    0.0001              !
 ! R10   R(5,11)                 1.097          -DE/DX =   -0.0001              !
 ! R11   R(5,12)                 1.5138         -DE/DX =    0.0001              !
 ! R12   R(10,12)                1.2185         -DE/DX =    0.0                 !
 ! A1    A(2,1,5)              122.138          -DE/DX =    0.0001              !
 ! A2    A(2,1,6)              117.4354         -DE/DX =    0.0                 !
 ! A3    A(5,1,6)              120.4266         -DE/DX =   -0.0002              !
 ! A4    A(1,2,3)              120.4508         -DE/DX =   -0.0001              !
 ! A5    A(1,2,7)              119.7734         -DE/DX =    0.0001              !
 ! A6    A(3,2,7)              119.7758         -DE/DX =    0.0001              !
 ! A7    A(2,3,4)              122.1395         -DE/DX =    0.0001              !
 ! A8    A(2,3,8)              117.4371         -DE/DX =    0.0                 !
 ! A9    A(4,3,8)              120.4234         -DE/DX =   -0.0002              !
 ! A10   A(3,4,9)              115.9493         -DE/DX =    0.0001              !
 ! A11   A(3,4,12)             120.0806         -DE/DX =   -0.0001              !
 ! A12   A(9,4,12)             123.9701         -DE/DX =   -0.0001              !
 ! A13   A(1,5,11)             115.9535         -DE/DX =    0.0001              !
 ! A14   A(1,5,12)             120.0812         -DE/DX =   -0.0001              !
 ! A15   A(11,5,12)            123.9654         -DE/DX =   -0.0001              !
 ! A16   A(4,12,5)             115.1098         -DE/DX =    0.0                 !
 ! A17   A(4,12,10)            122.4482         -DE/DX =    0.0                 !
 ! A18   A(5,12,10)            122.4419         -DE/DX =    0.0                 !
 ! D1    D(5,1,2,3)              0.0057         -DE/DX =    0.0                 !
 ! D2    D(5,1,2,7)            180.0027         -DE/DX =    0.0                 !
 ! D3    D(6,1,2,3)            180.0038         -DE/DX =    0.0                 !
 ! D4    D(6,1,2,7)              0.0008         -DE/DX =    0.0                 !
 ! D5    D(2,1,5,11)          -180.0018         -DE/DX =    0.0                 !
 ! D6    D(2,1,5,12)            -0.001          -DE/DX =    0.0                 !
 ! D7    D(6,1,5,11)             0.0002         -DE/DX =    0.0                 !
 ! D8    D(6,1,5,12)           180.001          -DE/DX =    0.0                 !
 ! D9    D(1,2,3,4)             -0.0074         -DE/DX =    0.0                 !
 ! D10   D(1,2,3,8)           -180.0016         -DE/DX =    0.0                 !
 ! D11   D(7,2,3,4)           -180.0044         -DE/DX =    0.0                 !
 ! D12   D(7,2,3,8)              0.0014         -DE/DX =    0.0                 !
 ! D13   D(2,3,4,9)            180.0049         -DE/DX =    0.0                 !
 ! D14   D(2,3,4,12)             0.0042         -DE/DX =    0.0                 !
 ! D15   D(8,3,4,9)             -0.0011         -DE/DX =    0.0                 !
 ! D16   D(8,3,4,12)          -180.0018         -DE/DX =    0.0                 !
 ! D17   D(3,4,12,5)             0.0005         -DE/DX =    0.0                 !
 ! D18   D(3,4,12,10)         -180.0            -DE/DX =    0.0                 !
 ! D19   D(9,4,12,5)          -180.0003         -DE/DX =    0.0                 !
 ! D20   D(9,4,12,10)           -0.0008         -DE/DX =    0.0                 !
 ! D21   D(1,5,12,4)            -0.002          -DE/DX =    0.0                 !
 ! D22   D(1,5,12,10)         -180.0015         -DE/DX =    0.0                 !
 ! D23   D(11,5,12,4)          179.9989         -DE/DX =    0.0                 !
 ! D24   D(11,5,12,10)          -0.0006         -DE/DX =    0.0                 !
 --------------------------------------------------------------------------------
 GradGradGradGradGradGradGradGradGradGradGradGradGradGradGradGradGradGrad
Both the forces and displacements are converged, indicating the optimisation was successful.
Frequency analysis of Boratabenzene
The log file of this frequency analysis is available here or in the chemical database: DOI:10042/21951
Summary of setup and data
Boratabenzene frequency
| File Name | JTL10_BORATABENZENE_FREQ |
|---|---|
| File Type | .log |
| Calculation Type | FREQ |
| Calculation Method | RB3LYP |
| Basis Set | 6-31G(d,p) |
| Charge | -1 |
| Spin | Singlet |
| E(RB3LYP) | -219.02052984 a.u. |
| RMS Gradient Norm | 0.00015838 a.u. |
| Imaginary Freq | |
| Dipole Moment | 2.8465 Debye |
| Point Group | C1 |
Job cpu time: 0 days 0 hours 5 minutes 33.3 seconds.
keywords:# freq b3lyp/6-31g(d,p) geom=connectivity
The total energy remains the same, indicating there is no change in structure.
Results
Low frequency table
Low frequencies ---  -13.1275   -0.0006   -0.0004    0.0004   15.0447   18.1653
 Low frequencies ---  371.3454  404.2334  565.2534
The 'zero' frequencies are within a small order of magnitude compare to the actual frequencies observed. The real frequencies are all positive. This suggests the frequency analysis was successful.
Population and NBO analysis of Boratabenzene
The log file of this population analysis is available here or in the chemical database: DOI:10042/21954
Summary of setup and data
Boratabenzene population
| File Name | JTL10_BORATABENZENE_POP |
|---|---|
| File Type | .log |
| Calculation Type | SP |
| Calculation Method | RB3LYP |
| Basis Set | 6-31G(d,p) |
| Charge | -1 |
| Spin | Singlet |
| E(RB3LYP) | -219.02052984 a.u. |
| RMS Gradient Norm | |
| Imaginary Freq | |
| Dipole Moment | 2.8465 Debye |
| Point Group | C1 |
Job cpu time: 0 days 0 hours 1 minutes 8.8 seconds.
keywords:# rb3lyp/6-31g(d,p) pop=(nbo,full) geom=connectivity
pop=full was added manually to carry out full NBO analysis.
Results
| Charge distribution by colour | Charge colour range | Charge distribution by numbers |
|---|---|---|

|
|
|
Optimisation of Pyridinium using B3LYP/6-31G(d,p) basis set
The log file of this optimisation is available here or in the chemical database: DOI:10042/21949
Pyridinium |
Summary of setup and data
Pyridinium optimisation
| File Name | JTL10_PYRIDINIUM_OPT_631G_DP |
|---|---|
| File Type | .log |
| Calculation Type | FOPT |
| Calculation Method | RB3LYP |
| Basis Set | 6-31G(d,p) |
| Charge | 1 |
| Spin | Singlet |
| E(RB3LYP) | -248.66807397 a.u. |
| RMS Gradient Norm | 0.00003236 a.u. |
| Imaginary Freq | |
| Dipole Moment | 1.8727 Debye |
| Point Group | C1 |
Job cpu time: 0 days 0 hours 3 minutes 57.5 seconds.
keywords:# opt b3lyp/6-31g(d,p) geom=connectivity
Results
Item Table
Item               Value     Threshold  Converged?
 Maximum Force            0.000059     0.000450     YES
 RMS     Force            0.000020     0.000300     YES
 Maximum Displacement     0.000685     0.001800     YES
 RMS     Displacement     0.000162     0.001200     YES
 Predicted change in Energy=-5.641922D-08
 Optimization completed.
    -- Stationary point found.
                           ----------------------------
                           !   Optimized Parameters   !
                           ! (Angstroms and Degrees)  !
 --------------------------                            --------------------------
 ! Name  Definition              Value          Derivative Info.                !
 --------------------------------------------------------------------------------
 ! R1    R(1,2)                  1.3988         -DE/DX =    0.0                 !
 ! R2    R(1,5)                  1.3839         -DE/DX =    0.0                 !
 ! R3    R(1,6)                  1.0835         -DE/DX =    0.0                 !
 ! R4    R(2,3)                  1.3988         -DE/DX =    0.0                 !
 ! R5    R(2,7)                  1.0852         -DE/DX =    0.0                 !
 ! R6    R(3,4)                  1.3839         -DE/DX =    0.0                 !
 ! R7    R(3,8)                  1.0835         -DE/DX =    0.0                 !
 ! R8    R(4,9)                  1.0832         -DE/DX =    0.0                 !
 ! R9    R(4,12)                 1.3524         -DE/DX =    0.0                 !
 ! R10   R(5,11)                 1.0832         -DE/DX =    0.0                 !
 ! R11   R(5,12)                 1.3524         -DE/DX =    0.0                 !
 ! R12   R(10,12)                1.0169         -DE/DX =    0.0                 !
 ! A1    A(2,1,5)              119.0826         -DE/DX =    0.0                 !
 ! A2    A(2,1,6)              121.4953         -DE/DX =   -0.0001              !
 ! A3    A(5,1,6)              119.4221         -DE/DX =    0.0                 !
 ! A4    A(1,2,3)              120.0564         -DE/DX =    0.0                 !
 ! A5    A(1,2,7)              119.9711         -DE/DX =    0.0                 !
 ! A6    A(3,2,7)              119.9725         -DE/DX =    0.0                 !
 ! A7    A(2,3,4)              119.0823         -DE/DX =    0.0                 !
 ! A8    A(2,3,8)              121.4967         -DE/DX =   -0.0001              !
 ! A9    A(4,3,8)              119.4211         -DE/DX =    0.0                 !
 ! A10   A(3,4,9)              123.9315         -DE/DX =    0.0                 !
 ! A11   A(3,4,12)             119.2352         -DE/DX =    0.0                 !
 ! A12   A(9,4,12)             116.8333         -DE/DX =    0.0                 !
 ! A13   A(1,5,11)             123.9329         -DE/DX =    0.0                 !
 ! A14   A(1,5,12)             119.2347         -DE/DX =    0.0                 !
 ! A15   A(11,5,12)            116.8323         -DE/DX =    0.0                 !
 ! A16   A(4,12,5)             123.3088         -DE/DX =    0.0                 !
 ! A17   A(4,12,10)            118.3459         -DE/DX =    0.0                 !
 ! A18   A(5,12,10)            118.3453         -DE/DX =    0.0                 !
 ! D1    D(5,1,2,3)             -0.0001         -DE/DX =    0.0                 !
 ! D2    D(5,1,2,7)            180.0004         -DE/DX =    0.0                 !
 ! D3    D(6,1,2,3)           -180.0002         -DE/DX =    0.0                 !
 ! D4    D(6,1,2,7)              0.0003         -DE/DX =    0.0                 !
 ! D5    D(2,1,5,11)           180.0            -DE/DX =    0.0                 !
 ! D6    D(2,1,5,12)            -0.0004         -DE/DX =    0.0                 !
 ! D7    D(6,1,5,11)             0.0001         -DE/DX =    0.0                 !
 ! D8    D(6,1,5,12)          -180.0003         -DE/DX =    0.0                 !
 ! D9    D(1,2,3,4)              0.0004         -DE/DX =    0.0                 !
 ! D10   D(1,2,3,8)            180.0002         -DE/DX =    0.0                 !
 ! D11   D(7,2,3,4)           -180.0001         -DE/DX =    0.0                 !
 ! D12   D(7,2,3,8)             -0.0003         -DE/DX =    0.0                 !
 ! D13   D(2,3,4,9)           -180.0            -DE/DX =    0.0                 !
 ! D14   D(2,3,4,12)            -0.0002         -DE/DX =    0.0                 !
 ! D15   D(8,3,4,9)              0.0002         -DE/DX =    0.0                 !
 ! D16   D(8,3,4,12)          -180.0            -DE/DX =    0.0                 !
 ! D17   D(3,4,12,5)            -0.0003         -DE/DX =    0.0                 !
 ! D18   D(3,4,12,10)          180.0            -DE/DX =    0.0                 !
 ! D19   D(9,4,12,5)          -180.0005         -DE/DX =    0.0                 !
 ! D20   D(9,4,12,10)           -0.0002         -DE/DX =    0.0                 !
 ! D21   D(1,5,12,4)             0.0006         -DE/DX =    0.0                 !
 ! D22   D(1,5,12,10)          180.0003         -DE/DX =    0.0                 !
 ! D23   D(11,5,12,4)          180.0002         -DE/DX =    0.0                 !
 ! D24   D(11,5,12,10)          -0.0001         -DE/DX =    0.0                 !
 --------------------------------------------------------------------------------
 GradGradGradGradGradGradGradGradGradGradGradGradGradGradGradGradGradGrad
Both the forces and displacements are converged, indicating the optimisation was successful.
Frequency analysis of Pyridinium
The log file of this frequency analysis is available here or in the chemical database: DOI:10042/21952
Summary of setup and data
Pyridinium frequency
| File Name | JTL10_PYRIDINIUM_FREQ |
|---|---|
| File Type | .log |
| Calculation Type | FREQ |
| Calculation Method | RB3LYP |
| Basis Set | 6-31G(d,p) |
| Charge | 1 |
| Spin | Singlet |
| E(RB3LYP) | -248.66807397 a.u. |
| RMS Gradient Norm | 0.00003234 a.u. |
| Imaginary Freq | |
| Dipole Moment | 1.8727 Debye |
| Point Group | C1 |
Job cpu time: 0 days 0 hours 5 minutes 38.7 seconds.
keywords:# freq b3lyp/6-31g(d,p) geom=connectivity
The total energy remains the same, indicating there is no change in structure.
Results
Low frequency table
Low frequencies ---   -7.1947    0.0006    0.0007    0.0012   17.4261   18.7048
 Low frequencies ---  392.4494  404.0786  620.4749
The 'zero' frequencies are within a small order of magnitude compare to the actual frequencies observed. The real frequencies are all positive. This suggests the frequency analysis was successful.
Population and NBO analysis of Pyridinium
The log file of this population analysis is available here or in the chemical database: DOI:10042/21955
Summary of setup and data
Pyridinium population
| File Name | JTL10_PYRIDINIUM_POP |
|---|---|
| File Type | .log |
| Calculation Type | SP |
| Calculation Method | RB3LYP |
| Basis Set | 6-31G(d,p) |
| Charge | 1 |
| Spin | Singlet |
| E(RB3LYP) | -248.66807397 a.u. |
| RMS Gradient Norm | |
| Imaginary Freq | |
| Dipole Moment | 1.8727 Debye |
| Point Group | C1 |
Job cpu time: 0 days 0 hours 1 minutes 12.3 seconds.
keywords:# rb3lyp/6-31g(d,p) pop=(nbo,full) geom=connectivity
pop=full was added manually to carry out full NBO analysis.
Results
| Charge distribution by colour | Charge colour range | Charge distribution by numbers |
|---|---|---|
|
|
|
Optimisation of Borazine using B3LYP/6-31G(d,p) basis set
The log file of this optimisation is available here or in the chemical database: DOI:10042/22023
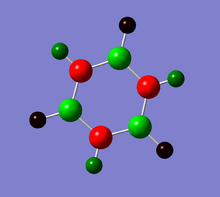
Borazine |
Summary of setup and data
Borazine optimisation
| File Name | JTL10_BORAZINE_OPT_631G_DP |
|---|---|
| File Type | .log |
| Calculation Type | FOPT |
| Calculation Method | RB3LYP |
| Basis Set | 6-31G(d,p) |
| Charge | 0 |
| Spin | Singlet |
| E(RB3LYP) | -242.68460356 a.u. |
| RMS Gradient Norm | 0.00009962 a.u. |
| Imaginary Freq | |
| Dipole Moment | 0.0000 Debye |
| Point Group | C1 |
Job cpu time: 0 days 0 hours 5 minutes 2.6 seconds.
keywords:# opt b3lyp/6-31g(d,p) geom=connectivity
Results
Item Table
Item               Value     Threshold  Converged?
 Maximum Force            0.000139     0.000450     YES
 RMS     Force            0.000052     0.000300     YES
 Maximum Displacement     0.000579     0.001800     YES
 RMS     Displacement     0.000150     0.001200     YES
 Predicted change in Energy=-2.567044D-07
 Optimization completed.
    -- Stationary point found.
                           ----------------------------
                           !   Optimized Parameters   !
                           ! (Angstroms and Degrees)  !
 --------------------------                            --------------------------
 ! Name  Definition              Value          Derivative Info.                !
 --------------------------------------------------------------------------------
 ! R1    R(1,7)                  1.1949         -DE/DX =    0.0001              !
 ! R2    R(2,11)                 1.0098         -DE/DX =   -0.0001              !
 ! R3    R(3,9)                  1.1949         -DE/DX =    0.0001              !
 ! R4    R(4,12)                 1.0098         -DE/DX =   -0.0001              !
 ! R5    R(5,8)                  1.1949         -DE/DX =    0.0001              !
 ! R6    R(6,10)                 1.0098         -DE/DX =   -0.0001              !
 ! R7    R(7,10)                 1.4307         -DE/DX =   -0.0001              !
 ! R8    R(7,11)                 1.4307         -DE/DX =   -0.0001              !
 ! R9    R(8,10)                 1.4307         -DE/DX =   -0.0001              !
 ! R10   R(8,12)                 1.4307         -DE/DX =   -0.0001              !
 ! R11   R(9,11)                 1.4307         -DE/DX =   -0.0001              !
 ! R12   R(9,12)                 1.4307         -DE/DX =   -0.0001              !
 ! A1    A(1,7,10)             121.4436         -DE/DX =    0.0                 !
 ! A2    A(1,7,11)             121.4424         -DE/DX =    0.0                 !
 ! A3    A(10,7,11)            117.114          -DE/DX =    0.0001              !
 ! A4    A(5,8,10)             121.4413         -DE/DX =    0.0                 !
 ! A5    A(5,8,12)             121.4482         -DE/DX =   -0.0001              !
 ! A6    A(10,8,12)            117.1105         -DE/DX =    0.0001              !
 ! A7    A(3,9,11)             121.4449         -DE/DX =    0.0                 !
 ! A8    A(3,9,12)             121.4423         -DE/DX =    0.0                 !
 ! A9    A(11,9,12)            117.1129         -DE/DX =    0.0                 !
 ! A10   A(6,10,7)             118.5552         -DE/DX =    0.0                 !
 ! A11   A(6,10,8)             118.5564         -DE/DX =    0.0                 !
 ! A12   A(7,10,8)             122.8884         -DE/DX =   -0.0001              !
 ! A13   A(2,11,7)             118.5616         -DE/DX =    0.0                 !
 ! A14   A(2,11,9)             118.5539         -DE/DX =    0.0                 !
 ! A15   A(7,11,9)             122.8845         -DE/DX =    0.0                 !
 ! A16   A(4,12,8)             118.555          -DE/DX =    0.0                 !
 ! A17   A(4,12,9)             118.5552         -DE/DX =    0.0                 !
 ! A18   A(8,12,9)             122.8898         -DE/DX =   -0.0001              !
 ! D1    D(1,7,10,6)             0.0004         -DE/DX =    0.0                 !
 ! D2    D(1,7,10,8)           179.9998         -DE/DX =    0.0                 !
 ! D3    D(11,7,10,6)         -179.9996         -DE/DX =    0.0                 !
 ! D4    D(11,7,10,8)           -0.0002         -DE/DX =    0.0                 !
 ! D5    D(1,7,11,2)             0.0004         -DE/DX =    0.0                 !
 ! D6    D(1,7,11,9)           179.9994         -DE/DX =    0.0                 !
 ! D7    D(10,7,11,2)         -179.9996         -DE/DX =    0.0                 !
 ! D8    D(10,7,11,9)           -0.0006         -DE/DX =    0.0                 !
 ! D9    D(5,8,10,6)            -0.0002         -DE/DX =    0.0                 !
 ! D10   D(5,8,10,7)          -179.9996         -DE/DX =    0.0                 !
 ! D11   D(12,8,10,6)          179.9999         -DE/DX =    0.0                 !
 ! D12   D(12,8,10,7)            0.0005         -DE/DX =    0.0                 !
 ! D13   D(5,8,12,4)            -0.0003         -DE/DX =    0.0                 !
 ! D14   D(5,8,12,9)           180.0            -DE/DX =    0.0                 !
 ! D15   D(10,8,12,4)          179.9996         -DE/DX =    0.0                 !
 ! D16   D(10,8,12,9)           -0.0001         -DE/DX =    0.0                 !
 ! D17   D(3,9,11,2)            -0.0001         -DE/DX =    0.0                 !
 ! D18   D(3,9,11,7)          -179.9991         -DE/DX =    0.0                 !
 ! D19   D(12,9,11,2)          179.9999         -DE/DX =    0.0                 !
 ! D20   D(12,9,11,7)            0.0009         -DE/DX =    0.0                 !
 ! D21   D(3,9,12,4)            -0.0003         -DE/DX =    0.0                 !
 ! D22   D(3,9,12,8)           179.9995         -DE/DX =    0.0                 !
 ! D23   D(11,9,12,4)          179.9997         -DE/DX =    0.0                 !
 ! D24   D(11,9,12,8)           -0.0006         -DE/DX =    0.0                 !
 --------------------------------------------------------------------------------
 GradGradGradGradGradGradGradGradGradGradGradGradGradGradGradGradGradGrad
Both the forces and displacements are converged, indicating the optimisation was successful.
Frequency analysis of Borazine
The log file of this frequency analysis is available here or in the chemical database: DOI:10042/22024
Summary of setup and data
Borazine frequency
| File Name | JTL10_BORAZINE_FREQ |
|---|---|
| File Type | .log |
| Calculation Type | FREQ |
| Calculation Method | RB3LYP |
| Basis Set | 6-31G(d,p) |
| Charge | 0 |
| Spin | Singlet |
| E(RB3LYP) | -242.68460377 a.u. |
| RMS Gradient Norm | 0.00009967 a.u. |
| Imaginary Freq | |
| Dipole Moment | 0.0000 Debye |
| Point Group | C1 |
Job cpu time: 0 days 0 hours 5 minutes 32.3 seconds.
keywords:# freq b3lyp/6-31g(d,p) geom=connectivity
The total energy remains the same, indicating there is no change in structure.
Results
Low frequency table
Low frequencies ---   -0.0008   -0.0002    0.0008    9.5039   12.1221   17.9816
 Low frequencies ---  289.3473  289.8645  404.4527
The 'zero' frequencies are within a small order of magnitude compare to the actual frequencies observed. The real frequencies are all positive. This suggests the frequency analysis was successful.
Population and NBO analysis of Borazine
The log file of this population analysis is available here or in the chemical database: DOI:10042/22025
Summary of setup and data
Borazine population
| File Name | JTL10_BORAZINE_POP |
|---|---|
| File Type | .log |
| Calculation Type | SP |
| Calculation Method | RB3LYP |
| Basis Set | 6-31G(d,p) |
| Charge | 0 |
| Spin | Singlet |
| E(RB3LYP) | -242.68460377 a.u. |
| RMS Gradient Norm | |
| Imaginary Freq | |
| Dipole Moment | 0.0000 Debye |
| Point Group | C1 |
Job cpu time: 0 days 0 hours 1 minutes 6.9 seconds.
keywords:# rb3lyp/6-31g(d,p) pop=(nbo,full) geom=connectivity
pop=full was added manually to carry out full NBO analysis.
Results
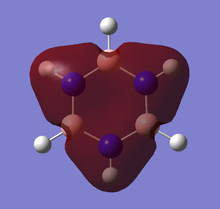
| Charge distribution by colour | Charge colour range | Charge distribution by numbers |
|---|---|---|

|
|
|
Comparison, analysis and Discussions
Molecular orbital diagram of benzene
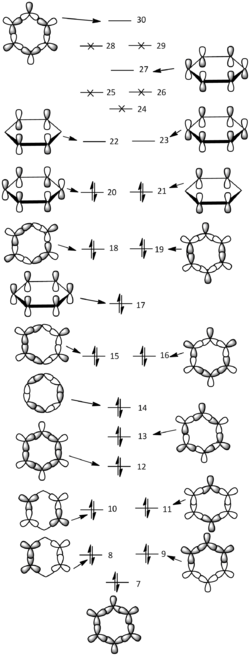
- The MO diagram on the left shows the linear combination of atomic orbitals (LCAO) of benzene derived backwards using computed molecular orbitals generated by the optimised molecule.
- The 7th up to 30thmolecular orbitals are included except some higher ones that were not possible to derive from computed MOs. The first 6 orbitals were omitted because they are combinations of 1s orbitals of the carbon atoms which are described as core, they are not within the area of interest about aromaticity.
- A general concept of MO diagrams can be seen since MOs with lower energies are observed to possess higher symmetries and less nodal planes.
- Aromatic compounds like benzene consists of delocalised conjugated π system, often involving alternating single and double bonds, where the contributing atomic orbitals are all co-planar and arranged in one or more ring structures. Molecular orbitals 17, 20, 21, 22, 23 and 27 are shown on the left illustrating the combined 2p carbon orbitals that are perpendicular to the plane of the molecule.
- With the lower three levels filled with two electron each, in total six known as π electrons, that obeys the Hückel's Rule (4n+2 where n is an integer); this provides a large stabilising effect (more and only bonding character) to the benzene molecule which is commonly known as aromaticity. The degeneracies in 20 & 21 and 22 & 23 are also important as the high symmetry allows the electron density to be more delocalised evenly over a larger area across the molecule.
- The delocalised ring of π electrons generates a ring of current, allowing aromatic molecules to have special electronic properties that are useful in various chemical reactions and analytical techniques.
Comparison of NBO analysis
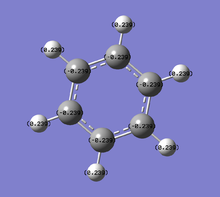
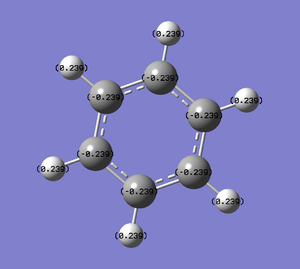
- The table above shows the charge distribution of electron density by colour as well as number with respect to natural bond orbital (NBO) calculations. As would have expected the charge is evenly distributed in benzene (-0.239 on C, 0.239 on H) since all atoms around the ring are the same, negative charge are spread across the ring of carbon atoms; whereas boratabenzene and pyridinium do not show even charge distribution, due to the involvement of heteroatom.
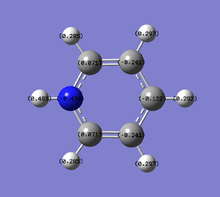
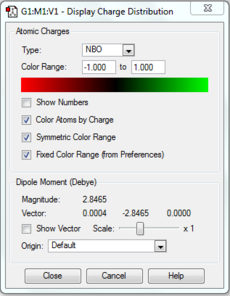
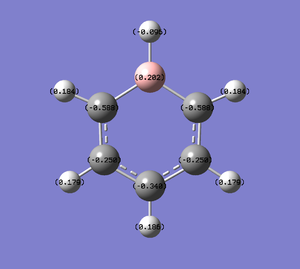
- Boratabenzene has one boron atom replaced on one carbon atom that of benzene, with a negative -1 charge that retains isoelectronic to benzene hence also aromatic. As boron is much more electropositive than carbon, (B:2.0,C:2.5) it shows a positive charge on it(0.202) that results in the ortho-carbons possessing a very high negative charge (-0.588, more than double of that in benzene), also causing high negative charges on the meta-carbons (-0.250), para-carbons (-0.340), and less positively charged hydrogens that are attached to the carbons, all in comparison to benzene. It is also observed that the electron deficienct boron being even more electropositive than hydrogen (B:2.0, H:2.1), the adjacent hydrogen atom was allowed to carry a slight negative charge(-0.096).
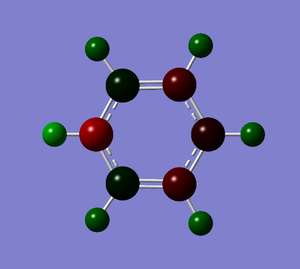
- Pyridinium has a nitrogen atom instead of a carbon atom of benzene, with a positive +1 charge to be isoelectronic to benzene hence also aromatic. With the case completely opposite to boratabenzene, nitrogen is much more electronegative than carbon (N:3.0, C:2.5), thus most of the negative charge (-0.476) is carried in it. This affects the ortho-carbons the most which are made slightly positively charged (0.071) and the rest carbons are about the same or less negative than the benzene carbons. All hydrogen atoms, particularly the one adjacent to electron rich nitrogen, are seen to carry much higher positive charges (0.483, 0.297) than benzene hydrogens(0.239).
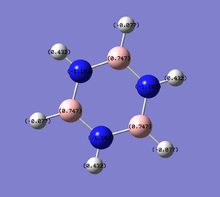
- Borazine provides more interesting properties due to the ring of alternating boron and nitrogen atoms, although it consists of atoms completely different to benzene, it is still isoelectronic to benzene. The fact that neighbouring boron and nitrogen atoms have very large difference in electronegativity (N:3.0, B:2.0), the charge distribution is separated distinctively with 0.747 on B and -1.102 on N. By comparing the colour coded charge distribution visualisation, the diversity of borazine with other three molecules are very obvious, the positive and negative charges are distinguished very clearly. Hydrogens attached to nitrogen show a strong positive charge (0.432) and the ones attached to boron carry very slight negative charge (-0.077) in contrast to benzene hydrogens (0.239). There are controversial discussions about the aromaticity of borazine; it can be considered as aromatic in terms of conjugated π systems, yet as described the electronic system is not as delocalised as benzene. This leads to borazine being relatively much more unstable than benzene hence more reactive and allows many direct reactions that are not normally spontaneous using benzene.
Comparison of Computed molecular orbitals
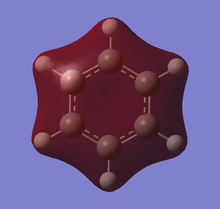
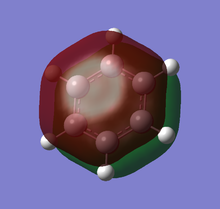
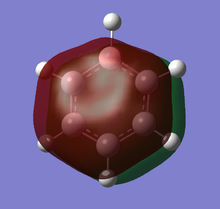
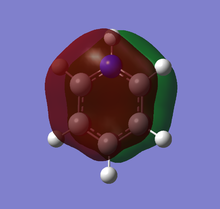
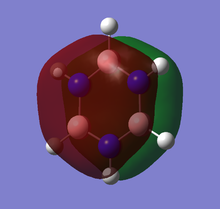
- MO 7 illustrates the most symmetrical total bonding σ orbitals, for benzene it has an expected symmetrical star shape showing an even distribution of electron density, whereas the other 3 analogues show distorted MOs due to the present of heteroatoms. The electronegativities are N > C > B, therefore it can be observed that borazine and pyridinium show higher electron densities around nitrogen atoms; as well as borazine and boratabenzene show low densities around boron atoms. This result is consistent with the NBO charge distribution analysis.
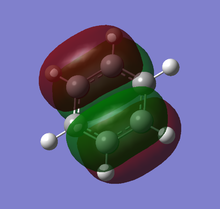
- MO 17 illustrates the first π-bonding molecular orbitals, where the nodal plane is across the plane of the molecule. Similar patterns are observed alike to MO 7, as benzene shows symmetrical hexagonal shape and others show slight distortion due to electron density tends towards nitrogens and away from borons.
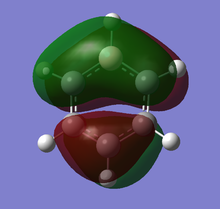
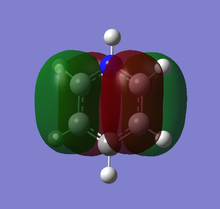
- MO 21 is one of the two degenerate orbitals (and MO 20) that is also π-bonding molecular orbital, with higher energies than MO 17 and two nodal planes. The effect of electronegativities of atoms on electron distribution can still be seen similar to MO 7 and 17 but very small, due to the fact that it is higher in energy and weaker interactions between π than σ orbitals. An interesting point can be seen in the MO 21 of boratabenzene, the energy is found to be positive which indicates anti-bonding character. Since this orbital is filled this structure may have a decrease in stability hence could explain why boratabenzene ions will complex as ligands or dimerise rather than existing in free state.
- From MO 7 to 21, an increase in energy is observed due to the decrease in bonding character, which is always the case in an MO diagram. Therefore the energy values calculated obey the general concepts. MO 17 and 21 are ones of the important filled π-bonding molecular orbitals that provides the aromticity to the molecules.
- In terms of energy ordering, all chosen MOs show similar pattern in each set of MO comparison, where pyridinium is the most stable and has the lowest energy followed by borazine, benzene and boratabenzene. This can also be explained by electronegativities of the different atoms involved. As nitrogen is the most electronegative, its AOs will be more stabilised down in energy causing the corresponding formation of MOs to be low in energy, and applies to the complete opposite for electropositive boron. Hence pyridinium is most stable because there are only carbons and nitrogens. Benzene and borazine are fairly similar in energy with borazine slightly higher, due to observed 'balanced' effect of equal numbers of electropositive borons and electronegative nitrogens, in contrast to benzene carbons with relative middle range electronegativity. Finally boratabenzene is the most destabilised as there is an electropositive boron present.
The effect of heteroatom substitution
- As described above introducing one or more heteroatoms substitution in the analogues of benzene can increase or decrease the energy of each AOs, subsequently also MOs, depending on the electronegativity of the heteroatom(s). When considering the effect on a full MO, heteroatoms will increase the energy gap between the AOs that are combining, which will result in slightly worse overlapping and decreases the energy splitting when combined. So degenerate levels in benzene are no longer degenerate in the case of boratabenzene and pyridinium.
- For example if the energy differences with respect to MO 7, 17 and 21 of pyridinium and benzene (0.36724 > 0.28065 > 0.23194) are compared, a decreasing difference can be found. This is because the asymmteric C-N combination to symmetric C-C combination has gradual greater effect on higher energy AOs when combining. This means MO 21 in pyridinium was generated with AOs that has larger energy difference, than of MO 7. This is predicted to be true for other orbitals in the full MO diagram. In the case of borazine, since it has a very high symmetry in its structure, it is able to retain the degenerate levels and show similar energies to benzene.
References
1. J. Glaser, G. Johansson. Acta Chemica Scandinavica, 1982, 36a, Pp. 125-135.

