Rep:Mod:ja2209module3
Joshua Almond-Thynne: Year 3 Computational Labs - Module 3: Transition States and Reactivity
Introduction
The aims of this particular investigation is to gain a familiarity with the interface of Gaussian Transition State modelling, up until now (Module 1, Module 2) gaussview has been used to model compounds that are experimental obtainable and calculate their properties and then compare them to wet lab results. In this module Gaussview will be used to model products, reactants and most importantly transition states of certain reactions. This modelling allows us to gain insight into the mechanism of which a reaction may follow as well as key estimates of thermochemical data such as Free energies, Enthalpies, Activation energies and so on allowing us to look at whether selectivity may arise or whether a reaction may not even occur at all.
Unless stated otherwise stated all compounds modelled in this module where modelled in Gaussview 5.0 and calculation where run with their respective methods and basis sets via Gaussian 09W. If the calculation was deemed to be “large” the Gaussian input file (.gjf) was sent to the HPC server. If this was the case a D-space repository DOI will be supplied. If the calculation was run on the university issued laptop a .LOG file will be provided. If any other files are required for inspection please do not hesitate to ask via my email of ja2209@ic.ac.uk.
Also note that any conversions between Hartress and kcalmol-1 or kJmol-1 were made on the presumption: 1 Ha = 627.5 kcalmol-1 and 1 kcalmol-1= 4.2 kJmol-1.
The Cope Rearrangement


The cope rearrangement named after Arthur Cope is a [3,3] sigmatrophic rearrangement reaction for 1,5-hexadiene (and substituted forms)[1][2] . It follows a pericyclic mechanism, which means three things:
- The electrons move in a concerted manner
- The electrons can move in either direction around the mechanism
- The reaction goes via a aromatic transition state
This reaction although concerted (which can be seen later in the report through imaginary frequency analysis) it is stated to go via a transition state which is equivalent to a di-radical structurally and energetically however this description is not quite correct and it is generally considered just a pictorial method to present the transition state. There are many various alterations of the Cope reaction such as the Aza-Cope or the Oxy-Cope. A particularly interesting case of the Cope rearrangement is that in the family of compounds called the Bullvalenes which the rearrangements causes its fluxional states. In occurs under mild conditions due to its symmetry allowed and complete suprafacial character allowing retention of any stereochemistry present.
Aims and Objectives
- To model and optimize all conformers of 1,5-hexadiene to find which one is the most stable and therefore the conformer in highest concentration.
- Also a comparison between methods of optimising and there effect on energies and structure with a comparison between HF and DFT.
- Calculate vibrational and thermochemistry data for the most stable conformers and compare between conformers.
- Also a comparison between methods for calculating vibrational and thermochemistry data between HF and DFT and DFT calculated at a theoretical 0K.
- Model both the chair and boat transition states in a number of ways and find out which is the most stable through vibrational analysis.
- Plot a reaction pathway diagram using IRS calculations giving an insight into the energy profile of a reaction.
- Final calculate the activation energies of the reaction through different transition states and compare them to literature value to see how accurate and useful transition state modelling can be.
Optimization of the Conformers of 1,5-hexadiene
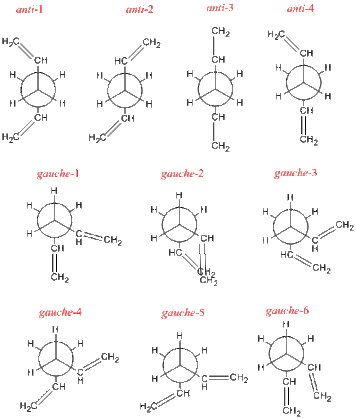
The first thing to not is 1,5-hexadiene exists in both anti and gauche conformers which correspond to how the CH=CH2 arrange them selves around the central C-C bond. In ‘’anti’’ they are 90° to each other and in ‘’gauche’’ they lie 60° to each other. However both anti and gauche both has several sub conformers relying on the orientation of the C=C bond (or the dihedral angles adjacent of the C-C central bond and keeping the central dihedral fixed). All the conformers under investigation are seen in the picture to the right. (N.B. dihedral angles noted in the optimization table). Each conformer was then with optimized using a ‘’[HF/3-21G]’’ method and basis set. Their resulting energies in Hartrees (67.5kcalmol-1) are in the table below aswell as there relative energies in kcalmol-1 along with links to the jmol’s and their point group. The point group was found after optimization by forcing symmetry in Gaussian.
| Conformer | Jmol | Total Energy (Ha) | Point Group | Relative Energy (kcalmol-1) | C3-C4-C5-C6 Dihedral Angle | C4-C3-C2-C1 Dihedral Angle | .LOG File |
|---|---|---|---|---|---|---|---|
| Anti 1 | -231.69260 | C2 | 0.04 | 115.5° | 115.1° | .LOG | |
| Anti 2 | -231.69254 | Ci | 0.08 | -114.7° | 114.7° | .LOG | |
| Anti 3 | -231.68907 | C2h | 2.25 | 0.0° | 0.0° | .LOG | |
| Anti 4 | -231.69097 | C1 | 1.06 | 114.5° | 0.2° | .LOG | |
| Gauche 1 | -231.68772 | C2 | 3.10 | -1.6° | -1.6° | .LOG | |
| Gauche 2 | -231.69167 | C2 | 0.62 | -124.0° | -124.0° | .LOG | |
| Gauche 3 | -231.69266 | C1 | 0.00 | -117.2° | 120.9° | .LOG | |
| Gauche 4 | -231.69153 | C2 | 0.71 | 109.4° | 109.4° | .LOG | |
| Gauche 5 | -231.68962 | C1 | 1.91 | 121.1° | 14.2° | .LOG | |
| Gauche 6 | -231.68916 | C1 | 2.20 | 1.0° | -139.1° | .LOG |
Discussion of Stability
Looking in terms of sterics it would be assumed that the the anti would be preffered however from the table you can see that overall gauche is more stable. This however can be explained in terms of stereoelectronics. In the ‘’gauche’’ conformer there is alignment of there usually the stereochemistry of a conformer is effected by three things[3]:
- Pauli Repulsion of bond electrons (prefers anti)
- H-H interactions when short are destabilising but and when long can be slightly stabilising (usually have a small favourability of gauche)
- Most importantly orbital interactions between various σ and σ*
These orbital interactions can actually be seen in the MO analysis, which I have run for the most stable conformer gauche-3 and the most stable anti; anti-1. From the NBO it can be seen there is more stabilisation of energy in this form of splitting in the gauche due to the σC-H-σ*C-C having a larger stabilisation that that of σC-C-σ*C-C.
ANTI-1
 Second Order Perturbation Theory Analysis of Fock Matrix in NBO Basis

     Threshold for printing:   0.50 kcal/mol
                                                                              E(2)  E(j)-E(i) F(i,j)
         Donor NBO (i)                     Acceptor NBO (j)                 kcal/mol   a.u.    a.u.
 ===================================================================================================
   6. BD (   1) C   4 - C   6        / 69. BD*(   1) C   9 - C  12            2.23    1.47    0.051
   7. BD (   1) C   6 - H   7        / 67. BD*(   1) C   9 - H  10            2.73    1.37    0.055
   8. BD (   1) C   6 - H   8        / 68. BD*(   1) C   9 - H  11            2.88    1.38    0.057
                                                          TOTAL STABILIZATION=7.84
|
GAUCHE-3
 Second Order Perturbation Theory Analysis of Fock Matrix in NBO Basis

     Threshold for printing:   0.50 kcal/mol
                                                                              E(2)  E(j)-E(i) F(i,j)
         Donor NBO (i)                     Acceptor NBO (j)                 kcal/mol   a.u.    a.u.
 ===================================================================================================
   7. BD (   1) C   6 - H   7        / 68. BD*(   1) C   9 - H  11            2.90    1.38    0.057
   8. BD (   1) C   6 - H   8        / 69. BD*(   1) C   9 - C  12            3.37    1.33    0.060
  10. BD (   1) C   9 - H  10        / 63. BD*(   1) C   4 - C   6            3.56    1.33    0.061
                                                          TOTAL STABILIZATION=9.38
|
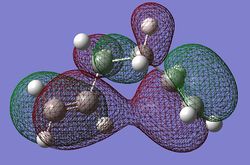
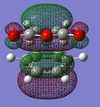
However this is not the only factor to take into consideration, the gauche conformers are more sterically strained therefore higher in energy, but at the same time an interesting MO was found in the gauche-3 conformer where the two terminal alkenes are aligned in the right way to have something i would describe as "through space conjugation" which can be seen in the diagram of the HOMO MO to the right of the page. As much analysis as I can do I cannot find a definitive answer to why something is more stable as such close energies it is a mixture of lots of effects canceling each other out or adding together but in this particular method the gauche is more stable.
Application of Full Electron Basis Set
| Conformer | Jmol | Total Energy (Ha) | Point Group | Relative Energy (kcalmol-1) | C3-C4-C5-C6 Dihedral Angle | C4-C3-C2-C1 Dihedral Angle | .LOG File |
|---|---|---|---|---|---|---|---|
| Anti 1 | -234.61779 | C2 | 0.00 | 115.5° | 115.1° | .LOG | |
| Anti 2 | -234.61170 | Ci | 3.82 | -114.7° | 114.7° | .LOG | |
| Gauche 3 | -234.61133 | C1 | 4.05 | -119.4° | 122.1° | .LOG |
The 3 most stable and closest in energy conformers where taken for further optimization by a full electron basis set which in theory will give a more accurate energy and structure.
From the application of [DFT/6-31G(d)] it can be seen that the expected result is shown where the anti-1/2 are now more stable than the gauche-3. This is due to the fact the full electron basis set is weighted slightly difference or the new slightly altered structure has a tiny amount more/less steric strain. A definitive reason will probably not be able to find but that is why you cant compare energies between basis sets/methods. With energies this close it could be one of a thousand reasons why the anti in this case is slightly more favorable than gauche.
Structural Comparison between Basis Sets
Gauche-3 was chosen for structural comparison due to the least symmetry in the conformer meaning it may be more likely to be effected.
The energies have shifted but the effect of different basis sets on structure is very small seen by the tabulated structure data for gauche-3 with very little difference coming from bond length/angle or dihedral angles. This shows that the structure does not change in a compound but the energies might drastically. This effect on structural is completely reliant on the way a particular method works on even its convergence criteria. But you can see from the comparison below a very small effect on structure is seen with the biggest effect being the dihedral angles.
| Method | C1-C2 Length | C2-C3 Length | C3-C4 Length | C4-C5 Length | C5-C6 Length | C1-C2-C3 Angle | C2-C3-C4 Angle | C3-C4-C5 Angle | C4-C5-C6 Angle | C4-C3-C2-C1 Dihedral Angle | C2-C3-C4-C5 Dihedral Angle | C3-C4-C5-C6 Dihedral Angle |
|---|---|---|---|---|---|---|---|---|---|---|---|---|
| HF | 1.32Å | 1.51Å | 1.55Å | 1.51Å | 1.32Å | 124.5° | 111.8° | 111.9° | 125.0° | 120.9° | 67.7° | -117.2° |
| DFT | 1.33Å | 1.50Å | 1.55Å | 1.50Å | 1.33Å | 124.9° | 113.5° | 113.5° | 125.5° | 122.1° | 66.3° | -119.4° |
Vibrational and Thermochemistry Analysis
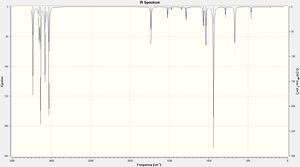
The key points to make about the vibrational analysis is that none of the conformers showed no large negative frequencies showing they are indeed minimas in energy (rather than a non-minima i.e Transition state which shows large negative frequencies) and the differences in the C=C stretches of the compounds. All having similar values the anti' conformers have a smaller intensity for the symmetric C=C stretch than the gauche due to there increased symmetry meaning there there is less of a dipole moment change and therefore less IR active. Whereas the gauche both stretches have identical intensities because they both change the dipole moment in the same way.
A COMPARISON TO LITERATURE
| Mode | Anti 1 | Anti 2 | Gauche 3 |
|---|---|---|---|
| Symmetric C=C Frequency (cm-1) | 1731.96 | 1730.95 | 1731.86 |
| Symmetric C=C Intensity | 4.73 | 0.00 | 6.89 |
| Asymmetric C=C Frequency (cm-1) | 1734.86 | 1734.95 | 1732.98 |
| Asymmetric C=C Intensity | 13.55 | 18.1624 | 6.89 |
| Vibrational Spectra |  |
 |
 |
| .LOG FILE | .LOG | .LOG | .LOG |
Thermochemistry of the Conformers
Anti 2 at 298K DFT
Sum of electronic and zero-point Energies= -234.469218
Sum of electronic and thermal Energies= -234.461861
Sum of electronic and thermal Enthalpies= -234.460916
Sum of electronic and thermal Free Energies= -234.500832
Anti 2 at 298K HF Sum of electronic and zero-point Energies= -231.539540 Sum of electronic and thermal Energies= -231.532566 Sum of electronic and thermal Enthalpies= -231.531622 Sum of electronic and thermal Free Energies= -231.570915 |
Both methods give similar data to that of the energies of the optimized structure with similar differences in zero point and thermal values, In this case for the sake of accuracy I will continue to use DFT full electron basis set methods due to the fact in theory I will get more accurate results. |
Anti 2 at 298K DFT
Sum of electronic and zero-point Energies= -234.469218
Sum of electronic and thermal Energies= -234.461861
Sum of electronic and thermal Enthalpies= -234.460916
Sum of electronic and thermal Free Energies= -234.500832
Anti 2 at 0.0001K DFT (To prevent refusal of calculation) Sum of electronic and zero-point Energies= -234.468781 Sum of electronic and thermal Energies= -234.468781 Sum of electronic and thermal Enthalpies= -234.468781 Sum of electronic and thermal Free Energies= -234.468781 |
As you can see there is little difference between running the vibrational calculations at 298K and 0K with the value of sum of electronic and zero-point energies ≈0.005a.u.(≈3 kcalmol-1) however the complication of sending off the method for analysis with its more complex input files and larger CPU time I will continue to use the standard running of vibrational data at 298K for the sake of time. The other point of interest is for all 4 values run at 0K they are equal, This is a trivial but important point to make in the sense at 0K there is technically no thermal energies/enthalpies/free energies so all values should be the same which shows the calculation was successful. A possible investigation of the effects of temperature on the thermochemistry values would be to run the calculation at various temperatures and plot each of the 4 values against temperature. The calculation was run at 0K by adding the keyword Freq=ReadIsotopes with the additional data at the end of the .gjf provided in the table to the left. | 0.00001 1.0 12.0 1.0 1.0 12.0 1.0 12.0 1.0 1.0 12.0 1.0 1.0 12.0 1.0 12.0 1.0 1.0 |
Anti 1 at 298K DFT
Sum of electronic and zero-point Energies= -234.469298
Sum of electronic and thermal Energies= -234.461966
Sum of electronic and thermal Enthalpies= -234.461022
Sum of electronic and thermal Free Energies= -234.500862
Anti 2 at 298K DFT Sum of electronic and zero-point Energies= -234.469218 Sum of electronic and thermal Energies= -234.461861 Sum of electronic and thermal Enthalpies= -234.460916 Sum of electronic and thermal Free Energies= -234.500832 Gauche 3 at 298K DFT Sum of electronic and zero-point Energies= -234.468693 Sum of electronic and thermal Energies= -234.461464 Sum of electronic and thermal Enthalpies= -234.460520 Sum of electronic and thermal Free Energies= -234.500105 |
From the three difference conformers it can be seen the sum of electronic energies and zero point energies are very close in size with a difference between all three being ≈0.0006a.u.(≈0.3 kcalmol1) with the lowest in energy being the anti-1 and the highest being gauche-3. with all the thermal values varying to a similar amount in all the conformers. An additional investigation would be to look at the relative st abilities at different tempertautes to see if all the conormers follow the same trend of calculated thermochemistry values at different temperatures or see if one particular isomer becomes more favorable with increased heat. |
Optimization of the Transition States

| |
| Chair Transition State | Boat Transition State |
The Cope-Rearrangement goes via an aromatic transition state which can either be a Chair or Boat Cyclohexane ring. In the following section several approaches to modelling a transition state will be attempted with a comparison between the structural outcomes / their relative energies. The Chair transition state will be modelled using a [HF 3-12G] method and basis set with minimizing to a TS(Berny). Using a few different methods of allowing control over the optimization by freezing certain co-ordinates. With the second method the Boat will be optimized using the same method and basis set but minimizing to a TS(QST2) method where you model the reactant and the product and it "extrapolates" between the two to make a transition state.
The Chair Transition State
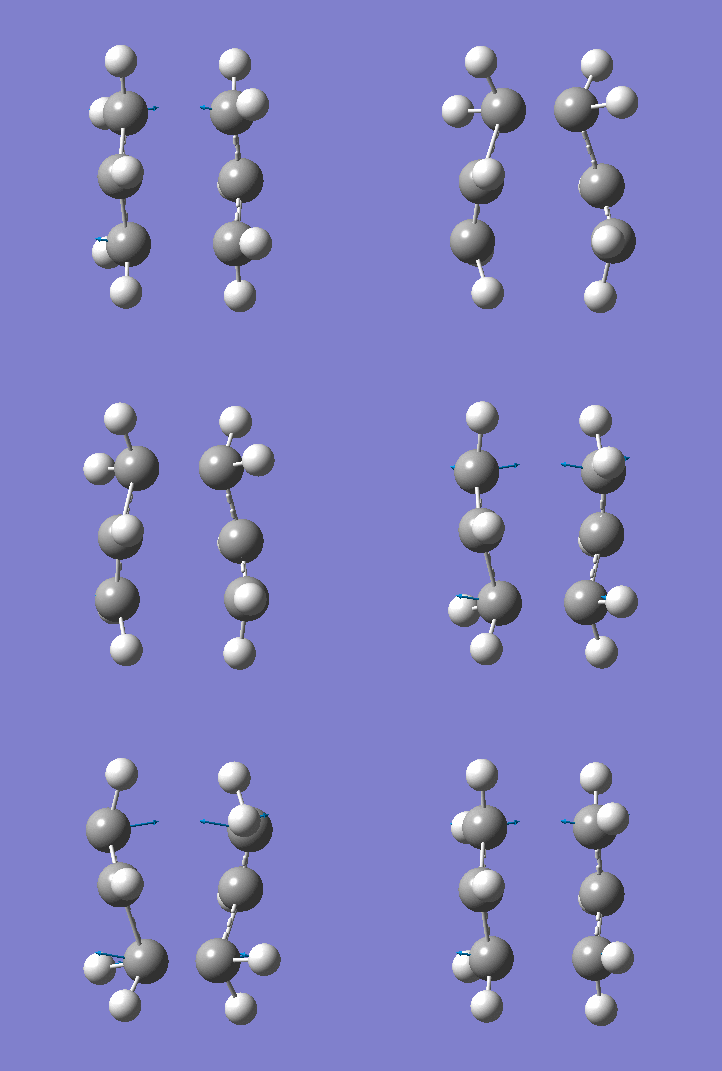
A allyl fragment was optimized using a [HF 3-21G] method and was copied into a new molecule group window twice. The two fragments were orientated to resemble the Chair structure. The terminal carbon distance was set to 2.20Å and the two methods (A) and (B) were run. In A a force constant matrix (Hessian Matrix) was calculated during each optimization iteration and this was used to find where the compound is on the potential energy surface. In B the terminal carbons co-ordinates were frozen and a minimization is run to "relax" the rest of the molecule, this is then re optimized to a TS(Berny) using a derivative of the frozen co-ordinates to calculated the force constant of the essential bond in the transition state. All the key information is provided below:
| Information | Method A | Method B |
|---|---|---|
| Energy (Ha) | -231.61932 | -231.61932 |
| Terminal Carbon Distance (Å) | 2.02 | 2.02 |
| Absorption Frequency (cm-1) | -817.96 | -817.96 |
| Absorption Intensity | 5.8504 | 5.8504 |
| Animation of Vibrational Mode | 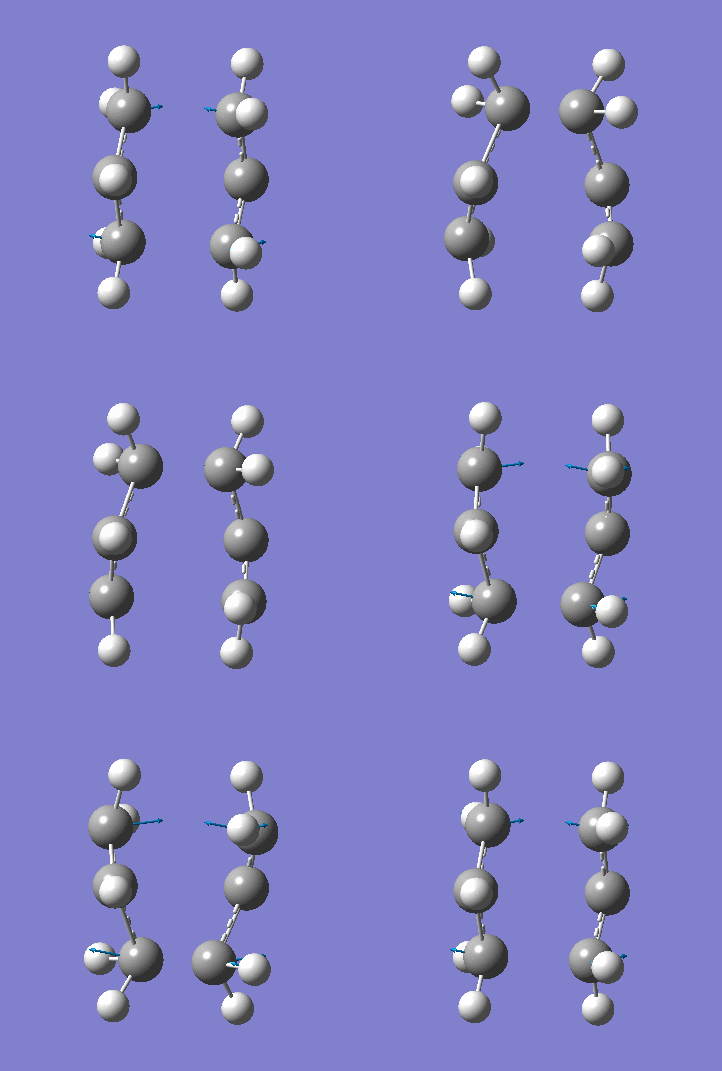 |
|
| Jmol Link | ||
| .LOG File | .LOG | .STEP1LOG .STEP2LOG |
As you can see from the table above both methods give the exact same data. This is due to the fact in this relatively simple transition state my guess of the structure used in method A is quite reliable. Method B bascially breaks up method A into two parts where you make your structure and freeze the atoms you know are involved in the transition state then "clean" the remainder of the structure to a minimum. Stage 2 then optimizes the derivative of the transition state essential bond to find where it is at its maxima and calculated the frequency from there. In method A the initial guess is reliable is optimized and at each iteration the force constant matrix is calculated which is used to predict the PES. The most important thing to get from this comparison is that method A is suitable for simple transition states or ones that you know the structure of but it is a lot more reliable to use method B is you are unsure.
The Boat Transition State
QTS2 Method requires products and reactants separately. The method then extrapolates from one to the other to form an idea of the transition state. The conformers where drawn and the atoms were labelled in the following way sticking to the script of the module 3 wiki page[4]. The optimization was run and the data of interest if tabulated below.
A note be make is the products were drawn in gaussview but the geometries were changed in promote the "finding" of the Boat transition state, without this geometric manipulation the Boat could not be found in the optimization. The labeled original and manipulated products can be seen in the table below also:
| Conformer | Product | Reactant |
|---|---|---|
| Original Geometry |  |
 |
| Modified Geometry |  |
 |
| (N.B.- Pictures taken straight from module 3 wiki pages) | ||
| Boat Transition State Calculated Data | ||
| Energy (Ha) | -231.60280 | |
| Terminal Carbon Distance (Å) | 2.14 | |
| Absorption Frequency (cm-1) | -840.13 | |
| Absorption Intensity | 1.6100 | |
| Jmol Link | ||
| Absorption Animation | 
| |
| .LOG | .LOG | |
The key points of interest for the table are:
- The final energy of -231.60280a.u. which gives a relative energy in comparison to the Chair TS‡ to be +10.366 kcalmol-1 which fits with the literature and general knowledge that Chair is more stable than Boat.
- There is one negative frequency showing that this is in fact a non-minima in energy and actually a maxima with the negative absorption being at -840.13 which when the animation is watched corresponds the the Cope Rearrangement.
- The terminal carbon distance is 2.14Å which is longer than that of the Chair transition state which is 2.02Å which could to why the Boat is a less preferred pathway for the reaction to occur.
IRC Calculations
Calculating FC Once vs. Calculating FC Always
When running a IRC calculation it is possible to calculate force constants once at the beginning of the optimization and "guess" them for the resulting structure which significantly decreases CPU time, However an option to calculate force constants at every iteration in theory would give a lot more accurate results. In this section both methods were run for the Chair Transition state with the data tabulated below:
| Data | Force Constant Calculated Once | Force Constant Calculated Always |
|---|---|---|
| Final Energy (Ha) | -231.686832 | -231.691322 |
| Final RMS Gradient (Ha) | 0.00103902 | 0.00001769 |
| Number of Iterations | 25 | 47 |
| Energy Profile |  |
 |
| Gradient Profile |  |
 |
| Corresponding Conformer | Gauche-2 | Gauche-2 |
| Difference In Energy From Conformer (kcalmol-1) | +3.03 | +0.22 |
| DOI | .LOG | DOI:10042/to-12342 |
In the data seen above it can be seen that calculating force constants always gives a more accurate for the two main reasons of it leads to more iterations and therefore more point of data to map the energy profile but also that the final structure found is a lot closer in energy to the conformer optimized in the first section of this report. This shows for the comparison between Chair and Boat will be made with using the calcall function of calculating force constants always.
Chair vs. Boat IRC Calculations
The optimized structures of Chair and Boat ([HF 3-21G]) were then sent for IRC analysis with the following method:
# irc=(forward,maxpoints=50,calcall) rhf/3-21g geom=connectivity
All output daya is tabulated below:
| Data | Chair Transition State | Boat Transition State |
|---|---|---|
| Final Energy (Ha) | -231.619322 | -231.692637 |
| Final RMS Gradient | 0.00001769 | 0.00004175 |
| Number of Iterations | 47 | 75 |
| Energy Profile |  |
 |
| Gradient Profile |  |
 |
| Corresponding Conformer | Gauche-2 | Gauche-3 |
| Difference In Energy From Conformer (kcalmol-1) | +0.22 | +0.01 |
| Optimized Structure jmol | ||
| DOI | DOI:10042/to-12342 | DOI:10042/to-12341 |
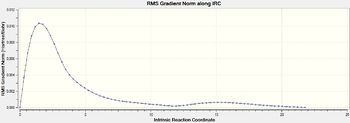
The data shows that both TS‡ follow very similar pathways with the the energy starting at a minima then increasing to a maximum of the transition state and then relax back down to the minima. A further calculation that could be run was the reaction in both directions and then both the IRC calculation plotted on the same graph to give a comparative energy profile. However I believe this not to be necessary due to the fact the IRC should be close to symmetrical going forwards and backwards due to there being no chemical change in the molecule and it is a know fact from the previous optimization that the Boat Transition state is the one with a higher energy Therefore higher energy barrier.
Reaction Thermochemistry
The optmized TS‡ was taken and further optimized using [DFT (6-31G(d)] method and basis set which is a full electron "more accurate" approach, This was then sent for frequency analysis to gain the thermochemistry data for the TS‡. This data is used because it is a more indepth method of calculation and a table with all important points are tabulated below. Also DOI links to the D-Space Repository are provided below:
(Chair: Optimization;DOI:10042/to-12451 Frequency;DOI:10042/to-12453 )/(Boat: Optimization;DOI:10042/to-12452 Frequency;DOI:10042/to-12454 )
| Transition State | Point Group | Sum of Electronic and Zero Point Energies (a.u.) | Sum of Electronic and Thermal Energies (a.u.) | Sum of Electronic and Thermal Enthalpies (a.u.) | Sum of Electronic and Thermal Free Energies (a.u.) | Activation at 298K (kcalmol-1)x | Activation at 0K (kcalmol-1)xx | Literature Activation Energy[5] (kcalmol-1) |
|---|---|---|---|---|---|---|---|---|
| Chair | C2h | -234.414930 | -234.409009 | -234.408065 | -234.443815 | 33.23 | 34.12 | 33.5±0.5 |
| Boat | C2v | -234.398511 | -234.392584 | -234.391640 | -234.427337 | 43.54 | 44.42 | 44.7±2.0 |
xActivation at 298K has been calculated by finding the differences of Sum of Electronic and Thermal Energies of the lowest energy conformer for this method (anti-1) and that of the transition state (-234.461966 a.u.)
xxActivation at 0K has been calculated by finding the differences of Sum of Electronic and Zero-Point Energies of the lowest energy conformer for this method (anti-1) and that of the transition state (-234.469298 a.u.)
From the stable above it can be seen that the activation energies found are very close to that of the literature values which shows in this case this method has been reasonable accurate. Other points of interest is that the Chair has a lower activation energy than the Boat conformer
Conclusion to The Cope Rearrangement
From the investigation it can be said that the methods even though still relatively crude to those currently used in research have given quite accurate results when comparing to literature for the activation energies aswell as confirming the preference of the Chair TS‡ over the Boat TS‡. From the thermochemical data obtained it has also confirmed the reaction does not require a lot of external heat to start the reaction either forwards or backwards and explains why in some cases this rearrangement can cause fluxionality in NMR. It has also highlighted the advantages and disadvantages of certain methods in TS‡ modelling covering quite a few methods. From here the investigation continues onto looking at why certain TS‡ are more stable than others along with MO analysis or certains species.
Diels-Alder Reaction
Introduction
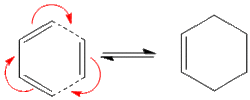
In this particular investigation there will be more modeling of transition states but with a focus on molecular orbital interactions meaning certain TS‡ are favoured over others. In this investigation I will be looking at two Diels-Alder Reactions[6]. Firstly the simplest and probably most famous; the reaction between cis-butadiene and ethene to produce a cyclohexene ring. Secondly the reaction between maleic anhydride and 1,3-cyclohexadiene where the endo selection rule[7] is seen in full effect. The endo-selection rule is seen throughout many diels alder reactions. Due to the stability of the products made in most diels-alder reactions it usually follows a kinetic pathway which means it goes via the lowest energy TS, Which in a lot of cases is the endo[8]. This is due to stabilizing frontier orbital interactions and that is the main focus in the project.
cis-butadiene with ethene
In this particular reaction there is no case of endo or exo selection due to the simplicity of the reaction, In this investigation there will be a TS‡ will be modelled with the HOMO and the LUMO being presented in this report with discussion on what they mean and how the reaction works.
cis-butadiene
cis-butadiene was optimized initially with the semi empirical method AM1 with the data tabulated below:
| Energy (Ha) | 0.04879720 | RMS Gradient (Ha) | 0.00004491 |
| HOMO |  |
LUMO | 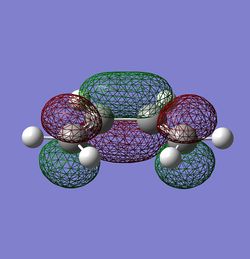 |
| HOMO Symmetry | a | LUMO Symmetry | s |
| C-C Bond Length (Å) | 1.450 | C=C Bond Length (Å) | 1.335 |
| Lit[9] C-C Bond Length (Å) | 1.470 | Lit[9] C=C Bond Length (Å) | 1.340 |
| Jmol Link | .LOG File | .LOG. |
This data shows nothing of real interest but will be used in a comparison in the TS‡ modelling in the next section:
Transition State Modeling
The transition state was optimized by both AM1 and DFT ([DFT 6-31G(d)]) and the data is tabulated below:
| Data | AM1 | DFT |
|---|---|---|
| Energy (Ha) | 0.111655 | -234.54389 |
| RMS Grad (Ha) | 0.000031 | 0.00000041 |
| HOMO |  |
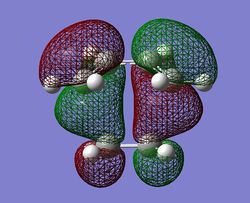 |
| LUMO | 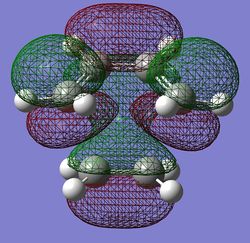 |
 |
| C-C Bond Length is butadiene fragment Å | 1.40 | 1.41 |
| C=C Bond Length is butadiene fragment Å | 1.38 | 1.38 |
| Terminal Carbon Distance Å | 2.12 | 2.27 |
| Negative Absorption Frequency (cm-1) | -955.80 | -524.99 |
| Negative Absorption Intensity | 5.6245 | 5.7947 |
| Jmol | ||
| DOI/.LOG | .LOG | DOI:10042/to-12515 |
The main points of interest from the table above are the following:
- The C-C bond lengths decrease from the stand alone cis-butadiene which shows the process of becoming the shorter stronger C=C bond length (difference of -0.05Å)
- In the same way the C=C bond length has increases showing that the C=C bond have started there transformation into the C-C bond ins the final product (difference of -0.45Å)
- This change in bond length occurs in both methods and comparing between the two there are two major points to make:
- The Terminal C-C bond length has increased in the DFT method by 0.15Å.
- The imaginary frequency has changed drastically between the two methods.
- The reason between these values is because when estimating the PES there are differences in energy and geometry, these meant the gradient around the maxima which is the TS‡ is different. The frequency relies on the second derivative of the curve and if the gradient is different around this maxima it will have a large effect on the frequency. This is the real reason why you cannot compare energies of methods and imaginary frequencies.
- However looking at the animation of the imaginary frequency (seen by clicking the link in the table) it shows the bond formation/breaking is synchronous which is to be expected from the pericylic diels-alder reaction where one of the definitions is that the whole process is concerted.
- Ψ(TS‡, HOMO)= Ψ(cis-butadiene, HOMO)+ Ψ(ethene, LUMO)
- Ψ(TS‡, LUMO)= Ψ(cis-butadiene, LUMO)+ Ψ(ethene, HOMO)
- The reaction is allowed because you have the HOMO of the cis-butadiene mixing with the LUMO of the ethylene (π* orbital) which are both anti-symmetric which go to form the anti-symmetric HOMO of the TS‡.
- The HOMO is made up of the π-orbital of the cis-butadiene combining witht the π* orbital of ethene which corresponds to the π-bond breaking in the cis-butadiene and ethylene to form new sigma bonds.
1-3-Cyclohexadiene Reaction with Maleic Anhydride
Overview

In this particular reaction there is a case of endo vs. exo In this investigation I will be comparing different methods of optimization as well as a full MO comparison between isomers and methods highlighting key interactions. After this I will attempt to create a energy profile for the reaction using more advanced IRC calculations compared to ones seen earlier in the report and use these to explain the endo selection rule with the stabilites of the TS‡ and the Products.
endo vs. exo Optimizations
The first step in this experiment is to optimize the endo and exo to there respective TS‡ and compare the two methods as well as the two isomers. All data is tabulated below:
| Data | Exo | Endo | ||
| Method | AM1 | DFT | AM1 | DFT |
|---|---|---|---|---|
| Energy (Ha) | -0.050420 | -612.679310 | -0.051504 | -612.683397 |
| Reactive Carbon Distance Å | 2.17 | 2.29 | 2.16 | 2.27 |
| Negative Absorption Frequency (cm-1) | -812.38 | -448.50 | -806.37 | -446.96 |
| Negative Absorption Intensity | 96.8772 | 5.5115 | 71.5669 | 1.4432 |
| Jmol | ||||
| DOI/.LOG | .LOG | DOI:10042/to-12464 | N/Ax | DOI:10042/to-12463 |
x .LOG file too big to upload will provide under request.
From the data it can be seen:
- The endo TS‡ is more stable than the exo showing this would be the preferred kinetic pathway.
- The frequencies/terminal carbon bond lengths change between methods but between isomers these values are very similar.
- A discussion of stability caused by molecular orbitals will be seen in the next section.
endo vs. exo Molecular Orbital Diagrams
The Molecular Orbitals were visualized using both HF and DFT methods, will a comparison between isomers for each below:
AM1 Calculated MOs
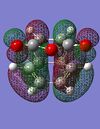
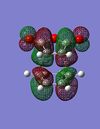
| Transition State | LUMO+2 | LUMO+1 | LUMO | HOMO | HOMO-1 | Exo-Energy Profile | Endo-Energy Profile |
|---|---|---|---|---|---|---|---|
| Endo-Transition State |  |
 |
 |
 |
 |
 |
 |
| Exo-Transition State |  |
 |
 |
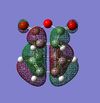 |
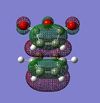 |
Between the two isomers the following points should be noted:
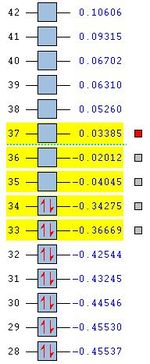
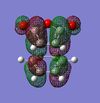
- The Ψ(endo, LUMO+1)=Ψ(Maleic Anhydride, HOMO)+Ψ(1-3,Cylcohexadiene, LUMO) is the major secondary orbital interaction which is usually stated as the reasons for the endo TS‡ however it is seen to be in the LUMO+1. This would indicate it would not have a large effect. It is also seen in the exo to a lesser extent due to increased distance between the two MO's mixing.
- There are two possibilities for this MO to be higher in energy than expected, One is based on the fact that in this particular method the MO's are just in the wrong order and it is in fact lower in energy than the LUMO/HOMO and it is the major stabilizing effect seen in the experimental and could be altered using a different method.
- The second idea is slightly more strange, I have the hypothesis that when looking at the secondary orbital overlap it can been sent he the MO is heavily weighted to one side of the molecule in the endo, this would imply that in theory it could be stabilized by a polar solvent (a common solvent for Diels-Alder reactions) therefore a polar solvent could lower this energies orbital to become a occupied one and it causes the stability seen. All the calculation run in this project have been run in the gas phase to reduce CPU time / not have the error of a poor solvent model. A further investigation could be to run the optimizations again in a polar solvent and see if it has an effect on the MO's energies.
- However for this particular method the endo is still preffered therefore it can be said that there are other factors dominating the stability between the two TS‡ such as additional splitting or sterics Full NBO analysis could be run to find this out. A full steric effect showing favor towards the endo product can be seen in my first Module 1 showing that in that case it was Torsion around the C=C bonds deciding the stability.
- The Final point to make is that the HOMO in both the exo and the endo correspond the the making of the new sigma bonds formed in the reaction which shows the reaction is going as expected and is symmetrically allowed (Ψ(endo, HOMO) = Ψ(Maleic Anhydride, LUMO) + Ψ(1,3-Cyclohexadiene, HOMO) which are both anti-symmetric)
6-31G(d) Calculated MOs
| Transition State | LUMO+2 | LUMO+1 | LUMO | HOMO | HOMO-1 |
|---|---|---|---|---|---|
| Endo-Transition State |  |
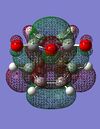 |
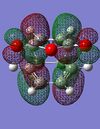 |
 |
 |
| Exo-Transition State | 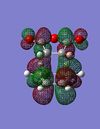 |
 |
 |
 |
 |
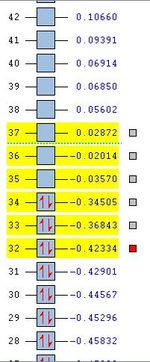
The comparison between basis sets show no real difference in shape between MO's. The only thing of interest to mention is that some of the degnerate MO's swap in order in the basis set. This could be due to many factors but would have no real effect on the overall energies of the two isomers. (example of HOMO/HOMO-1 in the exo TS‡) This is another example of the fact that you cannot compare ENERGIES between methods and basis sets however there is little difference in structure and in this case molecular orbitals.
Energy Profile
IRC was run for both the endo and exo transistion states at 100 iterations, force constants calculated always under semi empirical AM1 with the following method:
# irc=(maxpoints=100,calcall) ram1 geom=connectivity
The Data with excel diagram showing both energy diagrams on one graph (made in Excel) is shown below is presented below:
| Data | Endo | Exo | Final Energy Pathway Diagram |
|---|---|---|---|
| Final Energy (Ha) | -0.094720 | -0.095779 | 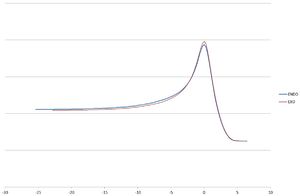 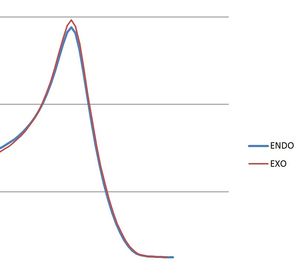 |
| Optimized DFT Final Energy (Ha) | -613.99109069 | -613.99109076 | |
| Final RMS Gradient (Ha) | 0.00005 | 0.00001769 | |
| Number of Iterations | 124 | 110 | |
| Energy Profile |  |
 | |
| Gradient Profile |  |
 | |
| Pathway Animation | 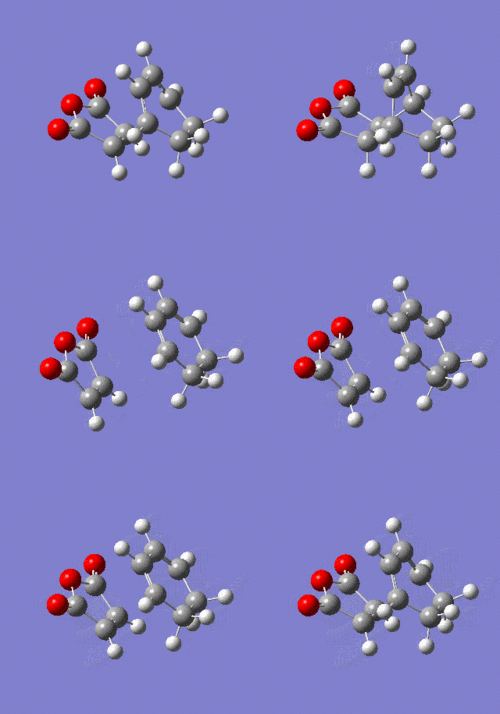 |
 | |
| Activation Energy (kcalmol-1) | 21.12 | 28.46 | |
| DOI | DOI:10042/to-12494 | DOI:10042/to-12495 |
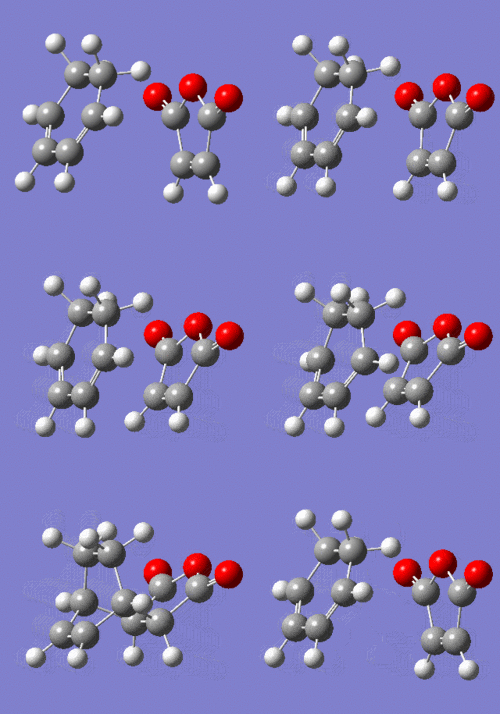
From the IRC calculations it can be seen both reactions go via a very similar pathway seen by the animations with the only difference being seen int he excel graph with both pathways plotted with the endo being slightly lower in energy than that of the exo ≈10kcalmol-1. Therefore again confirming the endo would be preferred if the reaction ran via a kinetic pathway. However a slightly unexpected result is that of the products. The two final energies of the IRC calculations are only different by 0.6kcalmol-1 favouring the exo.This was confirmed by a separate [DFT 6-31G(d)] optimization of the products (endo:DOI:10042/to-12513 , exo:DOI:10042/to-12514 ) which gave the energies also noted in the table with a difference of 0.00004kcalmol-1 This shows that even under thermodynamic control both products would form a nearly equal mixture of both products.
Other Points of Interest Include:
- Activations for the endo and the exo pathway differs by 7.34 kcalmol-1 favouring the endo product.
- The gradient of the IRC calculations drops to zero confirming it is defiantly a maxima in energy.
Discussion of Diels-Alder Reaction
During this investigation the visualisation of MO's has confirmed several pieces of information seen from the experimental / theory, including the bond formation of the two new two σ-bonds is synchronous and the reaction is symmetry allowed. Other pieces of data for maleic anhydride is obtained is the confirmation of the endo TS‡ preferred over the exo even though this particular modelling shows its not due to secondary overlap which is believed to be the cause, however further modelling may change the results. And finally the calculation showing the exo/endo products are equal in energy which is not the usual scenario where the exo is seen as the thermodynamic product in many cases of diels-alder reactions. However further investigation into solvent effects on the products could change this as it may be a case that one products is more stable than the other in a polar environment which is the the biggest factor neglected from all the calculations in this module. However if solvent was taken into account it would not be 100% reliable and CPU time on all calculations would increase drastically. However overall a good understanding has been found in modelling transition states aswell as some very reliable data obtaining giving a key insight into some overlooking very important reactions.
Please note I did attempt a mini-project of the experiment of Cyclopentadiene Dimerisation seen in Module 1 However with time constraints and trouble optimising to a TS(Berny) I was not possible to gain any usable data.
References
- ↑ Arthur C. Cope; et al.; w:J. Am. Chem. Soc. 1940, 62, 441.
- ↑ Rhoads, S. J.; Raulins, N. R.; Org. React. 1975, 22, 1-252. (Review)
- ↑ Henry Rzepa's Second Year Lecture Course On Conformational Analysis: http://www.ch.ic.ac.uk/local/organic/conf/c1_alkanes.html
- ↑ 3rd Year Computational Course Module 3 Wiki Page: https://wiki.ch.ic.ac.uk/wiki/index.php?title=Mod:phys3
- ↑ K. N. Houk, Susan M. Gustafson, Kersey A. Black Theoretical secondary kinetic isotope effects and the interpretation of transition state geometries. 1. The Cope rearrangement J. Am. Chem. Soc.1992 (22) pp 8565–8572
- ↑ Synthesis in the hydroaromatic series, IV. Announcement: The rearrangement of malein acid anhydride on arylated diene, triene and fulvene, Diels, O.; Alder, K. Ber. 1929, 62, 2081 & 2087.
- ↑ Baldwin, J. E., "Cycloadditions. IX. Mechanism of the Thermal Interconversion of exo- and endo-Dicyclopentadiene", J. Org. Chem., 1966, 31(8), pp. 2441-44, DOI: 10.1021/jo01346a003
- ↑ Clayden, J., Greeves, N., Warren, S., Wothers, P., "Organic Chemistry", 2001
- ↑ 9.0 9.1 Fox, M.A. Whitesell, J.K. Organische Chemie: Grundlagen, Mechanismen, Bioorganische Anwendungen (1995)
