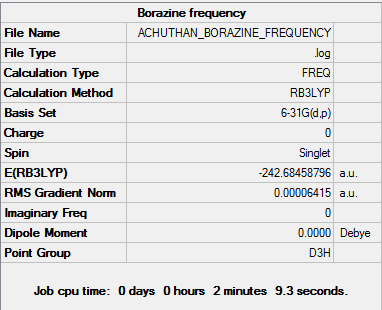
Rep:Mod:ismellcookies
Module 2: Bonding analyses using Ab initio and Density functional techniques.
BH3 Optimisation using the B3LYP, 3-21G Method
The BH3 was created using Gaussview 3.0.
This is the optimisation file of BH3: Media:BH3 OPT.LOG
Optimised bond length: 1.19543 Å Optimised bond angle: 120.000°
| File type | .log |
|---|---|
| Calculation Type | FOPT |
| Calculation Method | RB3LYP |
| Basis Set | (3-21G) |
| Final Energy | -26.4622633 a.u. |
| Gradient | 0.00004507 a.u. |
| Dipole Moment | 0.0000 Debye |
| Point Group | D3H |
| Calculation Time | 22.0 s |
    Item               Value     Threshold  Converged?
 Maximum Force            0.000090     0.000450     YES
 RMS     Force            0.000059     0.000300     YES
 Maximum Displacement     0.000352     0.001800     YES
 RMS     Displacement     0.000230     0.001200     YES
 Predicted change in Energy=-4.580970D-08
 Optimization completed.
    -- Stationary point found.
                           ----------------------------
                           !   Optimized Parameters   !
                           ! (Angstroms and Degrees)  !
 --------------------------                            --------------------------
 ! Name  Definition              Value          Derivative Info.                !
 --------------------------------------------------------------------------------
 ! R1    R(1,2)                  1.1945         -DE/DX =   -0.0001              !
 ! R2    R(1,3)                  1.1945         -DE/DX =   -0.0001              !
 ! R3    R(1,4)                  1.1945         -DE/DX =   -0.0001              !
 ! A1    A(2,1,3)              120.0            -DE/DX =    0.0                 !
 ! A2    A(2,1,4)              120.0            -DE/DX =    0.0                 !
 ! A3    A(3,1,4)              120.0            -DE/DX =    0.0                 !
 ! D1    D(2,1,4,3)            180.0            -DE/DX =    0.0                 !
 --------------------------------------------------------------------------------
 GradGradGradGradGradGradGradGradGradGradGradGradGradGradGradGradGradGrad
BH3 Optimisation using the B3LYP, 6-31G Method
This is the optimisation file of BH3: Media:BH3_OPT_631G_DP.LOG
| File type | .log |
|---|---|
| Calculation Type | FOPT |
| Calculation Method | RB3LYP |
| Basis Set | (6-31G(d,p)) |
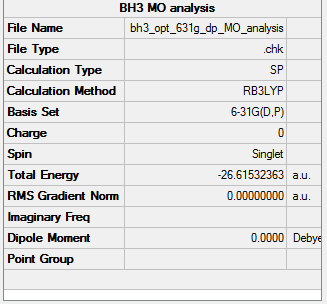
| Final Energy | -26.61532363 a.u. |
| Gradient | 0.00000475 a.u. |
| Dipole Moment | 0.0000 Debye |
| Point Group | D3H |
| Calculation Time | 39.0 s |
 Item               Value     Threshold  Converged?
 Maximum Force            0.000009     0.000450     YES
 RMS     Force            0.000006     0.000300     YES
 Maximum Displacement     0.000038     0.001800     YES
 RMS     Displacement     0.000025     0.001200     YES
 Predicted change in Energy=-5.342736D-10
 Optimization completed.
    -- Stationary point found.
                           ----------------------------
                           !   Optimized Parameters   !
                           ! (Angstroms and Degrees)  !
 --------------------------                            --------------------------
 ! Name  Definition              Value          Derivative Info.                !
 --------------------------------------------------------------------------------
 ! R1    R(1,2)                  1.1923         -DE/DX =    0.0                 !
 ! R2    R(1,3)                  1.1923         -DE/DX =    0.0                 !
 ! R3    R(1,4)                  1.1923         -DE/DX =    0.0                 !
 ! A1    A(2,1,3)              120.0            -DE/DX =    0.0                 !
 ! A2    A(2,1,4)              120.0            -DE/DX =    0.0                 !
 ! A3    A(3,1,4)              120.0            -DE/DX =    0.0                 !
 ! D1    D(2,1,4,3)            180.0            -DE/DX =    0.0                 !
 --------------------------------------------------------------------------------
 GradGradGradGradGradGradGradGradGradGradGradGradGradGradGradGradGradGrad
Optimised bond length: 1.19231 Å Optimised bond angle: 120.000°
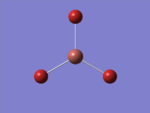
Optimisation of TlBr3
The optimisation can be found here [1].
| File type | .log |
|---|---|
| Calculation Type | FOPT |
| Calculation Method | RB3LYP |
| Basis Set | LANL2DZ |
| Final Energy | -91.21812851 a.u. |
| Gradient | 0.00000090 a.u. |
| Dipole Moment | 0.0000 Debye |
| Point Group | D3H |
| Calculation Time | 1min 16.0 s |
 Item               Value     Threshold  Converged?
 Maximum Force            0.000002     0.000450     YES
 RMS     Force            0.000001     0.000300     YES
 Maximum Displacement     0.000022     0.001800     YES
 RMS     Displacement     0.000014     0.001200     YES
 Predicted change in Energy=-6.084107D-11
 Optimization completed.
    -- Stationary point found.
                           ----------------------------
                           !   Optimized Parameters   !
                           ! (Angstroms and Degrees)  !
 --------------------------                            --------------------------
 ! Name  Definition              Value          Derivative Info.                !
 --------------------------------------------------------------------------------
 ! R1    R(1,2)                  2.651          -DE/DX =    0.0                 !
 ! R2    R(1,3)                  2.651          -DE/DX =    0.0                 !
 ! R3    R(1,4)                  2.651          -DE/DX =    0.0                 !
 ! A1    A(2,1,3)              120.0            -DE/DX =    0.0                 !
 ! A2    A(2,1,4)              120.0            -DE/DX =    0.0                 !
 ! A3    A(3,1,4)              120.0            -DE/DX =    0.0                 !
 ! D1    D(2,1,4,3)            180.0            -DE/DX =    0.0                 !
 --------------------------------------------------------------------------------
 GradGradGradGradGradGradGradGradGradGradGradGradGradGradGradGradGradGrad
Optimised bond length: 2.65095 Å
Optimised bond angle: 120.000 °
The literature value for the Tl-Br bond length of 2.512Å [2] is fairly close to that calculated bond length.
Optimisation of BBr3 using 'B3LYP, GEN'
This is the optimisation file of BBr3: Media:BBR3_OPT_631G_DP.LOG
| File type | .log |
|---|---|
| Calculation Type | FOPT |
| Calculation Method | RB3LYP |
| Basis Set | GEN |
| Final Energy | -64.43645296 a.u. |
| Gradient | 0.00000382 a.u. |
| Dipole Moment | 0.0000 Debye |
| Point Group | D3H |
| Calculation Time | 45.0 s |
Item               Value     Threshold  Converged?
 Maximum Force            0.000008     0.000450     YES
 RMS     Force            0.000005     0.000300     YES
 Maximum Displacement     0.000036     0.001800     YES
 RMS     Displacement     0.000023     0.001200     YES
 Predicted change in Energy=-4.027253D-10
 Optimization completed.
    -- Stationary point found.
                           ----------------------------
                           !   Optimized Parameters   !
                           ! (Angstroms and Degrees)  !
 --------------------------                            --------------------------
 ! Name  Definition              Value          Derivative Info.                !
 --------------------------------------------------------------------------------
 ! R1    R(1,2)                  1.934          -DE/DX =    0.0                 !
 ! R2    R(1,3)                  1.934          -DE/DX =    0.0                 !
 ! R3    R(1,4)                  1.934          -DE/DX =    0.0                 !
 ! A1    A(2,1,3)              120.0            -DE/DX =    0.0                 !
 ! A2    A(2,1,4)              120.0            -DE/DX =    0.0                 !
 ! A3    A(3,1,4)              120.0            -DE/DX =    0.0                 !
 ! D1    D(2,1,4,3)            180.0            -DE/DX =    0.0                 !
 --------------------------------------------------------------------------------
 GradGradGradGradGradGradGradGradGradGradGradGradGradGradGradGradGradGrad
Optimised bond length: 1.93396 Å Optimised bond angle: 120.000°
Comparing BH3, TlBr3 and BBr3
| Molecule | Bond Distance (a.u.) |
|---|---|
| BH3 | 1.19231 |
| TlBr3 | 2.65095 |
| BBr3 | 1.93396 |
BH3 frequency analysis
[File:BH3 frequency.PNG|150px|]
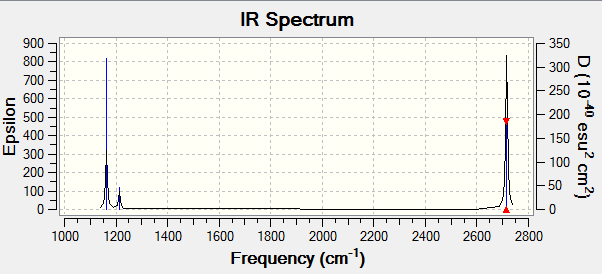
This is the frequency analysis file of BH3: Media:ACHUTHAN BH3 FREQ.LOG
Low frequencies ---   -3.5991   -1.1355   -0.0055    1.3745    9.7046    9.7707
 Low frequencies --- 1162.9825 1213.1733 1213.1760
Vibrational Analysis
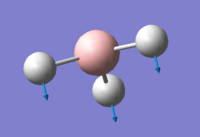
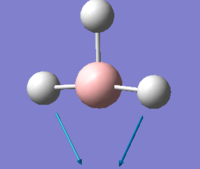
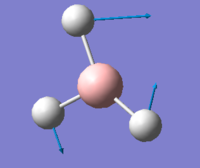
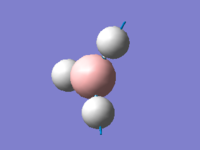
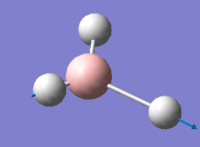
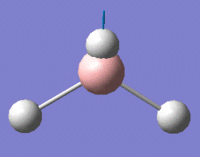
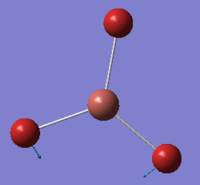
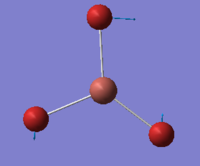
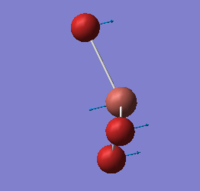
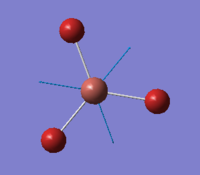
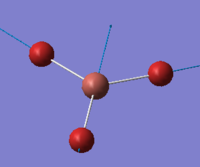
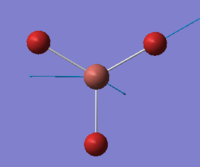
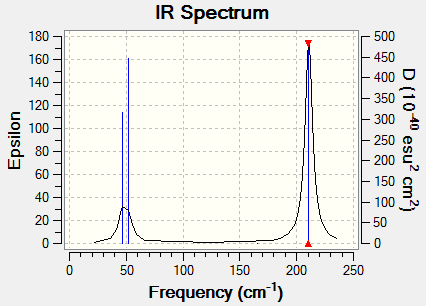
There are only three peaks eventhough there are 6 vibrational modes. Vibrational mode 4 will not appear on the spectrum because it has an ifrared intensity of 0 and because its stretches are symmetric, it does not cause a change in dipole moment. Vibrational modes 2 and 3 as well as 5 and 6 are degenerate and therefore have the same wavenumber. All in all this causes three peaks in the spectra.
TlBr3 frequency analysis
The frequency analysis of TlBr3 can be found here:[3]
Low frequencies ---   -3.4213   -0.0026   -0.0004    0.0015    3.9367    3.9367
 Low frequencies ---   46.4289   46.4292   52.1449
The lowest 'real' normal mode is 46.4289 cm-1.
Vibrational Analysis
Comparing the Vibrational Frequencies of TlBr3 and BH3
| Vibrational Mode | BH3 Frequency (cm-1) | TlBr3 Frequency (cm-1) |
|---|---|---|
| 1 | 1162.98 | 46.43 |
| 2 | 1213.17 | 46.43 |
| 3 | 1213.18 | 52.14 |
| 4 | 2582.32 | 165.27 |
| 5 | 2715.50 | 210.69 |
| 6 | 2715.50 | 210.69 |
Looking at the equation:
where k is the spring constant for the bond, c is the speed of light, and μ is the reduced mass, the different bond frequencies can be explained.
BH3 vibrational frequencies are much larger than that of TlBr3. This is because Tl and Br are heavier atoms than B and H. Tl and Br have atomic masses of 204.38 and 79.904 while B and H have atomic masses of 10.81 and 1.008. Therefore the reduced mass is more for TlBr3 than BH3. The B-H bond is stronger than the Tl-Br bond because its orbitals are smaller and so experience better overlap.
On both spectra only three peaks are found. Both spectra have two pairs of degenerate E' vibrational modes, one A2" vibrational mode and one infrared inactive A1' vibrational mode. The A2" and E' vibrational modes lie close to each other while the A1' and E vibrational modes lie close to each other. The A1' and E vibrational modes are stretching modes while the A2" and E' vibrational modes are bending modes. This is why the A1' and E vibrational modes are higher in energy.
The same method and basis set is used for both the optimisation and frequency analysis calculations beacause the total energy is dependent which basis set is used and its quality. The same basis set must be used on each molecule to compare the energies of BH3 and TlBr3
A frequency analysis is undertaken to find the minimum structure on a PES. It will also yield the frequencies of vibration in spectra which can be compared to experimental values.
The "low frequencies" show the “-6” vibrations of the “3N-6” vibrations of a molecule with N atoms. "Low frequencies" have displacement vectors. This has an effect on the molecules centre of mass.
Population Analysis
Molecular orbitals of BH3
The d-space file is located here [[4]].
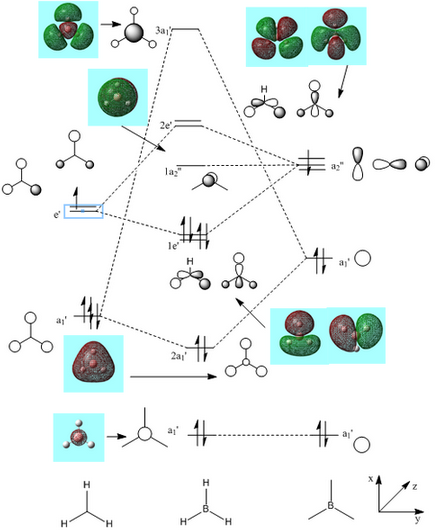
Using the LCAO method an MO diagram of BH3 was created.
It can be seen from Figure 10 that the actual MOs are not too dissimilar than the LCAO MOs. This therefore shows how qualitative MO theory is an effective tool in modelling the framework of molecules.
Population Analysis
NH3 practice
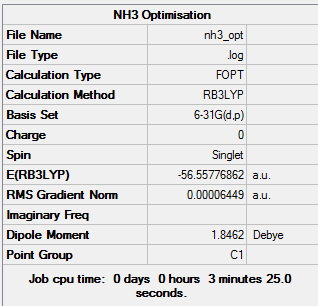
Optimisation
The log file can be found here Media:NH3 OPT.LOG
 Item               Value     Threshold  Converged?
 Maximum Force            0.000130     0.000450     YES
 RMS     Force            0.000071     0.000300     YES
 Maximum Displacement     0.000260     0.001800     YES
 RMS     Displacement     0.000153     0.001200     YES
 Predicted change in Energy=-3.769556D-08
 Optimization completed.
    -- Stationary point found.
                           ----------------------------
                           !   Optimized Parameters   !
                           ! (Angstroms and Degrees)  !
 --------------------------                            --------------------------
 ! Name  Definition              Value          Derivative Info.                !
 --------------------------------------------------------------------------------
 ! R1    R(1,2)                  1.0181         -DE/DX =   -0.0001              !
 ! R2    R(1,3)                  1.0181         -DE/DX =   -0.0001              !
 ! R3    R(1,4)                  1.018          -DE/DX =    0.0                 !
 ! A1    A(2,1,3)              105.7418         -DE/DX =    0.0                 !
 ! A2    A(2,1,4)              105.7562         -DE/DX =    0.0                 !
 ! A3    A(3,1,4)              105.751          -DE/DX =    0.0                 !
 ! D1    D(2,1,4,3)           -111.8681         -DE/DX =    0.0                 !
 --------------------------------------------------------------------------------
 GradGradGradGradGradGradGradGradGradGradGradGradGradGradGradGradGradGrad
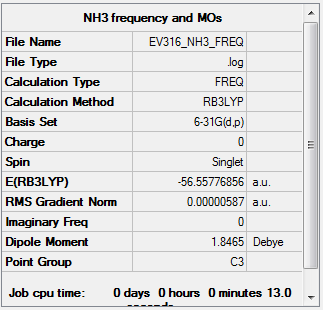
Frequency Analysis
The log file can be found here: Media: NH3 FREQUENCY.LOG
Item               Value     Threshold  Converged?
 Maximum Force            0.000125     0.000450     YES
 RMS     Force            0.000064     0.000300     YES
 Maximum Displacement     0.000276     0.001800     YES
 RMS     Displacement     0.000134     0.001200     YES
 Predicted change in Energy=-4.135900D-08
 Optimization completed.
    -- Stationary point found.
 GradGradGradGradGradGradGradGradGradGradGradGradGradGradGradGradGradGrad
Low frequencies ---   -0.0017   -0.0012   -0.0008   23.2093   36.9077   47.9558
 Low frequencies --- 1089.8968 1694.2037 1694.3978
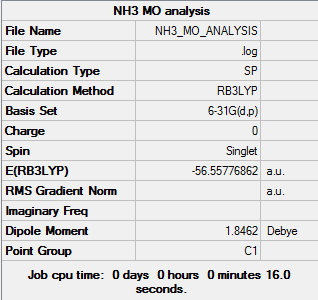
Population Analysis
The log file can be found here:Media:NH3 MO ANALYSIS.LOG
NBO Analysis of NH3
The charge range was between -1.000 and 1.000. The charges were +0.375 for each H atom and -1.125 for the central N atom.
NH3BH3 Analysis
Optimisation
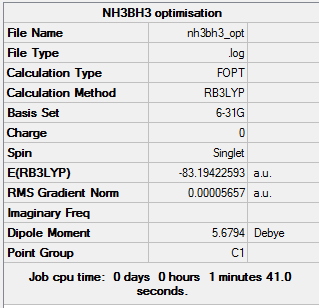
The 6-31G, (d,p) basis set method was used with a DFT method and B3LYP hybrid functional.
The log file can be found here: Media: NH3BH3 OPT.LOG
The summary of optimisation can be found below:
Item               Value     Threshold  Converged?
 Maximum Force            0.057274     0.000450     NO
 RMS     Force            0.028114     0.000300     NO
 Maximum Displacement     0.118182     0.001800     NO
 RMS     Displacement     0.060195     0.001200     NO
 Predicted change in Energy=-3.045369D-02
 GradGradGradGradGradGradGradGradGradGradGradGradGradGradGradGradGradGrad
Frequency Analysis
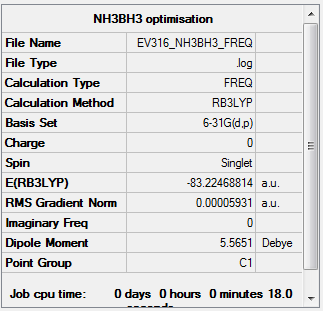
Frequency analysis was carried out using the previously optimised structure (DFT, B3LYP, 6-31G (d,p)).
The log file can be found here: Media:NH3BH3 FREQUENCY.LOG
The summary of frequency analysis can be found below:
 Item               Value     Threshold  Converged?
 Maximum Force            0.000108     0.000450     YES
 RMS     Force            0.000057     0.000300     YES
 Maximum Displacement     0.000652     0.001800     YES
 RMS     Displacement     0.000382     0.001200     YES
 Predicted change in Energy=-1.913035D-07
 Optimization completed.
    -- Stationary point found.
 GradGradGradGradGradGradGradGradGradGradGradGradGradGradGradGradGradGrad
 Low frequencies ---   -0.0009   -0.0009    0.0010   18.1359   22.7036   46.7725
 Low frequencies ---  257.9971  632.0303  668.0959
Association and dissociation energies
E(NH3)= -55.55776862a.u.
E(BH3)= -26.61532363a.u.
E(NH3BH3)= -83.19422593 a.u.
The dissociation energy of NH3BH3 is the difference between the energy of NH3BH3 and the energy of NH3 and BH3 added together.
ΔE = (-83.19422593)-[(-56.55776862)+(-26.61532363)]
ΔE = (-83.19422593)-(-83.17309225)
ΔE = -0.02113368 a.u.
Edissoc = -55.5 kJ/mol-1
Mini-project- Aromaticity
Benzene
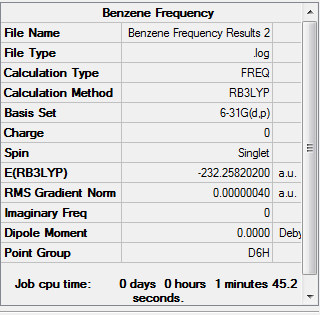
Optimisation
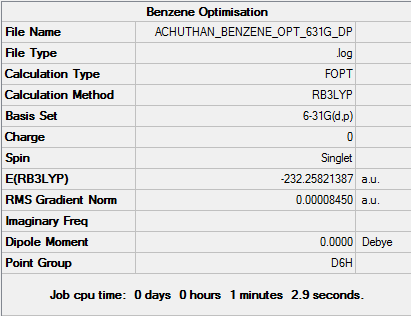
The d-space file can be found here [5].
The 6-31G (d,p) method was used with a DFT method and the B3LYP hybrid functional. The Symmetrize function was used before the optimisation ,so that the correct symmetry,D6h, was obtained instead of the incorrect C1 symmetry.
A summary of the optimisation can be found below:
Item               Value     Threshold  Converged?
 Maximum Force            0.000199     0.000450     YES
 RMS     Force            0.000081     0.000300     YES
 Maximum Displacement     0.000847     0.001800     YES
 RMS     Displacement     0.000299     0.001200     YES
 Predicted change in Energy=-4.636845D-07
 Optimization completed.
    -- Stationary point found.
Optimised C-C Bond Length: 1.39619 Å Optimised C-H Bond Length: 1.08606 Å
These bond lengths are verified by [6].
Frequency Analysis
The d-space file can be found here[7].
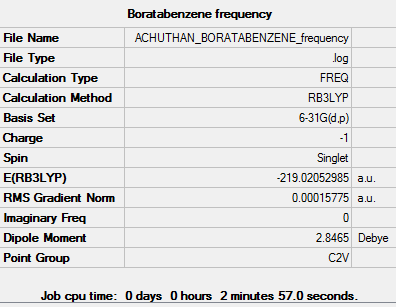
A frequency analysis was performed on the optimised boratobenzene molecule. A summary of the frequency analysis can be found below:
 Item               Value     Threshold  Converged?
 Maximum Force            0.000199     0.000450     YES
 RMS     Force            0.000085     0.000300     YES
 Maximum Displacement     0.000806     0.001800     YES
 RMS     Displacement     0.000346     0.001200     YES
 Predicted change in Energy=-4.349367D-07
 Optimization completed.
    -- Stationary point found.
 Low frequencies ---   -4.6046   -4.6046   -0.0088   -0.0043   -0.0042    9.6590
 Low frequencies ---  413.9386  413.9386  621.1428
MO and NBO Analysis
Population Analysis
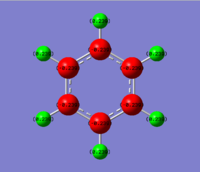
The energy calculation for benzene used the basis set 6-31G(d,p) method with defined full nbos and a full population analysis. The d-space file can be found here [8].
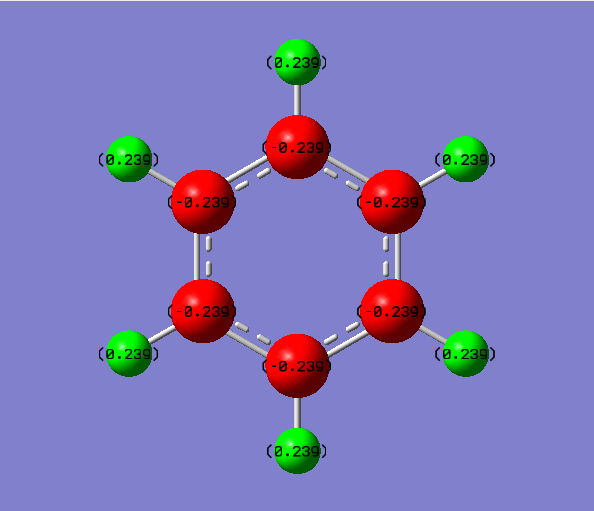
The NBO Charge distribution was found and was between -0.084 and 0.084.
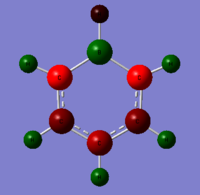
The charge distribution across the molecule is even as there are no electron withdrawing or donating atoms to vary the charges across the molecule. The hydrogens possess a positive charge density while the carbons possess a negative charge density value. The total charge density across the molecule is zero.
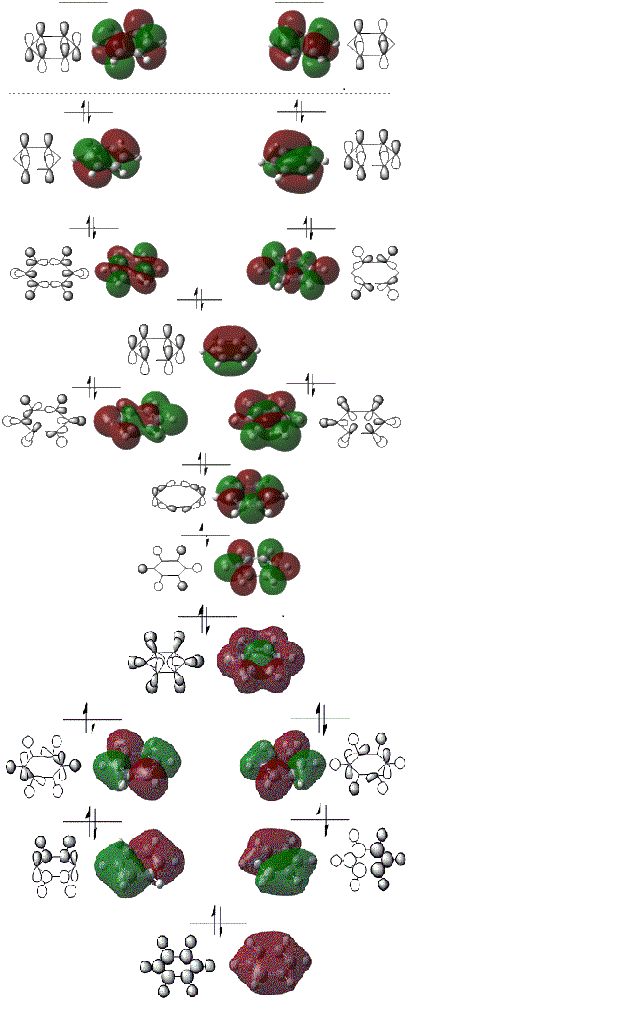
MO Diagram for Benzene
How do these MOs relate to the common conception of aromaticity?
Aromaticity is when a cyclic molecule has a conjugated system of 4n+2 valence electrons. This in turn makes the molecule more stable. Benzene has 6 valence electrons. The pi orbitals which run above and below the molecule only contribute to the aromaticity as these orbitals contribute an electron for each carbon in the delocalised system shown by the MO diagram above.
Boratabenzene
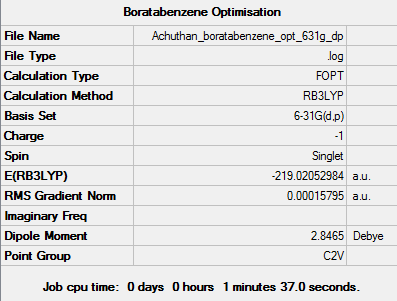
Optimisation
The d-space file can be found here [9].
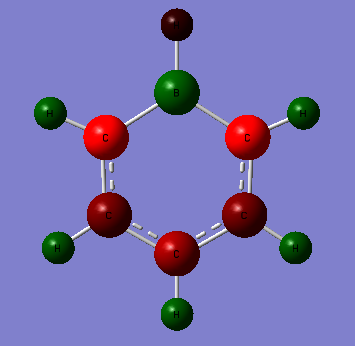
The 6-31G (d,p) method was used with a DFT method and the B3LYP hybrid functional. The Symmetrize function was again used before the optimisation ,so that the correct symmetry,C2v, was obtained.
A summary of the optimisation can be found below:
Item               Value     Threshold  Converged?
 Maximum Force            0.000157     0.000450     YES
 RMS     Force            0.000069     0.000300     YES
 Maximum Displacement     0.000912     0.001800     YES
 RMS     Displacement     0.000324     0.001200     YES
 Predicted change in Energy=-6.565579D-07
 Optimization completed.
    -- Stationary point found.
Optimised Bond lengths
C-B 1.51378 Å (α)C –(β)C 1.39888 Å (β)C –(γ)C 1.40530 Å
These values are verified by [1].
Frequency Analysis
The d-space file can be found here[10].
A frequency analysis was performed on the optimised boratobenzene molecule. A summary of the frequency analysis can be found below:
Item               Value     Threshold  Converged?
 Maximum Force            0.000425     0.000450     YES
 RMS     Force            0.000158     0.000300     YES
 Maximum Displacement     0.000888     0.001800     YES
 RMS     Displacement     0.000392     0.001200     YES
 Predicted change in Energy=-7.143639D-07
 Optimization completed.
    -- Stationary point found.
Low frequencies ---  -13.1438    0.0003    0.0005    0.0005   15.0592   18.1658
 Low frequencies ---  371.3447  404.2330  565.2519
MO and NBO Analysis
Population Analysis
The energy calculation for benzene used the basis set 6-31G(d,p) method with defined full nbos and a full population analysis. The d-space file can be found here [11].
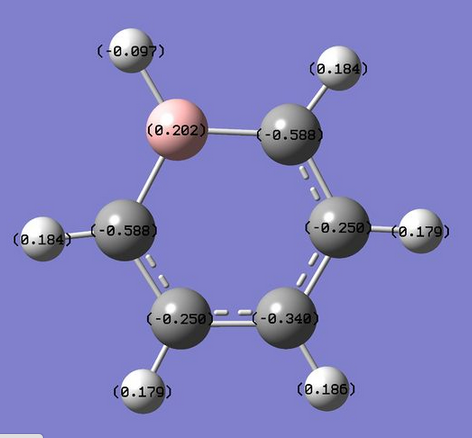
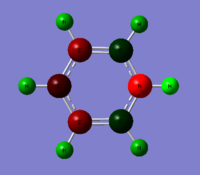
The charge distribution is between -0.588 to 0.588 and is shown in more detail below.
The charge distribution in Boratabenzene is not symmetrical. The CH from benzene is replaced with BH leading to an isoelectronic molecule with a different charge distribution. The Boron is electropositive compared to the electron rich carbon. This causes a more negative charge distribution for the atoms closer to the boron compared to others around the ring.
Pyridinium
Optimisation
The d-space file can be found here [12].
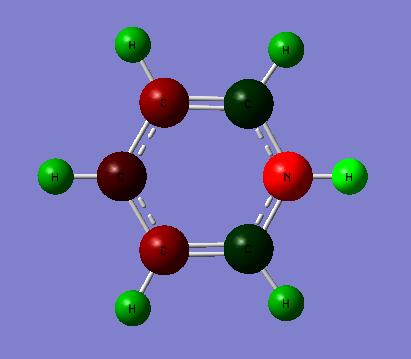
The 6-31G (d,p) method was used with a DFT method and the B3LYP hybrid functional. The Symmetrize function was again used before the optimisation ,so that the correct symmetry,C2v, was obtained.
A summary of the optimisation can be found below:
Item               Value     Threshold  Converged?
 Maximum Force            0.000062     0.000450     YES
 RMS     Force            0.000023     0.000300     YES
 Maximum Displacement     0.000673     0.001800     YES
 RMS     Displacement     0.000171     0.001200     YES
 Predicted change in Energy=-6.687855D-08
 Optimization completed.
    -- Stationary point found.
Optimised Bond lengths
C-N 1.35236 Å
(α)C –(β)C 1.38385 Å
(β)C –(γ)C 1.39877 Å
Frequency Analysis
The d-space file can be found here [13].
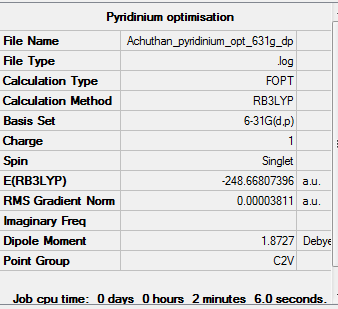
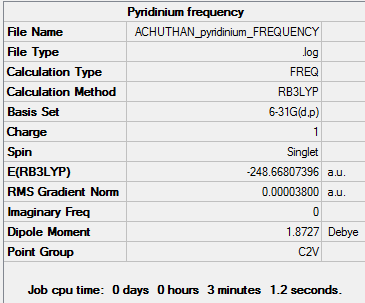
A frequency analysis was performed on the optimised pyridinium molecule. A summary of the frequency analysis can be found below:
 Item               Value     Threshold  Converged?
 Maximum Force            0.000155     0.000450     YES
 RMS     Force            0.000038     0.000300     YES
 Maximum Displacement     0.000738     0.001800     YES
 RMS     Displacement     0.000224     0.001200     YES
 Predicted change in Energy=-7.200057D-08
 Optimization completed.
    -- Stationary point found.
 Low frequencies ---   -7.1936   -0.0005    0.0005    0.0008   17.3356   18.5282
 Low frequencies ---  392.4554  404.0605  620.4719
Population Analysis
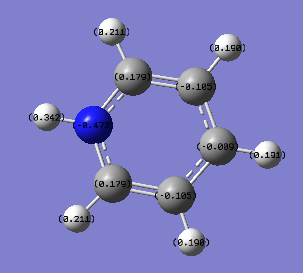
The energy calculation for pyridinium used the basis set 6-31G(d,p) method with defined full nbos and a full population analysis. The d-space file can be found here [14].
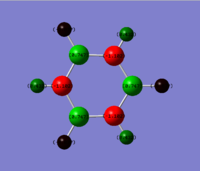
The charge distribution is between -0.472 to 0.472 and is shown in more detail below.
Again The charge distribution is not symmetric like in benzene. This is because of the electronegative nitrogen. Carbon atoms close to the nitrogen atom exhibit a more positive charge density compared to those carbon atoms further away. All the hydrogen atoms are electron deficient compared to the atoms they are bonded to explaining why they have positive charge densities. The hydrogen bonded to the nitrogen has the most positive charge density of the hydrogen atoms because it is bonded to such an electronegative atom.
Borazine
Optimisation
The d-space file can be found here [15].
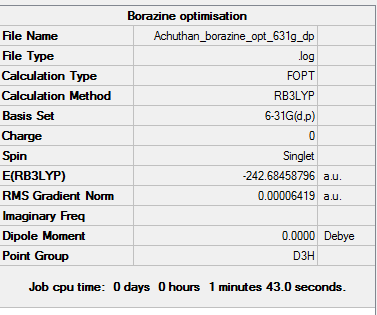
The 6-31G (d,p) method was used with a DFT method and the B3LYP hybrid functional. The Symmetrize function was again used before the optimisation ,so that the correct symmetry,D3h, was obtained.
A summary of the optimisation can be found below:
 Item               Value     Threshold  Converged?
 Maximum Force            0.000085     0.000450     YES
 RMS     Force            0.000033     0.000300     YES
 Maximum Displacement     0.000251     0.001800     YES
 RMS     Displacement     0.000075     0.001200     YES
 Predicted change in Energy=-9.321397D-08
 Optimization completed.
    -- Stationary point found.
Optimised Bond lengths
B-N 1.43067 Å
N-H 1.00975 Å
B-H 1.19494 Å
This is verified by [16].
Frequency Analysis
A frequency analysis was performed on the optimised borazine molecule.
The d-space file can be found here [17].
The summary of the frequency analysis is below:
Item               Value     Threshold  Converged?
 Maximum Force            0.000202     0.000450     YES
 RMS     Force            0.000064     0.000300     YES
 Maximum Displacement     0.000309     0.001800     YES
 RMS     Displacement     0.000097     0.001200     YES
 Predicted change in Energy=-1.068526D-07
 Optimization completed.
    -- Stationary point found.
Low frequencies ---   -7.0927   -6.6825   -6.3636   -0.0099   -0.0064    0.1435
 Low frequencies ---  289.2307  289.2415  403.7841
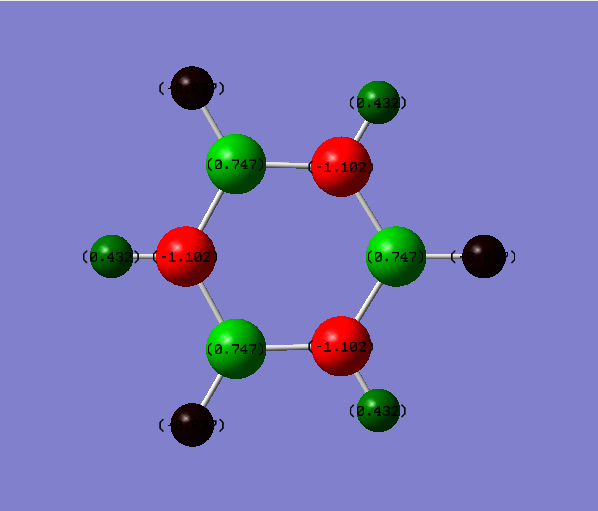
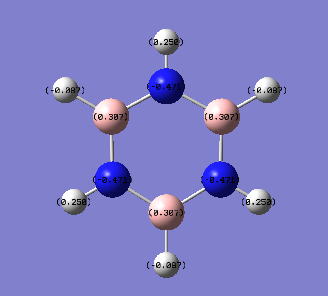
Population Analysis
The energy calculation for borazine used the basis set 6-31G(d,p) method with defined full nbos and a full population analysis. The d-space file can be found here [18].
The charge distribution is between -0.471 to 0.471 and is shown in more detail below.
The charge distribution in borazine is symmetric. The boron is an electropositive atom while the nitrogen is an electronegative atom. The leads to higher electron density around the nitrogen atom compared to the boron atom. Because of the above reasons hydrogen atoms bonded to boron have a higher electron density compared to hydrogen atoms bonded to the nitrogen.
Comparing the charge distribution of the molecules
| Benzene | Boratabenzene | Pyridinium | Borazine |
|---|---|---|---|
 |
 |
 |
|
All four molecules are isoelectronic. The benzene and borazine are symmetric in charge density. This is not apparent in boratabenzene and pyridinium. Benzene has six carbon atoms and six hydrogen atoms with no electronegative or electropositive atoms to distort the system. Therefore all the carbon atoms have the same charge density while the hydrogen atoms have the same charge density. This is not apparent in the other three molecules. In boratabenzene there is an electropositive boron atom with five carbon atoms and six hydrogen atoms. This distorts the system. The carbon and hydrogen atoms close to the boron have a higher electron density than atoms further away from the boron atom. In boratabenzene the B-H unit distorts the pi electron cloud and it no longer shows the symmetrical pi system found in bezene. The negative charge on the molecule gives a spare electron to the vacant pi orbital on boron. The opposite is true in pyridinium where there is an electronegative nitrogen atom, five carbon atoms and six hydrogen atoms. All atoms close to the nitrogen atoms have a lower electron density than atoms further away because the nitrogen is electron withdrawing. The molecule has a positive charge. The electron is removed from sp2 lone pair found on nitrogen. This again leads to distortion of the delocalised pi system electron cloud. The borazine is a symmetric molecule with three boron atoms, three nitrogen atoms and six hydrogens. The nitrogen atoms and boron atoms alternate around the ring. This leads to areas of high electron density on the nitrogens and areas of low electron density on the borons. The hydrogen atoms attached to the nitrogen atoms have a lower charge density than those hydrogen atoms attached to the boron atoms.
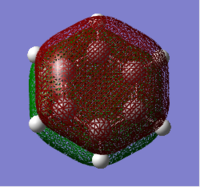
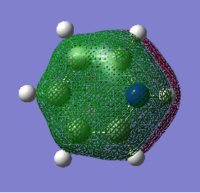
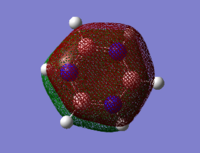
Comparing the Molecular Orbitals of the molecules
| Benzene | Boratabenzene | Pyridinium | Borazine |
|---|---|---|---|
 |
 |
 |
|
The four molecular orbitals appear to be similar. There is a delocalised cloud of electron above and below the plane of the molecule which gives all four molecules their aromatic quality. Comparing the boratabenzene, pyridinium and borazine to benzene, the differences can be rationalised. The benzenes molecular orbital is totally symmetric. In Boratabenzene, the molecular orbital distorts around the boron because of its electropositive nature. This is because the the boron donates less electron density into the molecular orbital. This therefore weakens the pi system. Pyridinium is the opposite of this. The molecular orbital is more dense over the electronegative nitrogen because it contributes electrons to the pi molecular orbital. This gives the pi system in pyridinium added stability. The molecular orbital for borazine is symmetric. Again the molecular orbitals distort away from the boron and towards the nitrogen because of their electron deficient and electron rich properties.
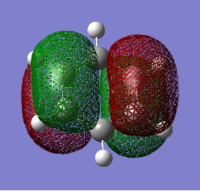
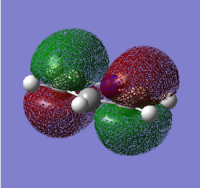
| Benzene | Boratabenzene | Pyridinium | Borazine |
|---|---|---|---|
 |
 |
 |

|
Benzene and borazine's HOMOs are doubly degenerate because of their symmetric nature. This is not apparent in pyridinium and boratabenzene. This is because the presence of electronegative nitrogen in pyridinium lowers the energy of the orbitals while the presence of electropositive boron in boratabenzene increases the energy of the orbitals.
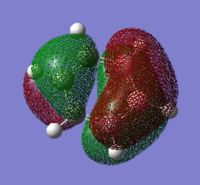
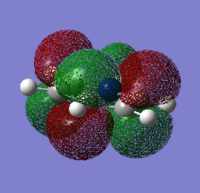
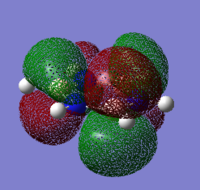
| Benzene | Boratabenzene | Pyridinium | Borazine |
|---|---|---|---|
 |
 |
 |
|
Again the LUMOs of benzene and borazine are degenerate. The presence of boron and nitrogen in borotabenzene and pyridinium leads to them not being degenerate. The unoccupied nature of the LUMOs brings stability and are properties fo an aromatic system.
| MO | Benzene | Boratabenzene | Pyridinium | Borazine |
|---|---|---|---|---|
| pi(1) orbital | -0.35999 | -0.13208 | -0.64064 | -0.36130 |
| HOMO | both -0.24691 | +0.01094 | -0.47885 | both -0.27590 |
| LUMO | both +0.00267 | +0.21469 | -0.25840 | both +0.02422 |
This shows how the nitrogen atom on pyridinium stabilises the MOs while the boron atom on boratabenzene destabilises the MOs because of their respective electronegativities.
Effect of substitutions on MO Diagrams
The symmetric nature of benzene results in strong overlap between the orbitals because they are equal in size, explaining the presence of degenerate energy levels. The other molecules have different atomic orbitals. The boron and nitrogen in boratabenzene and pyridinium do not have the same energy as the carbon atoms in benzene. Nitrogen is more electronegative meaning its orbitals will be lower in energy while boron is more electropositive meaning its orbitals are higher in energy. This leads to less overlap between the orbitals resulting in the loss of degeneracy found in benzene. This results in a less stable molecule. Energy of stabilisation for the orbitals of borazine will also be lower than for that of benzene. This is because there are three carbon degenerate sets of boron orbitals and three degenerate sets of nitrogen orbitals resulting in less overlap between the orbitals. Also benzene will have more degenerate MOs than borazine because of its D6h symmetry compared to borazine's D3h symmetry.
References
- ↑ P. Eaton et al., J.Am.Chem.Soc., 86(15), 1964, pp 3157-3158

