Rep:Mod:inorgcompquintinlo00690346
Inorganic Computational Experiment (Module 2) Quintin Lo CID: 00690346
Introduction
Computational chemistry is a branch of chemistry that uses computer simulations to solve complex problems in chemistry. It allows us to discern correlations between the properties and the structure of compounds and to simulate chemical reactions without having to carry out the experiment in the laboratory. One of the drawbacks to computational chemistry is that it is accurate only when small compounds are analysed and the accuracy also depends on the method used, which we will explore further in this experiment. There are numerous methods available, ranging from ab-initio methods to empirical and semi-empirical methods.
Part 1: Basic computational techniques
Optimisation of BH3
3-21G Optimisation
The optimisation of BH3 was done using Gaussview 5.0 with 3-21G basis-set. The 3-21G basis set is also known as a split valance basis set, where only the double zeta for the valance orbital is calculated as the inner shell electrons are not as important to the calculations. The log file for this optimisation can be found here File:Qlobh3optimisation.log.
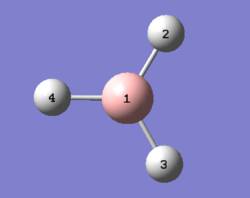
| File Name | QLOBH3OPTIMISATION |
|---|---|
| File Type | .log |
| Calculation Type | FOPT |
| Calculation Method | RB3LYP |
| Basis Set | 3-21G |
| Charge | 0 |
| Spin | Singlet |
| E(RB3LYP) | -26.46 au |
| RMS GRADIENT NORM | 0.0000851 au |
| Imaginary Freq | 0 |
| Dipole Moment | 0.00 Debye |
| Point Group | CS |
The gradient is close to zero (0.0000851 au), which indicates that optimisation has occurred. This was further confirmed by the convergence of all forces in the table below.
Item               Value     Threshold  Converged?
 Maximum Force            0.000220     0.000450     YES
 RMS     Force            0.000106     0.000300     YES
 Maximum Displacement     0.000709     0.001800     YES
 RMS     Displacement     0.000447     0.001200     YES
 Predicted change in Energy=-1.672478D-07
 Optimization completed.
    -- Stationary point found.
                           ----------------------------
                           !   Optimized Parameters   !
                           ! (Angstroms and Degrees)  !
 --------------------------                            --------------------------
 ! Name  Definition              Value          Derivative Info.                !
 --------------------------------------------------------------------------------
 ! R1    R(1,2)                  1.1947         -DE/DX =   -0.0002              !
 ! R2    R(1,3)                  1.1948         -DE/DX =   -0.0002              !
 ! R3    R(1,4)                  1.1944         -DE/DX =   -0.0001              !
 ! A1    A(2,1,3)              120.0157         -DE/DX =    0.0                 !
 ! A2    A(2,1,4)              119.9983         -DE/DX =    0.0                 !
 ! A3    A(3,1,4)              119.986          -DE/DX =    0.0                 !
 ! D1    D(2,1,4,3)            180.0            -DE/DX =    0.0                 !
 --------------------------------------------------------------------------------
 GradGradGradGradGradGradGradGradGradGradGradGradGradGradGradGradGradGrad
| Bond | Bond Length (Å) | Bond | Bond Angle (o) |
|---|---|---|---|
| B1-H2 | 1.19 | H4-B1-H3 | 120.0 |
| B1-H4 | 1.19 | H4-B1-H2 | 120.0 |
| B1-H3 | 1.19 | H2-B1-H3 | 120.0 |
The corresponding boron and hydrogen atoms are shown in diagram 1 above. The calculated B-H bond length in table 2 above corresponds to the experimentally determined bond length by Kawaguchi[1], which was 1.19 Å. The three B-H bonds in the optimised BH3 molecule was found to have slightly different bond lengths, but the deviations from the experimental bond lengths are extremely small (i.e. approximately ±0.006 Å) and these computational simulations are accurate to 0.01 Å, hence they are insignificant. Slight variations in bond angles were also observed, but in general the values are in good agreement with literature values[2]. The discrepancies could be attributed to the 3-21G basis-set, which has extremely low accuracy.
The point group of this molecule is CS and not D3h due to previous adjustments to the bond lengths prior to optimisation.
6-31G(d,p) optimisation
The BH3 molecule was further optimised using the 6-31G(d,p) basis set. The 6-31G(d,p) basis set is known as a higher level basis-set when compared to 3-21G. The 6-31G(d,p) is a polarised basis-set, where polarised functions are taken into account. These functions give the basis-set some flexibility so as to allow the orbitals to be unsymmetrical about the nucleus, which gives a more precise representation of the bonding between the boron and hydrogen atoms. The log file for this optimisation is shown here File:Qlobh3optimisationdp.log.
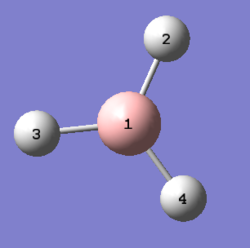
| File Name | QLOBH3OPTIMISATIONDP |
|---|---|
| File Type | .log |
| Calculation Type | FOPT |
| Calculation Method | RB3LYP |
| Basis Set | 6-31G(d,p) |
| Charge | 0 |
| Spin | Singlet |
| E(RB3LYP) | -26.62 au |
| RMS GRADIENT NORM | 0.00000707 au |
| Imaginary Freq | 0 |
| Dipole Moment | 0.00 Debye |
| Point Group | CS |
The gradient is close to zero (0.00000707 au), which indicates that optimisation has occurred. This was further confirmed by the convergence of all forces in the table below.
Item               Value     Threshold  Converged?
 Maximum Force            0.000012     0.000450     YES
 RMS     Force            0.000008     0.000300     YES
 Maximum Displacement     0.000061     0.001800     YES
 RMS     Displacement     0.000038     0.001200     YES
 Predicted change in Energy=-1.069855D-09
 Optimization completed.
    -- Stationary point found.
                           ----------------------------
                           !   Optimized Parameters   !
                           ! (Angstroms and Degrees)  !
 --------------------------                            --------------------------
 ! Name  Definition              Value          Derivative Info.                !
 --------------------------------------------------------------------------------
 ! R1    R(1,2)                  1.1923         -DE/DX =    0.0                 !
 ! R2    R(1,3)                  1.1923         -DE/DX =    0.0                 !
 ! R3    R(1,4)                  1.1923         -DE/DX =    0.0                 !
 ! A1    A(2,1,3)              120.0055         -DE/DX =    0.0                 !
 ! A2    A(2,1,4)              120.0007         -DE/DX =    0.0                 !
 ! A3    A(3,1,4)              119.9939         -DE/DX =    0.0                 !
 ! D1    D(2,1,4,3)            180.0            -DE/DX =    0.0                 !
 --------------------------------------------------------------------------------
 GradGradGradGradGradGradGradGradGradGradGradGradGradGradGradGradGradGrad
| Bond | Bond Length (Å) | Bond | Bond Angle (o) |
|---|---|---|---|
| B1-H2 | 1.19 | H4-B1-H3 | 120.0 |
| B1-H4 | 1.19 | H4-B1-H2 | 120.0 |
| B1-H3 | 1.19 | H2-B1-H3 | 120.0 |
The corresponding boron and hydrogen atoms are shown in diagram 2 above. The B-H bond lengths show good correlation with the reported experimental values[1] at 1.19 Å. The same could be said for the bond angles[2]. It was observed that while 6-31G(d,p) optimisation took slightly longer when compared to 3-21G optimisation. This optimised BH3 molecule is even closer to D3h symmetry when compared to the 3-21G optimised BH3 molecule.
The energy of the 3-21G optimised BH3 molecule is -26.46 au while the energy of the 6-31G(d,p) optimised BH3 molecule is -26.62 au. Any comparisons made between these two energies are likely to be invalid as the basis set used to calculate these energies were different, one being 3-21G and the other 6-31G(d,p), where the calculated energy is highly dependent on the nature of the basis set.
The difference in energy is 0.16 au, which is equivalent to 420 kJ mol-1.
Pseudo-potentials and basis-sets
Using pseudo-potentials and larger basis-sets
GaBr3 was created using Gaussview 5.0. When compared to BH3, GaBr3 contains heavy atoms and hence pseudopotentials and a medium level basis set was used. The molecule was optimised using the LandL2DZ basis set option on a high performance computer (HPC). The results were published on D-Space[3].
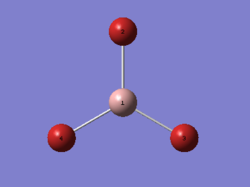
| File Name | Gabr3HPC |
|---|---|
| File Type | .log |
| Calculation Type | FOPT |
| Calculation Method | RB3LYP |
| Basis Set | LANL2DZ |
| Charge | 0 |
| Spin | Singlet |
| E(RB3LYP) | -41.70 au |
| RMS GRADIENT NORM | 0.00000016 au |
| Imaginary Freq | 0 |
| Dipole Moment | 0.00 Debye |
| Point Group | D3h |
The gradient is close to zero (0.00000016 au), which indicates that optimisation has occurred. This was further confirmed by the convergence of all forces in the table below.
Item               Value     Threshold  Converged?
 Maximum Force            0.000000     0.000450     YES
 RMS     Force            0.000000     0.000300     YES
 Maximum Displacement     0.000003     0.001800     YES
 RMS     Displacement     0.000002     0.001200     YES
 Predicted change in Energy=-1.282695D-12
 Optimization completed.
    -- Stationary point found.
                           ----------------------------
                           !   Optimized Parameters   !
                           ! (Angstroms and Degrees)  !
 --------------------------                            --------------------------
 ! Name  Definition              Value          Derivative Info.                !
 --------------------------------------------------------------------------------
 ! R1    R(1,2)                  2.3502         -DE/DX =    0.0                 !
 ! R2    R(1,3)                  2.3502         -DE/DX =    0.0                 !
 ! R3    R(1,4)                  2.3502         -DE/DX =    0.0                 !
 ! A1    A(2,1,3)              120.0            -DE/DX =    0.0                 !
 ! A2    A(2,1,4)              120.0            -DE/DX =    0.0                 !
 ! A3    A(3,1,4)              120.0            -DE/DX =    0.0                 !
 ! D1    D(2,1,4,3)            180.0            -DE/DX =    0.0                 !
 --------------------------------------------------------------------------------
 GradGradGradGradGradGradGradGradGradGradGradGradGradGradGradGradGradGrad
| Bond | Bond Length (Å) | Bond | Bond Angle (o) |
|---|---|---|---|
| Ga1-Br2 | 2.35 | Br4-Ga1-Br3 | 120.0 |
| Ga1-Br4 | 2.35 | Br4-Ga1-Br2 | 120.0 |
| Ga1-Br3 | 2.35 | Br2-Ga1-Br3 | 120.0 |
The gallium and bromine atoms correspond to the atoms shown in diagram 3. The computed Ga-Br bond length (2.35 Å) in table 3 was compared to the experimental value reported by Silva et. al.[4] (2.33 Å) and the value in CRC handbook[5] (2.249 Å), which showed a good correlation between computed and experimental values. Therefore it is safe to say that the result obtained is reasonable as the difference between the computed and literature values are extremely small and negligible.
Using a mixture of basis-sets and pseudo-potentials
BBr3 contains a light atom (B) and heavy atoms (Br), which has a need for a full basis-set for Boron and a pseudo-potential for the heavy Bromine. The molecule was created using Gaussview 5.0 and the optimisation (Gen) was done using the HPC. The results were published on D-Space[6].
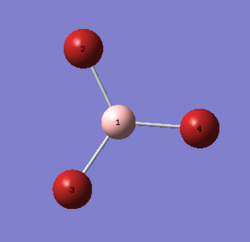
| File Name | BBr3HPC |
|---|---|
| File Type | .log |
| Calculation Type | FOPT |
| Calculation Method | RB3LYP |
| Basis Set | Gen |
| Charge | 0 |
| Spin | Singlet |
| E(RB3LYP) | -64.44 au |
| RMS GRADIENT NORM | 0.00000974 au |
| Imaginary Freq | 0 |
| Dipole Moment | 0.00 Debye |
| Point Group | Cs |
The gradient is close to zero (0.00000974 au), which indicates that optimisation has occurred. This was further confirmed by the convergence of all forces in the table below.
Item               Value     Threshold  Converged?
 Maximum Force            0.000018     0.000450     YES
 RMS     Force            0.000010     0.000300     YES
 Maximum Displacement     0.000106     0.001800     YES
 RMS     Displacement     0.000061     0.001200     YES
 Predicted change in Energy=-2.171373D-09
 Optimization completed.
    -- Stationary point found.
                           ----------------------------
                           !   Optimized Parameters   !
                           ! (Angstroms and Degrees)  !
 --------------------------                            --------------------------
 ! Name  Definition              Value          Derivative Info.                !
 --------------------------------------------------------------------------------
 ! R1    R(1,2)                  1.934          -DE/DX =    0.0                 !
 ! R2    R(1,3)                  1.934          -DE/DX =    0.0                 !
 ! R3    R(1,4)                  1.9339         -DE/DX =    0.0                 !
 ! A1    A(2,1,3)              120.002          -DE/DX =    0.0                 !
 ! A2    A(2,1,4)              120.0006         -DE/DX =    0.0                 !
 ! A3    A(3,1,4)              119.9974         -DE/DX =    0.0                 !
 ! D1    D(2,1,4,3)            180.0            -DE/DX =    0.0                 !
 --------------------------------------------------------------------------------
 GradGradGradGradGradGradGradGradGradGradGradGradGradGradGradGradGradGrad
| Bond | Bond Length (Å) | Bond | Bond Angle (o) |
|---|---|---|---|
| B1-Br2 | 1.93 | Br4-B1-Br3 | 120.0 |
| B1-Br4 | 1.93 | Br4-B1-Br2 | 120.0 |
| B1-Br3 | 1.93 | Br2-B1-Br3 | 120.0 |
The boron and bromine atoms correspond to the atoms shown in diagram 4. The computed B-Br bond length shown in table 8 above correlates well with the value reported in literature (1.90 Å), which was obtained using X-ray crystallography[7]. The computed bond angles also matches well with the values reported in literature[7] (120 o). Further analysis is done below.
Analysis
| Bond | Mean Bond Length (Å) |
|---|---|
| B-H (6-31G(d,p)) | 1.19 |
| B-Br | 1.93 |
| Ga-Br | 2.35 |
It can be seen in table 9 that by increasing the size of the ligands (from H to Br), there was an increase in bond length due to an increase in atomic radii of the ligands. This could also be seen when we look into the electronic structures of both H and Br. H has 1 electron while Br has 35 electrons, therefore for larger atoms such as Br, it must be held further away from the B centre so as to avoid repulsive interactions. This is also known as the van der waals radii. Since both BH3 and BBr3 have the same central B atom, the observed differences were entirely dependent on the nature of the ligand.
Both H and Br atoms are one electron away from having a full valance shell, where both atoms uses 1 electron to form a covalent bond. However, the similarities between the two atoms end there. It is important to take note that the electron H uses to form a bond comes from the 1s orbital while in the case of Br, it accepts an electron to a 4p orbital to form a stable valance 4p shell. This suggests that a B-H bond is stronger when compared to a B-Br bond, which was confirmed by Cottrell et.al.,[8],[9] where the reported B-H bond strength is 390 kJ mol-1 and the reported B-Br bond strength is 380 kJ mol-1.
The same trend could be seen when the central atom was changed from B to Ga, where the same ligands were used in both molecules. Ga is larger and hence it has a greater atomic radii than B, as Ga has 31 electrons compared to the 5 electrons in B. Therefore the ligands must be held further away from Ga as compared to B so as to avoid repulsive interactions between the two large atoms.
Both B and Ga are in group 13 of the periodic table, with Ga being further down the group. Both atoms use 3 electrons to form covalent bonds. Boron is electron deficient and hence it is a stronger Lewis acid as compared to Ga. B containing compounds readily undergoes dimerisation due to its electron deficient nature while Ga containing compounds do not form dimers as it is less lewis acidic. The difference in Lewis acidity indicates that Ga is likely to form weaker bonds with Lewis bases as compared to B.
A chemical bond is the underlying basis of chemistry, which explains a wide variety of concepts in chemistry. It is an attraction between two atoms, possibly due to electrostatic interactions between the nuclei and the electrons of both atoms. It is this attraction that leads to the formation of molecules and compounds, without a chemical bond, we won't be able to explain a lot things we see in chemistry. There are several types of chemical bonds such as ionic, covalent and hydrogen bonds just to name a few.
It is important to note that in reality, a chemical bond is not just a straight line as shown in Gaussview, the only reason it is drawn as a straight line is for simplification purposes. Gaussview does optimisations based on a given set of parameters which are defined by the user, when the result of such optimisations fall outside of these parameters, the "bond" will disappear. This is not to say that a bond does not exist in reality, it just tells us that based on the parameters defined by the user, the bond does not "exist".
Further analysis of BH3 and GaBr3
Frequency analysis of BH3
Frequency analysis is essentially the second derivative of the potential energy surface, which allows us to differentiate between a minimum and a transition state on the potential energy surface. If the frequencies are all positive then a minimum is present and if negative frequencies are present, we have a transition state. As we will see later, the frequency analysis allows us to generate an IR spectrum of the molecule, illustrating the different vibrational modes of the molecule.
The frequency analysis was done on the 6-31G(d,p) optimised BH3 molecule using Gaussview 5.0. The molecule was restricted to a D3h symmetry. The log file for this calculation is shown here. File:Qlobh3frequency2.log
| File Name | QLOBH3FREQUENCY2 |
|---|---|
| File Type | .log |
| Calculation Type | FREQ |
| Calculation Method | RB3LYP |
| Basis Set | 6-31G(d,p) |
| Charge | 0 |
| Spin | Singlet |
| E(RB3LYP) | -25.62 au |
| RMS GRADIENT NORM | 0.00000291 au |
| Imaginary Freq | 0 |
| Dipole Moment | 0.00 Debye |
| Point Group | D3h |
The gradient is close to zero (0.00000291 au), which indicates that optimisation has occurred. This was further confirmed by the convergence of all forces in the table below.
Item               Value     Threshold  Converged?
 Maximum Force            0.000006     0.000450     YES
 RMS     Force            0.000004     0.000300     YES
 Maximum Displacement     0.000023     0.001800     YES
 RMS     Displacement     0.000015     0.001200     YES
 Predicted change in Energy=-2.008834D-10
 Optimization completed.
    -- Stationary point found.
                           ----------------------------
                           !   Optimized Parameters   !
                           ! (Angstroms and Degrees)  !
 --------------------------                            --------------------------
 ! Name  Definition              Value          Derivative Info.                !
 --------------------------------------------------------------------------------
 ! R1    R(1,2)                  1.1923         -DE/DX =    0.0                 !
 ! R2    R(1,3)                  1.1923         -DE/DX =    0.0                 !
 ! R3    R(1,4)                  1.1923         -DE/DX =    0.0                 !
 ! A1    A(2,1,3)              120.0            -DE/DX =    0.0                 !
 ! A2    A(2,1,4)              120.0            -DE/DX =    0.0                 !
 ! A3    A(3,1,4)              120.0            -DE/DX =    0.0                 !
 ! D1    D(2,1,4,3)            180.0            -DE/DX =    0.0                 !
 --------------------------------------------------------------------------------
 GradGradGradGradGradGradGradGradGradGradGradGradGradGradGradGradGradGrad
Low frequencies ---   0   0   0   6   12   12
 Low frequencies --- 1162.9963 1213.1826 1213.1853
A minimum is present as there are no negative frequencies. It is also important to note that BH3 is a non-linear molecule, which tells us that there are 3N-6 vibrational degrees of freedom, where the low frequencies in the first line represent the value of "6" in 3N-6.
The energy of the molecule reported in table 9 is the same as the energy reported earlier for the 6-31G(d,p) optimised molecule. This confirms that there were no changes in the structure during the frequency analysis. The six frequencies are within the acceptable range of ±15 cm-1.
Animating the vibrations in BH3
The vibration animations were done on Gaussview 5.0 and the different forms of motion are described in table 11 below. This also allows us to generate the computed IR spectrum shown in diagram 5.

BH3 has 6 different modes of vibrations, each with a definite frequency. Even though the vibrational modes are distinct in terms of the way the atoms move, some of the them are degenerate as they have the same frequency. Therefore the number of IR peaks is less than the number of modes of vibrations. The vibrational mode at 2582 cm-1 has an intensity of 0, which means it does not appear on the spectrum. Thus we can conclude that this vibrational mode is not IR active where the source of inactivity is due to its completely symmetrical vibrational mode, which prevents it from absorbing IR light.
Frequency Analysis of GaBr3
Further analysis was done on the LandL2DZ GaBr3 molecule. In order to ensure that the molecule is at a minimum, it was subjected to frequency analysis using Gaussview 5.0 and the results are shown below. The log file for this analysis can be found here File:QLOGABR3FREQUENCY.LOG.
| File Name | QLOGABR3frequency |
|---|---|
| File Type | .log |
| Calculation Type | FREQ |
| Calculation Method | RB3LYP |
| Basis Set | LandL2DZ |
| Charge | 0 |
| Spin | Singlet |
| E(RB3LYP) | -41.70 a.u. |
| RMS GRADIENT NORM | 0.00000011 a.u. |
| Imaginary Freq | 0 |
| Dipole Moment | 0.00 Debye |
| Point Group | D3h |
The gradient is close to zero (0.00000011 au), which indicates that optimisation has occurred. This was further confirmed by the convergence of all forces in the table below.
Item               Value     Threshold  Converged?
 Maximum Force            0.000000     0.000450     YES
 RMS     Force            0.000000     0.000300     YES
 Maximum Displacement     0.000003     0.001800     YES
 RMS     Displacement     0.000002     0.001200     YES
 Predicted change in Energy=-1.282694D-12
 Optimization completed.
    -- Stationary point found.
                           ----------------------------
                           !   Optimized Parameters   !
                           ! (Angstroms and Degrees)  !
 --------------------------                            --------------------------
 ! Name  Definition              Value          Derivative Info.                !
 --------------------------------------------------------------------------------
 ! R1    R(1,2)                  2.3502         -DE/DX =    0.0                 !
 ! R2    R(1,3)                  2.3502         -DE/DX =    0.0                 !
 ! R3    R(1,4)                  2.3502         -DE/DX =    0.0                 !
 ! A1    A(2,1,3)              120.0            -DE/DX =    0.0                 !
 ! A2    A(2,1,4)              120.0            -DE/DX =    0.0                 !
 ! A3    A(3,1,4)              120.0            -DE/DX =    0.0                 !
 ! D1    D(2,1,4,3)            180.0            -DE/DX =    0.0                 !
 --------------------------------------------------------------------------------
 GradGradGradGradGradGradGradGradGradGradGradGradGradGradGradGradGradGrad
Low frequencies ---   0   0   0  0    0    1
 Low frequencies ---   76.3744   76.3753   99.6982
The frequency analysis was carried out correctly as there was no observable change in the energy of the molecule. A minimum was obtained as there are no negative frequencies. As with BH3, GaBr3 is a non-linear molecule, hence it has 3N-6 vibrational degrees of freedom, where the value of "6" is shown above.
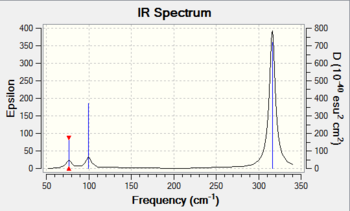
GaBr3 has 6 vibrational modes but it only has 3 peaks in the IR spectrum (diagram 6). This is due to degenerate vibrational modes, where some vibrational modes have the same frequency even though each mode is distinct in terms of the motion of individual atoms associated with the molecule. The IR inactive peak is at 197 cm-1, which has an intensity of 0. As mentioned earlier, this is due to the totally symmetrical mode of vibration at this frequency.
Comparison between BH3 and GaBr3
| Mode (BH3) | Frequency (cm-1) | Mode (GaBr3) | Frequency (cm-1) |
|---|---|---|---|
| 1 | 1163 | 1 | 76 |
| 2 | 1213 | 2 | 76 |
| 3 | 1213 | 3 | 99 |
| 4 | 2582 | 4 | 197 |
| 5 | 2715 | 5 | 316 |
| 6 | 2715 | 6 | 316 |
The obvious difference in the frequencies of BH3 and GaBr3 is the fact that the frequencies for GaBr3 is lower than that of BH3. As mentioned earlier, Ga-Br bonds (2.35 Å) are longer than B-H bonds (1.19 Å) and as a result, Ga-Br bonds are known to be weaker than their B-H counterparts, which leads to lower frequencies in the IR spectrum of GaBr3 as compared to the BH3. An alternative explanation for the differences in frequency was put forward by Atkins and de Paula[10], where the formula for the frequency (v) of absorption band was given by the equation 1 below:

where k is the spring constant for the B-H or Ga-Br bond, c is the speed of light and μ is the reduced mass of the B-H or Ga-Br bond. The reduced mass μ is given by equation 2 below:

where mA is the mass of atom A and mB is mass of atom B.
It is clear that the reduced mass of the Ga-Br bond is greater than that of the B-H bond. Since the reduced mass is inversely proportional to the frequency of absorbance, the frequencies for GaBr3 will definitely be lower than that of BH3. This theory is further reinforced by the fact that the force constant of the Ga-Br bond is lower than that of the B-H bond, where the force constant is directly proportional to the frequency of absorbance as shown in equation 1.
There has been a reordering of modes. In BH3, the first vibrational mode started off 1163 cm-1 with a symmetry of A2' followed by two E' vibrational modes as shown in table 11, while in GaBr3, the first vibrational mode was at 76 cm-1 with a E' symmetry followed by another E' and an A2' vibrational modes as shown in table 13.
The IR spectra of BH3 and GaBr3 both contain 3 peaks where both molecules contains degenerate vibrational modes. Another similarity between these two molecules is the fact that both contain one IR inactive vibrational mode, which is rationalised by the symmetric A1' vibrational mode.
The A2' vibrational modes lie close to the E' vibrational modes while the A1' vibrational modes lie close to the E' modes but are higher in energy. They are higher in energy because A1' and E' vibrational modes in both BH3 and GaBr3 involve a greater displacement of all four atoms from their equilibrium positions as compared to the A2' and E' vibrational modes. These stretching and bending motions require a considerable amount of energy as we need to overcome the attractive interactions between two atoms in a bond without breaking the bond. Hence the larger the displacement of atoms from their equilibrium positions, the higher the energy of the vibrational mode.
The same method and basis set for both optimisation and frequency analysis was used for calculations so that meaningful comparisons can be made between the results obtained in this experiment as the energy of the molecule is highly dependent on the method and basis set used. During optimisation and frequency analysis, the method and basis set determines the parameters used to solve the Schrodinger equation for the nuclear positions and electrons which in turn will allow us to obtain the energy of the molecule. Hence using different methods and basis sets will give different energies for the same molecule which will invalidate any comparisons that were made.
Frequency analysis gives the second derivative of the potential energy surface, which allows us to differentiate between a minimum on the potential energy surface or a transition state. Positive frequencies indicate the presence of a minimum while negative frequencies indicates a transition state is present instead of a minimum. This also allows us to generate a computed IR spectrum of a molecule and visualise the vibrational modes of a molecule as shown earlier.
It must be noted that a tight optimisation was used to obtain frequencies close to zero. 'Low frequencies' represents the frequency for rotation and translational motion of the molecule under investigation.[11]
Molecular orbitals of BH3
The molecular orbitals of the 6-31G(d,p) optimised BH3 was analysed using Gaussview. The table below shows the first eight molecular orbitals (MO) of BH3. The checkpoint file used can be found here. File:Qlobh3optimisationday3.chk
| Number | Energy (au) | MO | Number | Energy (au) | MO |
|---|---|---|---|---|---|
| 1 | -6.77 | 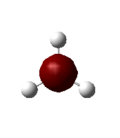 |
5 | -0.06 | 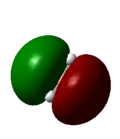
|
| 2 | -0.51 |  |
6 | 0.16 | 
|
| 3 | -0.35 |  |
7 | 0.18 | 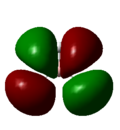
|
| 4 | -0.35 |  |
8 | 0.18 | 
|

As shown in diagram 7 above, there are no significant differences between the real and LCAO MOs. This tells us that qualitative MO theory is very useful in allowing us to predict the real MOs of BH3 without using a computer. However, BH3 is a rather simple molecule, which might be a reason why the real and LCAO MOs look very similar. Further investigations must be made for more complex molecules before we can determine whether qualitative MO theory is indeed useful and accurate.
Analysis of NH3
Optimisation and frequency analysis of NH3
NH3 was optimised on Gaussview 5.0 using the 6-31G(d,p) basis set, the frequency of NH3 was analysed at the same time using the Opt+Freq option in the Gaussian calculation setup window. Frequency analysis allows us to check if a minimum is present. The file for this analysis can be found here.File:QLONH3OPTFREQ1.LOG
| File Name | qlonh3optfreq1 |
|---|---|
| File Type | .log |
| Calculation Type | FREQ |
| Calculation Method | RB3LYP |
| Basis Set | 6-31G(d,p) |
| Charge | 0 |
| Spin | Singlet |
| E(RB3LYP) | -56.56 au |
| RMS GRADIENT NORM | 0.00000323 au |
| Imaginary Freq | 0 |
| Dipole Moment | 1.85 Debye |
| Point Group | C3V |
The gradient is close to zero (0.00000885 au), which indicates that optimisation has occurred. This was further confirmed by the convergence of all forces in the table below.
 Item               Value     Threshold  Converged?
 Maximum Force            0.000006     0.000015     YES
 RMS     Force            0.000004     0.000010     YES
 Maximum Displacement     0.000014     0.000060     YES
 RMS     Displacement     0.000009     0.000040     YES
 Predicted change in Energy=-1.141602D-10
 Optimization completed.
    -- Stationary point found.
                           ----------------------------
                           !   Optimized Parameters   !
                           ! (Angstroms and Degrees)  !
 --------------------------                            --------------------------
 ! Name  Definition              Value          Derivative Info.                !
 --------------------------------------------------------------------------------
 ! R1    R(1,2)                  1.018          -DE/DX =    0.0                 !
 ! R2    R(1,3)                  1.018          -DE/DX =    0.0                 !
 ! R3    R(1,4)                  1.018          -DE/DX =    0.0                 !
 ! A1    A(2,1,3)              105.7446         -DE/DX =    0.0                 !
 ! A2    A(2,1,4)              105.7446         -DE/DX =    0.0                 !
 ! A3    A(3,1,4)              105.7446         -DE/DX =    0.0                 !
 ! D1    D(2,1,4,3)           -111.8637         -DE/DX =    0.0                 !
 --------------------------------------------------------------------------------
 GradGradGradGradGradGradGradGradGradGradGradGradGradGradGradGradGradGrad
Low frequencies ---   0   0   0    7    8   8
 Low frequencies --- 1089.3834 1693.9368 1693.9368
The frequency analysis did not result in a change the energy of the NH3 molecule, hence it was carried out correctly. A minimum was obtained as there are no negative frequencies. As mentioned before, NH3 is a non-linear molecule and hence it has 3N-6 vibrational degrees of freedom, where the value of "6" is shown in above (low frequencies).
The vibrations were then animated using Gaussview and are shown in the table below.
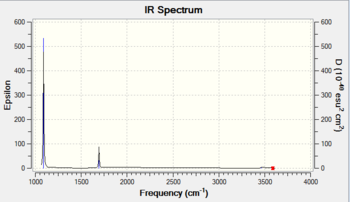
There are only 2 observable peaks in the IR spectrum of NH3 even though there are 6 vibrational modes. This is due to the degeneracy of the vibrational modes where the vibrational modes are distinct in terms of the motion of atoms but are the same in terms of their frequencies. The A1 vibrational mode has a rather low intensity (1), hence it could not be seen in the spectrum. The low intensity is probably due to the symmetric nature of the vibrational mode.
MOs of NH3
| Number | Energy | MO | Number | Energy | MO |
|---|---|---|---|---|---|
| 1 | -14.3568 |  |
5 | -0.25318 | 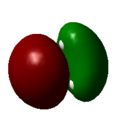
|
| 2 | -0.84466 |  |
6 | 0.07985 | 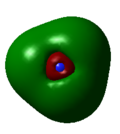
|
| 3 | -0.45030 | 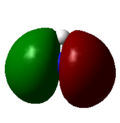 |
7 | 0.16923 | 
|
| 4 | -0.45030 |  |
8 | 0.16923 | 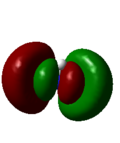
|
As with the case of BH3, there were no significant differences between the real and LCAO MOs in NH3. This shows that qualitative MO theory is accurate in this case and is useful in determining the MOs of NH3.
Natural Bond Orbital (NBO) Analysis of NH3
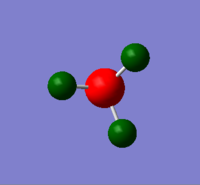
NBO analysis was done using Gaussview 5.0 and the results are shown in diagram 9. The file for this analysis is shown here. File:QLONH3FREQUENCY11.LOG
As shown in the diagram, the nitrogen atom is bright red, which indicates the presence of a large negative charge. This was expected due to the electronegativity of nitrogen. The bright green colour on the hydrogen atoms shows the presence of a high positive charge, which again is due to the polar N-H bond in NH3. The charge range in this case is between -1.000 and +1.000.
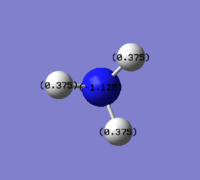
The NBO charges as shown in the diagram 10 above illustrates the specific NBO charges for nitrogen and hydrogen atoms which are -1.125 and 0.375 respectively. It was noted that the nitrogen atom is outside of the -1.000 to +1.000 charge range.
Association energies: Ammonia-Borane
Ammonia-Borane was optimised using Gaussview 5.0 at the B3LYP/6-31G(d,p) level. Additional keywords such as 'int=ultrafine' and 'SCF=conver=9' were used to ensure a better optimisation takes place. The log file for this optimisation can be found here. File:QLOBH3NH3OPTIMISATIONSCF.LOG.
| File Name | QLOBH3NH3OPTIMISATIONSCF |
|---|---|
| File Type | .log |
| Calculation Type | FOPT |
| Calculation Method | RB3LYP |
| Basis Set | 6-31G(d,p) |
| Charge | 0 |
| Spin | Singlet |
| E(RB3LYP) | -83.22 au |
| RMS GRADIENT NORM | 0.00000047 au |
| Imaginary Freq | 0 |
| Dipole Moment | 5.56 Debye |
| Point Group | C3V |
The gradient is very small and is close to zero (0.00000047 au), which indicates that optimisation has occurred. This was further confirmed by the convergence of all forces in the table below.
Item               Value     Threshold  Converged?
 Maximum Force            0.000002     0.000015     YES
 RMS     Force            0.000000     0.000010     YES
 Maximum Displacement     0.000008     0.000060     YES
 RMS     Displacement     0.000004     0.000040     YES
 Predicted change in Energy=-1.705809D-11
 Optimization completed.
    -- Stationary point found.
                           ----------------------------
                           !   Optimized Parameters   !
                           ! (Angstroms and Degrees)  !
 --------------------------                            --------------------------
 ! Name  Definition              Value          Derivative Info.                !
 --------------------------------------------------------------------------------
 ! R1    R(1,2)                  1.2098         -DE/DX =    0.0                 !
 ! R2    R(1,3)                  1.2098         -DE/DX =    0.0                 !
 ! R3    R(1,4)                  1.2098         -DE/DX =    0.0                 !
 ! R4    R(1,5)                  1.6677         -DE/DX =    0.0                 !
 ! R5    R(5,6)                  1.0185         -DE/DX =    0.0                 !
 ! R6    R(5,7)                  1.0185         -DE/DX =    0.0                 !
 ! R7    R(5,8)                  1.0185         -DE/DX =    0.0                 !
 ! A1    A(2,1,3)              113.8737         -DE/DX =    0.0                 !
 ! A2    A(2,1,4)              113.8737         -DE/DX =    0.0                 !
 ! A3    A(2,1,5)              104.5976         -DE/DX =    0.0                 !
 ! A4    A(3,1,4)              113.8737         -DE/DX =    0.0                 !
 ! A5    A(3,1,5)              104.5976         -DE/DX =    0.0                 !
 ! A6    A(4,1,5)              104.5976         -DE/DX =    0.0                 !
 ! A7    A(1,5,6)              111.023          -DE/DX =    0.0                 !
 ! A8    A(1,5,7)              111.023          -DE/DX =    0.0                 !
 ! A9    A(1,5,8)              111.023          -DE/DX =    0.0                 !
 ! A10   A(6,5,7)              107.8759         -DE/DX =    0.0                 !
 ! A11   A(6,5,8)              107.8759         -DE/DX =    0.0                 !
 ! A12   A(7,5,8)              107.8759         -DE/DX =    0.0                 !
 ! D1    D(2,1,5,6)             60.0            -DE/DX =    0.0                 !
 ! D2    D(2,1,5,7)            180.0            -DE/DX =    0.0                 !
 ! D3    D(2,1,5,8)            -60.0            -DE/DX =    0.0                 !
 ! D4    D(3,1,5,6)            180.0            -DE/DX =    0.0                 !
 ! D5    D(3,1,5,7)            -60.0            -DE/DX =    0.0                 !
 ! D6    D(3,1,5,8)             60.0            -DE/DX =    0.0                 !
 ! D7    D(4,1,5,6)            -60.0            -DE/DX =    0.0                 !
 ! D8    D(4,1,5,7)             60.0            -DE/DX =    0.0                 !
 ! D9    D(4,1,5,8)            180.0            -DE/DX =    0.0                 !
 --------------------------------------------------------------------------------
 GradGradGradGradGradGradGradGradGradGradGradGradGradGradGradGradGradGrad
Once the molecule was confirmed to be optimised, a frequency analysis of NH3BH3 was carried out. The file for the frequency analysis can be found here. File:QLOBH3NH3FREQSCF.LOG
| File Name | QLOBH3NH3FREQSCF |
|---|---|
| File Type | .log |
| Calculation Type | FREQ |
| Calculation Method | RB3LYP |
| Basis Set | 6-31G(d,p) |
| Charge | 0 |
| Spin | Singlet |
| E(RB3LYP) | -83.22 a.u. |
| RMS GRADIENT NORM | 0.00000052 a.u. |
| Imaginary Freq | 0 |
| Dipole Moment | 5.56 Debye |
| Point Group | C3V |
Low frequencies ---   0   0   0    0    0   0
 Low frequencies ---  263.3086  632.9964  638.4686
There are no negative frequencies, hence a minimum is present.
Association energy calculation for NH3BH3
The reaction between NH3 and BH3 is shown in the following equation:
The energies of each molecule in this reaction are shown below:
E(BH3)= -26.62 au
E(NH3BH3)= -83.22 auThe energy difference is given by ΔE = E(NH3BH3)-[E(NH3)+E(BH3)], where ΔE is equal to -0.05 au which is equivalent to -140 kJ mol-1.
Therefore we can conclude that the association energy and the dissociation energy of NH3BH3 are -140 kJ mol-1 and 140 kJ mol-1 respectively.
The dissociation energy of NH3BH3 was then compared to the experimental value reported by Haaland[12] (31 kcal mol-1, which is equivalent to 130 kJ mol-1), which showed relatively good correlation between experimental and computed values.
Part 2 (mini project): Lewis acids and bases
The conformers, vibrations and MOs of Al2Cl4Br2 are investigated in this section using Gaussview 5.0. The 6-31G(d,p) basis set was used for Al and Cl and a pseudo-potential LanL2DZ was used for the heavy atom Br.
Monomers
Optimisation of AlCl3
AlCl3 was first optimised using Gaussview 5.0 using the 6-31G(d,p) basis set. A tight convergence criteria was set to ensure the optimisation is good. The file for this optimisation can be found below. File:QLOALCL3OPTIMISATION.LOG

| File Name | qloalcl3optmisation |
|---|---|
| File Type | .log |
| Calculation Type | FOPT |
| Calculation Method | RB3LYP |
| Basis Set | 6-31G(d,p) |
| Charge | 0 |
| Spin | Singlet |
| E(RB3LYP) | -1623.23 au |
| RMS GRADIENT NORM | 0.00000007 au |
| Imaginary Freq | 0 |
| Dipole Moment | 0.00 Debye |
| Point Group | D3h |
The gradient is close to zero (0.00000007 au), which indicates that optimisation has occurred. This was further confirmed by the convergence of all forces in the table below.
Item               Value     Threshold  Converged?
 Maximum Force            0.000000     0.000015     YES
 RMS     Force            0.000000     0.000010     YES
 Maximum Displacement     0.000001     0.000060     YES
 RMS     Displacement     0.000001     0.000040     YES
 Predicted change in Energy=-1.670988D-13
 Optimization completed.
    -- Stationary point found.
                           ----------------------------
                           !   Optimized Parameters   !
                           ! (Angstroms and Degrees)  !
 --------------------------                            --------------------------
 ! Name  Definition              Value          Derivative Info.                !
 --------------------------------------------------------------------------------
 ! R1    R(1,2)                  2.0874         -DE/DX =    0.0                 !
 ! R2    R(1,3)                  2.0874         -DE/DX =    0.0                 !
 ! R3    R(1,4)                  2.0874         -DE/DX =    0.0                 !
 ! A1    A(2,1,3)              120.0            -DE/DX =    0.0                 !
 ! A2    A(2,1,4)              120.0            -DE/DX =    0.0                 !
 ! A3    A(3,1,4)              120.0            -DE/DX =    0.0                 !
 ! D1    D(2,1,4,3)            180.0            -DE/DX =    0.0                 !
 --------------------------------------------------------------------------------
 GradGradGradGradGradGradGradGradGradGradGradGradGradGradGradGradGradGrad
| Bond | Bond Length (Å) | Bond | Bond Angle (o) |
|---|---|---|---|
| Al1-Cl2 | 2.09 | Cl4-Al1-Cl3 | 120.0 |
| A1-Cl3 | 2.09 | Cl4-Al1-Cl2 | 120.0 |
| Al1-Cl4 | 2.09 | Cl2-Al1-Cl3 | 120.0 |
The computed bond length (2.09 Å) is close to the reported bond length in literature[5] (2.063 Å), a difference of 0.027 Å is small and negligible. The computed bond angles are consistent and hence the optimisation of AlCl3 was carried out correctly.
Optimisation of AlCl2Br
AlCl2Br was then optimised using the LanL2DZ basis set as it contains a heavy Br atom, which means the 6-31G(d,p) basis set cannot be used. A tight convergence criteria was set to ensure good optimisation. The log file for this optimisation can be found here. File:QLOALCL2BROPTIMISATION.LOG

| File Name | qloalcl2broptmisation |
|---|---|
| File Type | .log |
| Calculation Type | FOPT |
| Calculation Method | RB3LYP |
| Basis Set | LANL2DZ |
| Charge | 0 |
| Spin | Singlet |
| E(RB3LYP) | -45.22 au |
| RMS GRADIENT NORM | 0.00000031 au |
| Imaginary Freq | 0 |
| Dipole Moment | 0.52 Debye |
| Point Group | C2V |
The gradient is close to zero (0.00000031 au), which indicates that optimisation has occurred. This was further confirmed by the convergence of all forces in the table below.
Item               Value     Threshold  Converged?
 Maximum Force            0.000001     0.000015     YES
 RMS     Force            0.000000     0.000010     YES
 Maximum Displacement     0.000007     0.000060     YES
 RMS     Displacement     0.000004     0.000040     YES
 Predicted change in Energy=-4.705638D-12
 Optimization completed.
    -- Stationary point found.
                           ----------------------------
                           !   Optimized Parameters   !
                           ! (Angstroms and Degrees)  !
 --------------------------                            --------------------------
 ! Name  Definition              Value          Derivative Info.                !
 --------------------------------------------------------------------------------
 ! R1    R(1,2)                  2.3355         -DE/DX =    0.0                 !
 ! R2    R(1,3)                  2.1782         -DE/DX =    0.0                 !
 ! R3    R(1,4)                  2.1782         -DE/DX =    0.0                 !
 ! A1    A(2,1,3)              120.3531         -DE/DX =    0.0                 !
 ! A2    A(2,1,4)              120.3531         -DE/DX =    0.0                 !
 ! A3    A(3,1,4)              119.2938         -DE/DX =    0.0                 !
 ! D1    D(2,1,4,3)            180.0            -DE/DX =    0.0                 !
 --------------------------------------------------------------------------------
 GradGradGradGradGradGradGradGradGradGradGradGradGradGradGradGradGradGrad
| Bond | Bond Length (Å) | Bond | Bond Angle (o) |
|---|---|---|---|
| Al1-Br2 | 2.34 | Cl4-Al1-Cl3 | 119.2 |
| A1-Cl3 | 2.18 | Cl4-Al1-Br2 | 120.4 |
| Al1-Cl4 | 2.18 | Br2-Al1-Cl3 | 120.4 |
No literature value was found for the bond lengths and angles for the AlCl2Br molecule.
Isomers of Al2Cl4Br2
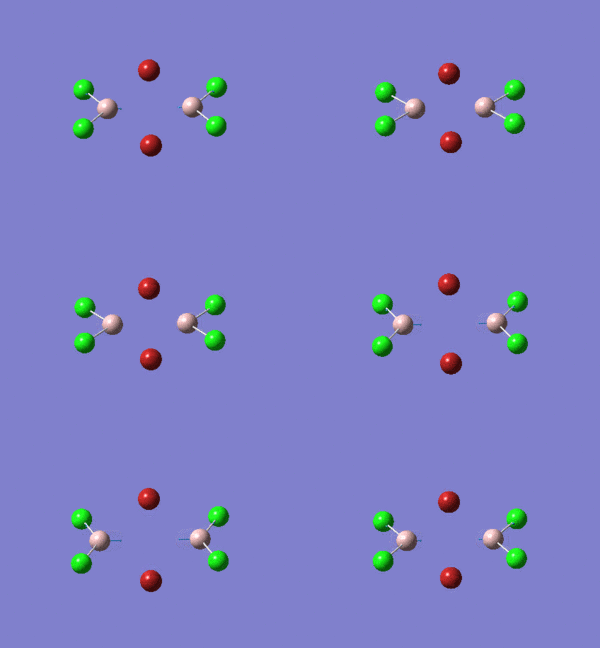
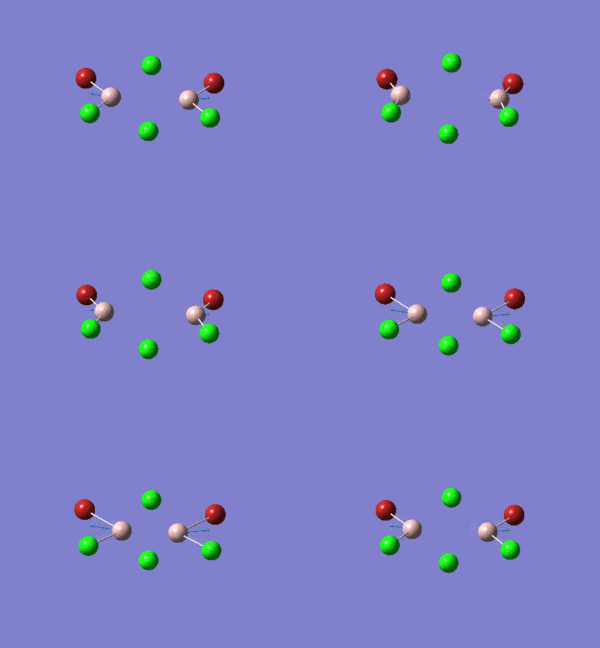
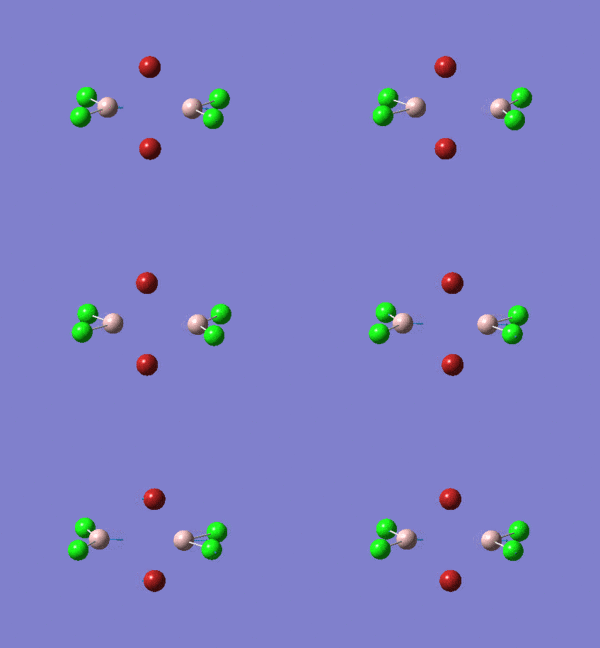
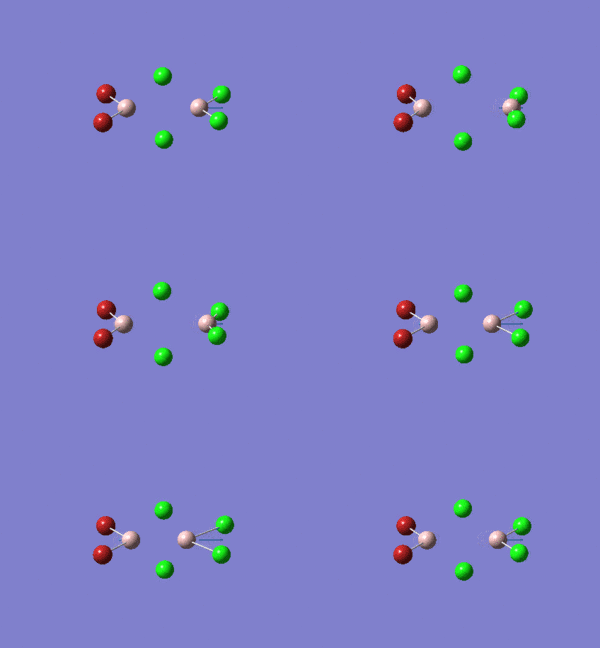
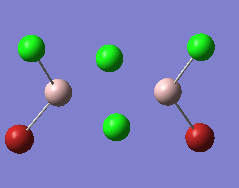
There are four different isomers of Al2Cl4Br2 and they are shown in diagram 13 below.

Optimisation
Optimisation of isomer 1
Isomer 1 was optimised using the LanL2DZ basis set with a tight convergence criteria on Gaussview 5.0, where the keywords "int=ultrafine" were used. The results are shown in table 25 below. The log file for this calculation is shown here. File:QLOAL2CL4BR2OPTIMISATION2.LOG

| File Name | qloal2cl4br2optimisation2 |
|---|---|
| File Type | .log |
| Calculation Type | FOPT |
| Calculation Method | RB3LYP |
| Basis Set | LANL2DZ |
| Charge | 0 |
| Spin | Singlet |
| E(RB3LYP) | -90.46 au |
| RMS GRADIENT NORM | 0.000000197 au |
| Imaginary Freq | 0 |
| Dipole Moment | 0.00 Debye |
| Point Group | D2h |
The gradient is very small and is close to zero (0.000000197 au), which indicates that optimisation has occurred. This was further confirmed by the convergence of all forces in the table below.
Item               Value     Threshold  Converged?
 Maximum Force            0.000003     0.000015     YES
 RMS     Force            0.000001     0.000010     YES
 Maximum Displacement     0.000028     0.000060     YES
 RMS     Displacement     0.000012     0.000040     YES
 Predicted change in Energy=-2.131688D-10
 Optimization completed.
    -- Stationary point found.
                           ----------------------------
                           !   Optimized Parameters   !
                           ! (Angstroms and Degrees)  !
 --------------------------                            --------------------------
 ! Name  Definition              Value          Derivative Info.                !
 --------------------------------------------------------------------------------
 ! R1    R(1,5)                  2.1805         -DE/DX =    0.0                 !
 ! R2    R(1,6)                  2.1805         -DE/DX =    0.0                 !
 ! R3    R(1,7)                  2.5878         -DE/DX =    0.0                 !
 ! R4    R(1,8)                  2.5878         -DE/DX =    0.0                 !
 ! R5    R(2,3)                  2.1805         -DE/DX =    0.0                 !
 ! R6    R(2,4)                  2.1805         -DE/DX =    0.0                 !
 ! R7    R(2,7)                  2.5878         -DE/DX =    0.0                 !
 ! R8    R(2,8)                  2.5878         -DE/DX =    0.0                 !
 ! A1    A(5,1,6)              122.9186         -DE/DX =    0.0                 !
 ! A2    A(5,1,7)              109.9006         -DE/DX =    0.0                 !
 ! A3    A(5,1,8)              109.9006         -DE/DX =    0.0                 !
 ! A4    A(6,1,7)              109.9013         -DE/DX =    0.0                 !
 ! A5    A(6,1,8)              109.9013         -DE/DX =    0.0                 !
 ! A6    A(7,1,8)               89.1314         -DE/DX =    0.0                 !
 ! A7    A(3,2,4)              122.9186         -DE/DX =    0.0                 !
 ! A8    A(3,2,7)              109.9006         -DE/DX =    0.0                 !
 ! A9    A(3,2,8)              109.9006         -DE/DX =    0.0                 !
 ! A10   A(4,2,7)              109.9013         -DE/DX =    0.0                 !
 ! A11   A(4,2,8)              109.9013         -DE/DX =    0.0                 !
 ! A12   A(7,2,8)               89.1314         -DE/DX =    0.0                 !
 ! A13   A(1,7,2)               90.8687         -DE/DX =    0.0                 !
 ! A14   A(1,8,2)               90.8686         -DE/DX =    0.0                 !
 ! D1    D(5,1,7,2)           -110.882          -DE/DX =    0.0                 !
 ! D2    D(6,1,7,2)            110.8969         -DE/DX =    0.0                 !
 ! D3    D(8,1,7,2)              0.0071         -DE/DX =    0.0                 !
 ! D4    D(5,1,8,2)            110.882          -DE/DX =    0.0                 !
 ! D5    D(6,1,8,2)           -110.897          -DE/DX =    0.0                 !
 ! D6    D(7,1,8,2)             -0.0071         -DE/DX =    0.0                 !
 ! D7    D(3,2,7,1)            110.882          -DE/DX =    0.0                 !
 ! D8    D(4,2,7,1)           -110.897          -DE/DX =    0.0                 !
 ! D9    D(8,2,7,1)             -0.0071         -DE/DX =    0.0                 !
 ! D10   D(3,2,8,1)           -110.882          -DE/DX =    0.0                 !
 ! D11   D(4,2,8,1)            110.8969         -DE/DX =    0.0                 !
 ! D12   D(7,2,8,1)              0.0071         -DE/DX =    0.0                 !
 --------------------------------------------------------------------------------
 GradGradGradGradGradGradGradGradGradGradGradGradGradGradGradGradGradGrad
Optimisation of isomer 2
Isomer 2 was then optimised under the same conditions using the LanL2DZ basis set, where a tight convergence criteria was used together with the keywords "int=ultrafine". The log file for this optimisation can be found here. File:QLOISOMER2OPTIMISATION.LOG

| File Name | qloisomer2optmisation |
|---|---|
| File Type | .log |
| Calculation Type | FOPT |
| Calculation Method | RB3LYP |
| Basis Set | LANL2DZ |
| Charge | 0 |
| Spin | Singlet |
| E(RB3LYP) | -90.47 au |
| RMS GRADIENT NORM | 0.000000095 au |
| Imaginary Freq | 0 |
| Dipole Moment | 0.84 Debye |
| Point Group | C1 |
The gradient is close to zero (0.000000095 au), which indicates that optimisation has occurred. This was further confirmed by the convergence of all forces in the table below.
Item               Value     Threshold  Converged?
 Maximum Force            0.000001     0.000015     YES
 RMS     Force            0.000000     0.000010     YES
 Maximum Displacement     0.000034     0.000060     YES
 RMS     Displacement     0.000009     0.000040     YES
 Predicted change in Energy=-1.954841D-11
 Optimization completed.
    -- Stationary point found.
                           ----------------------------
                           !   Optimized Parameters   !
                           ! (Angstroms and Degrees)  !
 --------------------------                            --------------------------
 ! Name  Definition              Value          Derivative Info.                !
 --------------------------------------------------------------------------------
 ! R1    R(1,3)                  2.5825         -DE/DX =    0.0                 !
 ! R2    R(1,4)                  2.4113         -DE/DX =    0.0                 !
 ! R3    R(1,6)                  2.1783         -DE/DX =    0.0                 !
 ! R4    R(1,7)                  2.1789         -DE/DX =    0.0                 !
 ! R5    R(2,3)                  2.5996         -DE/DX =    0.0                 !
 ! R6    R(2,4)                  2.4251         -DE/DX =    0.0                 !
 ! R7    R(2,5)                  2.1818         -DE/DX =    0.0                 !
 ! R8    R(2,8)                  2.337          -DE/DX =    0.0                 !
 ! A1    A(3,1,4)               87.5617         -DE/DX =    0.0                 !
 ! A2    A(3,1,6)              110.4442         -DE/DX =    0.0                 !
 ! A3    A(3,1,7)              110.2081         -DE/DX =    0.0                 !
 ! A4    A(4,1,6)              110.0483         -DE/DX =    0.0                 !
 ! A5    A(4,1,7)              109.8039         -DE/DX =    0.0                 !
 ! A6    A(6,1,7)              123.0724         -DE/DX =    0.0                 !
 ! A7    A(3,2,4)               86.8844         -DE/DX =    0.0                 !
 ! A8    A(3,2,5)              109.4287         -DE/DX =    0.0                 !
 ! A9    A(3,2,8)              111.0149         -DE/DX =    0.0                 !
 ! A10   A(4,2,5)              109.1805         -DE/DX =    0.0                 !
 ! A11   A(4,2,8)              110.3894         -DE/DX =    0.0                 !
 ! A12   A(5,2,8)              123.7757         -DE/DX =    0.0                 !
 ! A13   A(1,3,2)               88.6256         -DE/DX =    0.0                 !
 ! A14   A(1,4,2)               96.9225         -DE/DX =    0.0                 !
 ! D1    D(4,1,3,2)             -0.5604         -DE/DX =    0.0                 !
 ! D2    D(6,1,3,2)            109.9461         -DE/DX =    0.0                 !
 ! D3    D(7,1,3,2)           -110.7836         -DE/DX =    0.0                 !
 ! D4    D(3,1,4,2)              0.6049         -DE/DX =    0.0                 !
 ! D5    D(6,1,4,2)           -110.2881         -DE/DX =    0.0                 !
 ! D6    D(7,1,4,2)            111.2234         -DE/DX =    0.0                 !
 ! D7    D(4,2,3,1)              0.5575         -DE/DX =    0.0                 !
 ! D8    D(5,2,3,1)           -108.6931         -DE/DX =    0.0                 !
 ! D9    D(8,2,3,1)            111.2201         -DE/DX =    0.0                 !
 ! D10   D(3,2,4,1)             -0.6013         -DE/DX =    0.0                 !
 ! D11   D(5,2,4,1)            108.8965         -DE/DX =    0.0                 !
 ! D12   D(8,2,4,1)           -111.8807         -DE/DX =    0.0                 !
 --------------------------------------------------------------------------------
 GradGradGradGradGradGradGradGradGradGradGradGradGradGradGradGradGradGrad
Optimisation of isomer 3
Isomer 3 was optimised using the LanL2DZ basis set on Gaussview 5.0, where again a tight convergence criteria was used together with the keywords "int=ultrafine". The log file for this calculation can be found here. File:QLOISOMER31.LOG

| File Name | isomer31 |
|---|---|
| File Type | .log |
| Calculation Type | FOPT |
| Calculation Method | RB3LYP |
| Basis Set | LANL2DZ |
| Charge | 0 |
| Spin | Singlet |
| E(RB3LYP) | -90.47 au |
| RMS GRADIENT NORM | 0.000000084 au |
| Imaginary Freq | 0 |
| Dipole Moment | 0.89 Debye |
| Point Group | C2v |
The gradient is close to zero (0.000000084 au), which indicates that optimisation has occurred. This was further confirmed by the convergence of all forces in the table below.
Item               Value     Threshold  Converged?
 Maximum Force            0.000002     0.000015     YES
 RMS     Force            0.000001     0.000010     YES
 Maximum Displacement     0.000006     0.000060     YES
 RMS     Displacement     0.000002     0.000040     YES
 Predicted change in Energy=-5.876359D-12
 Optimization completed.
    -- Stationary point found.
                           ----------------------------
                           !   Optimized Parameters   !
                           ! (Angstroms and Degrees)  !
 --------------------------                            --------------------------
 ! Name  Definition              Value          Derivative Info.                !
 --------------------------------------------------------------------------------
 ! R1    R(1,3)                  2.4361         -DE/DX =    0.0                 !
 ! R2    R(1,4)                  2.4362         -DE/DX =    0.0                 !
 ! R3    R(1,5)                  2.3386         -DE/DX =    0.0                 !
 ! R4    R(1,6)                  2.3386         -DE/DX =    0.0                 !
 ! R5    R(2,3)                  2.407          -DE/DX =    0.0                 !
 ! R6    R(2,4)                  2.407          -DE/DX =    0.0                 !
 ! R7    R(2,7)                  2.1768         -DE/DX =    0.0                 !
 ! R8    R(2,8)                  2.1768         -DE/DX =    0.0                 !
 ! A1    A(3,1,4)               84.7937         -DE/DX =    0.0                 !
 ! A2    A(3,1,5)              109.9984         -DE/DX =    0.0                 !
 ! A3    A(3,1,6)              109.9985         -DE/DX =    0.0                 !
 ! A4    A(4,1,5)              109.9971         -DE/DX =    0.0                 !
 ! A5    A(4,1,6)              109.9972         -DE/DX =    0.0                 !
 ! A6    A(5,1,6)              124.8274         -DE/DX =    0.0                 !
 ! A7    A(3,2,4)               86.0688         -DE/DX =    0.0                 !
 ! A8    A(3,2,7)              110.3414         -DE/DX =    0.0                 !
 ! A9    A(3,2,8)              110.3416         -DE/DX =    0.0                 !
 ! A10   A(4,2,7)              110.3427         -DE/DX =    0.0                 !
 ! A11   A(4,2,8)              110.3429         -DE/DX =    0.0                 !
 ! A12   A(7,2,8)              123.2051         -DE/DX =    0.0                 !
 ! A13   A(1,3,2)               94.5688         -DE/DX =    0.0                 !
 ! A14   A(1,4,2)               94.5687         -DE/DX =    0.0                 !
 ! D1    D(4,1,3,2)              0.0009         -DE/DX =    0.0                 !
 ! D2    D(5,1,3,2)           -109.4052         -DE/DX =    0.0                 !
 ! D3    D(6,1,3,2)            109.4072         -DE/DX =    0.0                 !
 ! D4    D(3,1,4,2)             -0.0009         -DE/DX =    0.0                 !
 ! D5    D(5,1,4,2)            109.4065         -DE/DX =    0.0                 !
 ! D6    D(6,1,4,2)           -109.4085         -DE/DX =    0.0                 !
 ! D7    D(4,2,3,1)             -0.0009         -DE/DX =    0.0                 !
 ! D8    D(7,2,3,1)            110.2513         -DE/DX =    0.0                 !
 ! D9    D(8,2,3,1)           -110.2533         -DE/DX =    0.0                 !
 ! D10   D(3,2,4,1)              0.0009         -DE/DX =    0.0                 !
 ! D11   D(7,2,4,1)           -110.25           -DE/DX =    0.0                 !
 ! D12   D(8,2,4,1)            110.252          -DE/DX =    0.0                 !
 --------------------------------------------------------------------------------
 GradGradGradGradGradGradGradGradGradGradGradGradGradGradGradGradGradGrad
Optimisation of isomer 4
Finally, isomer 4 was optimised using the LanL2DZ basis set where a tight convergence criteria was used together with the keywords "int=ultrafine". The log file can be found here. File:QLOISOMER4.LOG
| File Name | qloisomer4 |
|---|---|
| File Type | .log |
| Calculation Type | FOPT |
| Calculation Method | RB3LYP |
| Basis Set | LANL2DZ |
| Charge | 0 |
| Spin | Singlet |
| E(RB3LYP) | -90.47 au |
| RMS GRADIENT NORM | 0.000000097 au |
| Imaginary Freq | 0 |
| Dipole Moment | 0.96 Debye |
| Point Group | C2v |
The gradient is very small and is close to zero (0.000000097 au), which indicates that optimisation has occurred. This was further confirmed by the convergence of all forces in the table below.
Item               Value     Threshold  Converged?
 Maximum Force            0.000002     0.000015     YES
 RMS     Force            0.000001     0.000010     YES
 Maximum Displacement     0.000007     0.000060     YES
 RMS     Displacement     0.000004     0.000040     YES
 Predicted change in Energy=-3.082294D-12
 Optimization completed.
    -- Stationary point found.
                           ----------------------------
                           !   Optimized Parameters   !
                           ! (Angstroms and Degrees)  !
 --------------------------                            --------------------------
 ! Name  Definition              Value          Derivative Info.                !
 --------------------------------------------------------------------------------
 ! R1    R(1,3)                  2.4212         -DE/DX =    0.0                 !
 ! R2    R(1,4)                  2.4213         -DE/DX =    0.0                 !
 ! R3    R(2,3)                  2.4213         -DE/DX =    0.0                 !
 ! R4    R(2,4)                  2.4212         -DE/DX =    0.0                 !
 ! R5    R(3,5)                  2.3352         -DE/DX =    0.0                 !
 ! R6    R(3,8)                  2.1797         -DE/DX =    0.0                 !
 ! R7    R(4,6)                  2.3352         -DE/DX =    0.0                 !
 ! R8    R(4,7)                  2.1797         -DE/DX =    0.0                 !
 ! A1    A(3,1,4)               94.566          -DE/DX =    0.0                 !
 ! A2    A(3,2,4)               94.5659         -DE/DX =    0.0                 !
 ! A3    A(1,3,2)               85.4221         -DE/DX =    0.0                 !
 ! A4    A(1,3,5)              110.7247         -DE/DX =    0.0                 !
 ! A5    A(1,3,8)              109.6585         -DE/DX =    0.0                 !
 ! A6    A(2,3,5)              110.7232         -DE/DX =    0.0                 !
 ! A7    A(2,3,8)              109.657          -DE/DX =    0.0                 !
 ! A8    A(5,3,8)              123.9638         -DE/DX =    0.0                 !
 ! A9    A(1,4,2)               85.4222         -DE/DX =    0.0                 !
 ! A10   A(1,4,6)              110.7232         -DE/DX =    0.0                 !
 ! A11   A(1,4,7)              109.657          -DE/DX =    0.0                 !
 ! A12   A(2,4,6)              110.7247         -DE/DX =    0.0                 !
 ! A13   A(2,4,7)              109.6585         -DE/DX =    0.0                 !
 ! A14   A(6,4,7)              123.9637         -DE/DX =    0.0                 !
 ! D1    D(4,1,3,2)              1.1698         -DE/DX =    0.0                 !
 ! D2    D(4,1,3,5)            111.6113         -DE/DX =    0.0                 !
 ! D3    D(4,1,3,8)           -108.0837         -DE/DX =    0.0                 !
 ! D4    D(3,1,4,2)             -1.1699         -DE/DX =    0.0                 !
 ! D5    D(3,1,4,6)           -111.6129         -DE/DX =    0.0                 !
 ! D6    D(3,1,4,7)            108.0852         -DE/DX =    0.0                 !
 ! D7    D(4,2,3,1)             -1.1699         -DE/DX =    0.0                 !
 ! D8    D(4,2,3,5)           -111.6129         -DE/DX =    0.0                 !
 ! D9    D(4,2,3,8)            108.0852         -DE/DX =    0.0                 !
 ! D10   D(3,2,4,1)              1.1698         -DE/DX =    0.0                 !
 ! D11   D(3,2,4,6)            111.6114         -DE/DX =    0.0                 !
 ! D12   D(3,2,4,7)           -108.0838         -DE/DX =    0.0                 !
 --------------------------------------------------------------------------------
 GradGradGradGradGradGradGradGradGradGradGradGradGradGradGradGradGradGrad
The symmetry of all four isomers are shown in the tables above. A C1 symmetry is also known as the identity operation (E), this operation returns the molecule back to its original orientation, hence it is trivial. The symmetry associated with isomers 3 and 4 is C2v, which has the following symmetry elements E, C2 and two vertical mirror planes. This can be rationalised by visualising the molecule in three dimensions.
It was noted that the disappearance of the bridging bonds in diagrams 13 to 16 was due to the fact that the optimisations for these bonds fell outside of the parameters set in Gaussview before the molecules were optimised.
Energies of the four Al2Cl4Br2 isomers
| Isomer 1 | -237510 kJ mol-1 |
|---|---|
| Isomer 2 | -237520 kJ mol-1 |
| Isomer 3 | -237540 kJ mol-1 |
| Isomer 4 | -237540 kJ mol-1 |
As shown in table 28 above, the most stable isomer is isomer 3. All 4 isomers exhibit two 3-centre-4-electron bridging bond. 3-centre-4-electron bonds are known to be weak because four electrons are shared over three atoms instead of a conventional bond, where two electrons are shared between two atoms in a bond. Therefore, these bridging bonds are known to be weaker when compared to terminal bonds.
The isomers of Al2Cl4Br2 tend to be most stable when the Br atoms occupy terminal positions. Al-Cl bonds are shorter and stronger when compared to Al-Br bonds, which are longer and weaker (shown in tables 22 and 24 above). Br has a larger atomic radii than Cl as Br has more electrons when compared to Cl. Therefore Br must be held further away from Al than Cl so as to avoid repulsive interactions with the Al atom. The strength of the Al-Cl-Al bridging bond contributes to the increased stability of both isomers 3 and 4 as compared to isomers 1 and 2, where Br atoms are in bridging positions. The strength of these bridging bonds are vital as these bonds hold the structure of the dimer in place.
Dissociation energy of isomer 3
The dissociation of Al2Cl4Br2 (Isomer 3) into its respective monomers is shown in the following equation:
The energies of each molecule in this reaction are shown below:
The energy difference is given by ΔE = 2E(AlCl2Br)-E(Al2Cl4Br2), where ΔE is equal to 0.03 au which is equivalent to 80 kJ mol-1. Hence the dissociation energy is 80 kJ mol-1.
The difference in energy indicates that dissociation of isomer 3 is not favourable as the monomer AlCl2Br is less stable as compared to the Al2Cl4Br2 isomer, hence there is no driving force for the dissociation to occur spontaneously.
Frequency Analysis of all isomers
A frequency analysis was done using all four LanL2DZ optimised Al2Cl4Br2 isomers on Gaussian 5.0.
Frequency Analysis of isomer 1
The log file for the frequency analysis of isomer 1 can be found here. File:QLOAL2CL4BR2FREQUENCY2.LOG
| File Name | QLOAL2CL4BR2FREQUENCY2 |
|---|---|
| File Type | .log |
| Calculation Type | FREQ |
| Calculation Method | RB3LYP |
| Basis Set | LANL2DZ |
| Charge | 0 |
| Spin | Singlet |
| E(RB3LYP) | -90.46 a.u. |
| RMS GRADIENT NORM | 0.000000200 a.u. |
| Imaginary Freq | 0 |
| Dipole Moment | 0.00 Debye |
| Point Group | D2h |
Low frequencies ---   0  0   0  0    0    0
 Low frequencies ---   15.8928   52.6131   72.9783
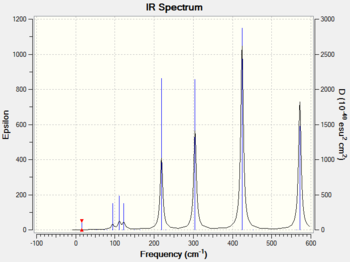
The frequency analysis was carried out correctly as there was no observable change in the energy of the molecule. A minimum was obtained as there are no negative frequencies. An IR spectrum of isomer 1 was computed as a result of the frequency analysis and the result is shown in diagram 17 below.
Frequency analysis of isomer 2
The log file for this analysis can be found here. File:QLOISOMER2FREQ.LOG
| File Name | QLOISOMER2FREQ |
|---|---|
| File Type | .log |
| Calculation Type | FREQ |
| Calculation Method | RB3LYP |
| Basis Set | LANL2DZ |
| Charge | 0 |
| Spin | Singlet |
| E(RB3LYP) | -90.47 a.u. |
| RMS GRADIENT NORM | 0.000000095 a.u. |
| Imaginary Freq | 0 |
| Dipole Moment | 0.84 Debye |
| Point Group | C1 |
Low frequencies ---    0    0    0    1    1    2
 Low frequencies ---   16.9743   46.4585   71.6723
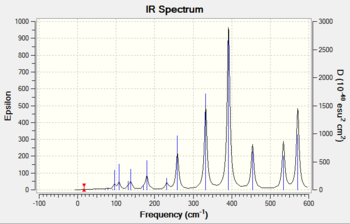
The frequency analysis was carried out correctly as there was no observable change in the energy of the molecule. A minimum was obtained as there are no negative frequencies. An IR spectrum of isomer 2 was computed as a result of the frequency analysis and the result is shown in diagram 18 below.
Frequency analysis of isomer 3
The log file for this analysis can be found here. File:QLOISOMER31FREQ.LOG
| File Name | QLOISOMER31FREQ |
|---|---|
| File Type | .log |
| Calculation Type | FREQ |
| Calculation Method | RB3LYP |
| Basis Set | LANL2DZ |
| Charge | 0 |
| Spin | Singlet |
| E(RB3LYP) | -90.47 a.u. |
| RMS GRADIENT NORM | 0.000000085 a.u. |
| Imaginary Freq | 0 |
| Dipole Moment | 0.89 Debye |
| Point Group | C2v |
Low frequencies ---   0    0   0    1    1    2
 Low frequencies ---   18.2819   42.1474   64.3213
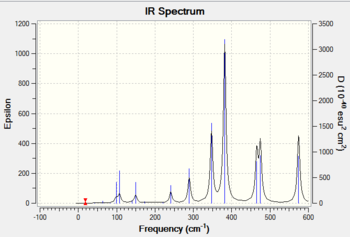
The frequency analysis was carried out correctly as there was no observable change in the energy of the molecule. A minimum was obtained as there are no negative frequencies. An IR spectrum of isomer 3 was computed as a result of the frequency analysis and the result is shown in diagram 19 below.
Frequency analysis of isomer 4
The log file for this analysis can be found here. File:QLOISOMER4FREQ.LOG
| File Name | QLOISOMER4FREQ |
|---|---|
| File Type | .log |
| Calculation Type | FREQ |
| Calculation Method | RB3LYP |
| Basis Set | LANL2DZ |
| Charge | 0 |
| Spin | Singlet |
| E(RB3LYP) | -90.47 a.u. |
| RMS GRADIENT NORM | 0.000000097 a.u. |
| Imaginary Freq | 0 |
| Dipole Moment | 0.96 Debye |
| Point Group | C2v |
Low frequencies ---   0    0    0    1    2    3
 Low frequencies ---   17.4807   42.2309   69.7909
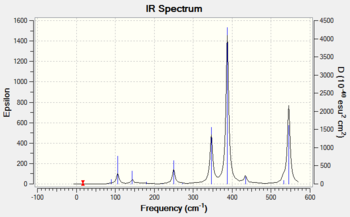
The frequency analysis was carried out correctly as there was no observable change in the energy of the molecule. A minimum was obtained as there are no negative frequencies. An IR spectrum of isomer 4 was computed as a result of the frequency analysis and the result is shown in diagram 20 below.
Discussion of the computed IR spectra of all four isomers
An IR band is only active when absorption of infrared light results in a change in the overall dipole moment of the molecule. The intensity of these bands are directly related to the change in dipole moment, where the more polar the bond, the more intense the IR band will appear on the spectrum. Vibrations involving symmetrical bonds are said to be IR inactive as it does not lead to a change in the overall dipole moment of the molecule.
Isomer 2 has a C1 symmetry, which is also known as the identity operation (E). This operation returns the molecule back to its original orientation which makes this molecule asymmetric. This asymmetric property explains why this isomer produced an IR spectrum with the most number of peaks as compared to the other isomers (1,3 and 4).
All four isomers here are non-linear and which means they have 3N-6 vibrational degrees of freedom. However, as shown in diagrams 17-20 above, the number of peaks in each IR spectrum are less than the number of vibrational modes (18) in each isomer. This can be attributed to the fact that certain vibrational modes are degenerate or have the same energy, which accounts for the fewer number of peaks seen in diagrams 17-20.
The four isomers have different point groups as shown in the previous section, which explains why the IR spectra of all four isomers appear different. Different point groups will have vibrations with different symmetries, which will affect both the frequency (or energy) and the intensity of the band in IR spectrum.
Discussion of the Al-Br stretching vibrations
In this section, comparisons are made between similar vibrational modes of different isomers. Only key vibrational modes are considered here.
Vibrational mode 13 in isomer 1 has an intensity of zero as it is an IR inactive stretch. There was no observable change in dipole moment as the vibrational mode is symmetrical as shown in the table above.
Vibrational modes (12 and 13) in isomer 1 has bridging Br atoms which exhibits a lower frequency when compared to vibrational modes (12 and 16) in isomer 4, which has terminal Br atoms. This could be rationalised by taking into account the strength of terminal Al-Br bonds which are stronger than the electron deficient bridging three-centre-four-electron Al-Br-Al bonds.
Vibrational mode 13 in isomer 1 has bridging Br atoms which has weak Al-Br-Al bridging bonds, hence this vibrational mode has a lower frequency when compared to vibrational mode 16 in isomer 3. This isomer contains terminal Al-Br bonds which are stronger and therefore it has a higher frequency vibrational mode even though both vibrational modes are similar in terms of the motion of all the atoms in the molecule.
The heavy atom effect also plays a part in the frequency of the vibrational modes. A heavier atom such as Br will cause the bond to absorb IR light at a lower frequency. This heavy atom effect was explained earlier in this report using the following equations:

where k is the spring constant for the Al-Br bond, c is the speed of light and μ is the reduced mass of the Al-Br bond, which is given by equation 2 below:

where mA is the mass of atom A and mB is mass of atom B.
As shown by the two equations above, a heavy atom will lead to an increase in the reduced mass which is inversely proportional to the frequency of the vibration.
MO calculations
MO calculations were carried out on the lowest energy isomer, which in this case is isomer 3. The .chk file from the optimisation of isomer 3 was used together with the keywords "pop=full" for NBO analysis. The file for this analysis can be found here. File:Qloisomer31.chk
In this MO calculation, only non-core orbitals are visualised and out of these orbitals, 5 MOs were chosen ranging from highly bonding to highly antibonding were chosen for further analysis. These MOs are shown in the diagrams below.


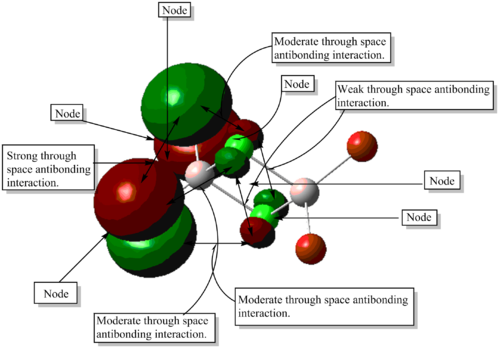


MO calculations of isomer 3 indicated the presence of 116 frozen core electrons, where 24 MOs were fully occupied by a pair of electrons with opposite spins due to Hund's rule and the Pauli exclusion principle. A brief visualisation of all 24 MOs including both core and non-core MOs showed the absence of bonding or antibonding interactions between the AOs of Al. It was concluded that an Al-Al bond does not exist, as evidenced by the presence of a node between two Al AOs in diagram 26.
Both bonding and antibonding interactions in the 5 non-core MOs shown above were mostly through space interactions. Which suggests that the AlCl4Br2 isomer is held together by these moderate to weak through space interactions. When these interactions are taken into account as a whole, they are considerably strong which prevents the isomer from breaking up into AlCl2Br monomers.
There are no pi-bonds present in this isomer, as evidenced by the MO calculations and the MOs shown in diagrams 21-25 above. There were no sideways overlap of p-orbitals between adjacent atoms in the dimer in both core and non-core MOs. However, there are some form of interaction between the p-orbitals between terminal Cl and Br atoms as shown above, these interactions are also known as pi-type interactions. Pi-type interactions are vital to biological systems where common pi-interactions include metal-pi interactions and polar-pi interactions.
Larger than usual energy gaps (approximately 0.20 au) were observed between non-core MOs 24-25 and between core MOs. This suggests MO mixing might have occurred. MO mixing occurs when the MOs involved in mixing have the same symmetry and are close in energy. However, this cannot be verified as the MO calculations alone did not provide the symmetry of each individual MO.
Summary
In general, the computed properties of molecules investigated in both parts 1 and 2 using Gaussview 5.0 were in good agreement with the experimentally reported values and it was observed that using higher basis sets such as LanL2DZ led to better results. However, it was not possible to determine the accuracy of MO theory in the prediction of real MOs of more complex molecules as the molecules analysed here are rather simple (i.e. BH3 and NH3). Further analysis of more complex molecules could have been done as part of this experiment to determine the efficacy of this theory.
References
- ↑ 1.0 1.1 K. Kawaguchi , J. Chem. Phys., 1992, 96, 3411
- ↑ 2.0 2.1 D. Oxtoby, H. Gillis and A. Campion , Principles of Modern Chemistry, 2011, 274
- ↑ Q. Lo, Gaussian Job Archive Br3Ga1, 2014 ; DOI:10042/27634
- ↑ C. Da Silva, O. Proux, J-L. Hazemann, J. James-Smith, D. Testemale and T. Yamaguchi , J. Mol. Liq., 2008, 147, 83-95.
- ↑ 5.0 5.1 W. M. Hayes and D. R. Lide, CRC Handbook of Chemistry and Physics, 2013, 94.
- ↑ Q. Lo,Gaussian Job Archive B1Br3, 2014 ; DOI:10042/27636
- ↑ 7.0 7.1 G. Santiso-Quinones and I. Krossing, Z. Anorg. Allg. Chem., 2008, 634, 704-707.
- ↑ T. L. Cottrell , The Strength of Chemical Bonds, Butterworths, 1958, 2
- ↑ S. W. Benson , J. Chem. Educ., 1965, 42, 502.
- ↑ P. Atkins and J. de Paula, Atkins' Physical Chemistry, Oxford University Press, 2009, 9.
- ↑ J. W. Ochterski, Vibrational Analysis in Gaussian, 1999.
- ↑ A. Haaland , Angew. Chem. Int. Ed. Engl., 1989, 28, 992-1007.


