Rep:Mod:inorganicmh4412
Abstract
The computational experiment was done in two parts. The first included perfoming calculations on EX3 species. Structures of BH3, GaBr3, BBr3 were first optimised; then the frequency analysis performed - vibrations and IR spectra were predicted for BH3 and GaBr3. MOs were visualised for a molecule BH3 and finally, a molecule of NH3 was fully analysed (optimisation, frequency, NBO analysis). This made it possible to construct a molecule of BH3NH3 and calculate the strength of the B-N bond.
In the second part, a molecule of benzene was compared with its analogues - boratabenzene, pyridinium and borazine. Full analysis was done on all 4 molecules, and with the aid of a constructed MO diagram for benzene, the properties of the 4 species were analysed and compared on the basis on their MOs and NBO charge distributions.
Introduction
In this experiment, the work was focused first on EX3 species and then on aromaticity - properties of benzene and its analogues. By using Gaussian, energies and structures were calculated and visualised.
By using computational methods, molecules can be compared in terms of their bond lengths, strengths, and bond angles. Despite the apparent geometrical (and/or chemical) similarities, significant differences arise from different substituents in the molecule. This also gives rise to differences in the molecular vibrational modes and hence IR spectra. Various properties can hence be predicted and explained. Molecular orbital (MO) diagrams are also of huge importance, and being able to produce them using computations is of huge importance in modern science.
The aim of this experiment was to first compute the properties and then make comparisons between 3 EX3 species; namely BH3, GaBr3, and BBr3. In the second part of the experiment, benzene and its 3 analogues - boratabenzene, pyridinium, and borazine - were explored. Both parts hence focused on explaining the differences in bonding and reactivities among the two groups of similar molecules.
Part 1 - EX3 species computational analysis
Optimisation of EX3 species
BH3 optimisation
First of BH3 optimisation was done. Symmetry of the programme-made molecule was broken by changing the bond lengths; then optimisation was done.
Conditions: DFT, B3LYP, 3-21G
Result:
Bond length: 1.19A
Bond angle: 120.0
It can be seen that the symmetry was not correctly calculated (also shown by the data file), as the bond lengths and angles are not exactly the same.
The "optimisation" option gives an interesting insight into the optimisation process. Graphs of the total energy and RMS gradient can be linked to the intermediate structures in the calculation.
The optimisation file is liked to here.
Table 1: BH3 calculation data B3LYP/3-21G
| Summary data | Convergence | Molecule structure | ||
|---|---|---|---|---|
Title Card Required File Name = MH_1bh3opt File Type = .log Calculation Type = FOPT Calculation Method = RB3LYP Basis Set = 3-21G Charge = 0 Spin = Singlet E(RB3LYP) = -26.46226371 a.u. RMS Gradient Norm = 0.00008756 a.u. Imaginary Freq = Dipole Moment = 0.0003 Debye Point Group = CS Job cpu time: 0 days 0 hours 0 minutes 26.0 seconds. |
Item               Value     Threshold  Converged?
 Maximum Force            0.000217     0.000450     YES
 RMS     Force            0.000105     0.000300     YES
 Maximum Displacement     0.000919     0.001800     YES
 RMS     Displacement     0.000441     0.001200     YES
 Predicted change in Energy=-1.635268D-07
 Optimization completed.
    -- Stationary point found.
|
Next, optimisation of the BH3 molecule was attempted using a better basis set.
New conditions: DFT, B3LYP, 3-21G
Result:
Bond length: 1.19A
Bond angle: 120.0
From those values, it can already be seen that a better basis set yields better results, as the bond lengths and angles are more similar than they were after the first calculation.
The optimisation file is liked to here.
Table 2: BH3 calculation data B3LYP/6-31G(d,p)
| Summary data | Convergence | Molecule structure | ||
|---|---|---|---|---|
Title Card Required File Name = MH_1BH3OPT_6-31G File Type = .log Calculation Type = FOPT Calculation Method = RB3LYP Basis Set = 6-31G(d,p) Charge = 0 Spin = Singlet E(RB3LYP) = -26.61532360 a.u. RMS Gradient Norm = 0.00000721 a.u. Imaginary Freq = Dipole Moment = 0.0001 Debye Point Group = CS Job cpu time: 0 days 0 hours 0 minutes 9.0 seconds. |
 Item               Value     Threshold  Converged?
 Maximum Force            0.000012     0.000450     YES
 RMS     Force            0.000008     0.000300     YES
 Maximum Displacement     0.000064     0.001800     YES
 RMS     Displacement     0.000039     0.001200     YES
 Predicted change in Energy=-1.126756D-09
 Optimization completed.
    -- Stationary point found.
|
The following table presents the bond angles and distances for BH3 using the two different computational methods.
Table 3: BH3 bond lengths and angles comparison
| 3-21G | 6-31G | |
|---|---|---|
| Bond lengths (A) | 1.194 | 1.192 |
| Bond angles (degrees) | 120.0 | 120.0 |
At this point, it can be seen that the better level of analysis (the 6-31G method) gives more accurate results, as the values agree to more decimal places.
GaBr3 optimisation
By using pseudopotentials, an optimised structure of GaBr3 was made. The results are as follows:
Result:
Bond lengths: 2.35
Bond angles: 120.0
It can be seen that the symmetry was calculated really well, as the three values for bond lengths and angles all agree in all decimal places given.
The optimisation file is liked to DOI:10042/195204 and here.
Table 4: GaBr3 calculation data B3LYP/LANL2DZ
| Summary data | Convergence | Molecule structure | ||
|---|---|---|---|---|
GaBr3 optimisation using pseudopotentials File Name = MH_2GaBr3opt_finished File Type = .log Calculation Type = FOPT Calculation Method = RB3LYP Basis Set = LANL2DZ Charge = 0 Spin = Singlet E(RB3LYP) = -41.70082770 a.u. RMS Gradient Norm = 0.00000016 a.u. Imaginary Freq = Dipole Moment = 0.0000 Debye Point Group = D3H Job cpu time: 0 days 0 hours 0 minutes 13.4 seconds. |
 Item               Value     Threshold  Converged?
 Maximum Force            0.000000     0.000450     YES
 RMS     Force            0.000000     0.000300     YES
 Maximum Displacement     0.000003     0.001800     YES
 RMS     Displacement     0.000002     0.001200     YES
 Predicted change in Energy=-1.307742D-12
 Optimization completed.
    -- Stationary point found.
|
BBr3 optimisation
By using partial pseudopotentials, an optimised structure of BBr3 was made. The method was B3LYP/6-31G(d,p)LANL2DZ, which means that the B atom was analysed using the 6-31G level, and the heavier, Br atoms, were analysed with pseudopotentials. The results are as follows:
Result:
Bond length: 1.93A
Bond angle: 120.0
It can be seen that the symmetry was calculated pretty well, as the three values for bond lengths and angles are again quite close. They do not entirely agree though, as was the case for GaBr3.
The optimisation file is liked to DOI:10042/195205 and here.
Table 5: BBr3 calculation data (B3LYP/6-31G(d,p)LANL2DZ
| Summary data | Convergence | Molecule structure | ||
|---|---|---|---|---|
BBr3 optimisation File Name = MH_3BBr3opt_finished File Type = .log Calculation Type = FOPT Calculation Method = RB3LYP Basis Set = Gen Charge = 0 Spin = Singlet E(RB3LYP) = -64.43645002 a.u. RMS Gradient Norm = 0.00000565 a.u. Imaginary Freq = Dipole Moment = 0.0003 Debye Point Group = CS Job cpu time: 0 days 0 hours 0 minutes 25.3 seconds. |
 Item               Value     Threshold  Converged?
 Maximum Force            0.000012     0.000450     YES
 RMS     Force            0.000007     0.000300     YES
 Maximum Displacement     0.000048     0.001800     YES
 RMS     Displacement     0.000031     0.001200     YES
 Predicted change in Energy=-7.195256D-10
 Optimization completed.
    -- Stationary point found.
|
Comparison between the 3 EX3 structures
The bond lengths and angles data is summarised in the table below.
Table 6: EX3 bond lengths and angles
| BH3 | BBr3 | GaBr3 | |
|---|---|---|---|
| r(E-X) | 1.19A | 1.93A | 2.35A |
| θ(X-E-X) | 120.0 | 120.0 | 120.0 |
Looking at the table above where the data of the initial calculations is summarized, it can be seen that changing the ligand and the central atom in the EX3 species has a substantial effect on the bond lengths. Despite that, the three different compounds are similar in a sense that they are all trigonal planar (same point group, 33h) and are electron deficient, which influences the full bonding picture in the end.
The bond lengths differ between compounds because of three reasons - because of the different covalent radii, different orbital overlaps and different electronegativities of the atoms. Sums of the covalent radii in the 3 compounds gives a good first approximation to the bond length. It increases, as expected, with the size of the atoms involved in bonding. In BH3, the sum of B and H covalent radii is 84 pm + 31 pm = 115 pm, which agrees quite well with the calculated value of 119 pm. The orbital overlap between the two atoms is fairly good, and hence the bond is also relatively strong. In BBr3, the sum of the radii is 84 pm + 120 pm = 204 pm, which is quite a significant difference from the observed bond length. The experimentally observed shortening of the bond can be explained by invoking the π donation from the Br lone pairs into the empty p orbital on B. This effect happens from all three Br atoms, significantly aleviating the B electron deficiency and shortening the bonds. It can happen and has a fairly strong effect because the orbitals are of similar size.
In GaBr3, the expected value for the bond length is 122 pm + 120 pm = 244 pm. This is again longer than the calculated distance, but it is much less prominent than the prediction/measurement difference in BBr3. This is because Ga is significantly less electron deficient than B and hence the π donation effect is not as strong. Also, the orbital overlab Ga and Br is worse than for B and Br, as the Ga orbitals are more diffuse. Alltogether, this leads to weaker stabilisation and a smaller bond shortening effect.
Questions:
A chemical bond is an attraction between the two atoms that it connects. It is the region of positive overlap between the atomic orbitals of the two atoms to form molecular orbitals. It is an electrostatic force of attraction between the nuclei and the electrons, or a result of a dipole interaction. Different types of bonds are known, depending on how the electrons are shared between the two nuclei. The two most basic types of bonds are ionic (electrons not shared - the compound is a lattice of ions) and covalent (electorns shared). An often "forgotten" type of bonding is the metallic bonding, where the electrons are shared among all the nuclei in the material, not just between two atoms. A chemical bond is basically the state at which the atoms are at the most favourable distance between the two atoms, where the sum of the attractive (electron-nucleus) and repulsive forces (electron-electron and nucleus-nucleus) is at a minimum.
A bond in a simple sense is a representation of the aforementioned electrostatic forces; it is denoted as a line between two atoms, indicating that there is an attraction between them. The strength of the bonds varies greatly with the nature of the two atoms and can be determined either computationally of experimentally (bond dissociation energy), and is inversely proportional to the distance between the two atoms involved in bonding. There is a broad spectrum of bond strengths and the concept of "strong", "medium", and "weak" bonds is somewhat vague, but nevertheless, some compounds can be fitted in those categories. Ionic and metallic bonding are generally stronger than covalent bonding, because of the strong "naked" nature of the ions composing the materials. In terms of the energy however, a strong bond could be classified as a bond, which takes more than 500kJ/mol to break (which then includes most of the ionic substances, and very strong covalent bonds - such as N2 triple bond with 945kJ/mol and N=O (607kJ/mol), P=O (544kJ/mol) double bonds). A medium bond strength could be classified as a bond with bond dissociation energies between 100-500kJ/mol (C-halogen bonds, C-C, C-H bonds etc.), whereas a weak bond is a bond with bond breaking energy lower than 100kJ/mol (in the order of 10s of kJ/mol - hydrogen bonds, van der Waals forces, dispersion interactions etc.) [1].
Having defined bonds as a force of attraction between two atoms at a specific distance, it is quite clear why Gaussian sometimes does not draw bonds. Because it uses pre-defined values for bond lengths and strengths, it may fail to identify some interactions as proper bonds as a result of poor optimisation or simlply because of employing too simple a model.
Frequency Analysis of EX3 species
BH3 frequency analysis
Next, a frequency analysis was done for the BH3 molecule. The D3h symmetry was first imposed on the B3LYP/6-31G optimised molecule; then the frequency calculation was performed at the same level of theory. This yielded the results, shown in table 7; the complete optimisation file is liked to here.
Table 7: BH3 frequency data B3LYP/6-31G(d,p)
| Summary data | Low frequencies |
|---|---|
BH3 frequency File Name = MH_1BH3_FREQUENCY File Type = .log Calculation Type = FREQ Calculation Method = RB3LYP Basis Set = 6-31G(d,p) Charge = 0 Spin = Singlet E(RB3LYP) = -26.61532364 a.u. RMS Gradient Norm = 0.00000524 a.u. Imaginary Freq = 0 Dipole Moment = 0.0000 Debye Point Group = D3H Job cpu time: 0 days 0 hours 0 minutes 19.0 seconds. |
Low frequencies --- -14.4710 -14.4669 -10.7562 -0.0007 0.0169 0.3466 Low frequencies --- 1162.9513 1213.1233 1213.1235 |
The vibrations can then be visaualised using Gaussview. There are 6 different vibration modes; 5 of those are IR active as they involve a change in dipole - the 6th involves a symmetrical stretch along all 3 bonds, which does not produce a change in dipole. It would need to be visualised with Raman spectroscopy. The data obtained is summarised in the table below.
Table 8: Vibration frequencies of BH3
| Wavenumber | Intensity | IR active | Type |
|---|---|---|---|
| 1163 | 93 | Yes | Bend (wag) |
| 1213 | 14 | Yes | Bend (scissoring) |
| 1213 | 14 | Yes | Bend (scissoring) |
| 2583 | 0 | No | Stretch (symmetrical) |
| 2716 | 126 | Yes | Stretch (non-symmetrical) |
| 2716 | 126 | Yes | Stretch (non-symmetrical) |
It can be deducted from the table above that only 3 peaks should be observed in the IR spectrum, since out of 6 vibration frequencies, 2 are degenerate (same energy), and one is not observed in the IR spectrum. This is confirmed by the IR spectrum prediction, plotted by GaussView.

Figure 1: The IR spectrum of frequency optimised BH3.
GaBr3 frequency analysis
The same type of analysis as above was then performed on GaBr3. This produced the results, shown in tables 9 and 10; the complete frequency file is liked to DOI:10042/195254 and here.
Table 9: GaBr3 frequency data B3LYP/LANL2DZ
| Summary data | Low frequencies |
|---|---|
GaBr3 frequency File Name = MH_2GaBr3_frequency_2 File Type = .log Calculation Type = FREQ Calculation Method = RB3LYP Basis Set = LANL2DZ Charge = 0 Spin = Singlet E(RB3LYP) = -41.70082770 a.u. RMS Gradient Norm = 0.00000020 a.u. Imaginary Freq = 0 Dipole Moment = 0.0000 Debye Point Group = D3H Job cpu time: 0 days 0 hours 0 minutes 12.0 seconds. |
Low frequencies --- -1.4878 -0.0015 -0.0002 0.0096 0.6540 0.6540 Low frequencies --- 76.3920 76.3924 99.6767 |
Table 10: Vibration frequencies of GaBr3
| Wavenumber | Intensity | IR active | Type |
|---|---|---|---|
| 76 | 3 | Yes (slight) | Bend (scissoring) |
| 76 | 3 | Yes (slight) | Bend (scissoring) |
| 100 | 9 | Yes (slight) | Bend (wag) |
| 197 | 0 | No | Stretch (symmetrical) |
| 316 | 57 | Yes | Stretch |
| 316 | 57 | Yes | Stretch |
Judging by the above data, it can be predicted that only 3 peaks will be seen in the IR spectrum - 2 sets of vibrations are degenerate, whereas one is IR inactive. In this respect, the vibration analysis yields similar results to BH3, as the two molecules have the same point group.
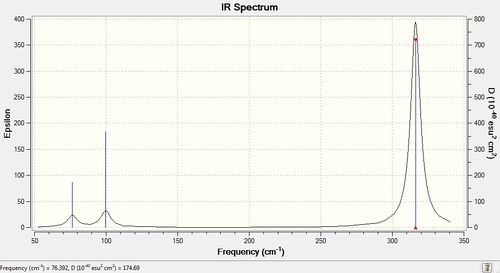
Figure 2: The IR spectrum of frequency optimised NH3.
Despite the two molecules sharing the point group and hence have a similar set of vibrations (in a sense that 2 sets of degenerate vibrations and an IR inactive vibration exist), they are markedly different. The frequencies of vibrations differ hugely, which is a consequence of the atoms involved in each of the molecules. The reduced mass and the lengths of the bonds are different, giving rise to different frequencies. Because the atoms are heavier in GaBr3, the reduced mass is higher, resulting in a lower vibration frequency for the vibrations. This arises from the following relation:
v=(1/2π)*sqrt(k/μ)
Where v is the frequency of vibration, k is the bond force constant and μ is the reduced mass.
The intensities of the vibrations differ as well; in the case of GaBr3, they are much smaller. This is because the derivatives of the molecular dipoles are smaller in the case of GaBr3.
An interesting point here is also that the vibrational modes have changed their order - they used to be wag (intense)-degenerate scissoring (less intense) in BH3, which changed to degenerate scissoring (intense)-wag (less intense) in GaBr3. The A2" umbrella motion (the wag) has also undergone a peculiar change - in BH3, the displacement vectors are large for the H atoms (for the substituents), whereas the central atoms basically stays still throughout the vibration. In GaBr3, it is exactly the opposite - it is actually the central Ga atom that is undergoing a significant displacement change, whereas the substituents (the Br atoms) are nearly standing still throughout the vibration. This is because of the relative atomic masses; it seems that the lighter of the atoms vibrates in the wag motion (H in BH3 and Br in GaBr3).
Questions:
In terms of the analysis of the results of computations, it is important that the same method and basis set are used to produce comparable results. This is because large differences between the calculated energies can arise because of the different levels of accuracy, used in the different methods. The energy values calculated with any method are not absolute, so to provide meaningful analysis, only the relative energies can be used.
The purpose of carrying out frequency calculations is to confirm that the optimised structure is indeed a minimum. Because the calculation is searching for a point of the energy curve where the gradient is zero, either a maximum (transition state - not desired) or a minimum (desired) can be identified. The frequency values, if all positive, confirm that the steructure is a minimum, as negative (imaginary) frequencies appear in the TS structures. The low frequencies are also important; they represent the micro distortions in the optimised structure. The frequencies shown there are the result of various rotational and transnational modes.
Molecular orbitals of BH3
A population calculation of the MOs was done for BH3; the B3LYP/6-31G optimised file was used as the starting point. The complete population computation can be found here DOI:10042/195230 .
A MO diagram was then constructed; shown below. The computed shapes of the MOs are shown on the diagram next to the LCAO-predicted figures.
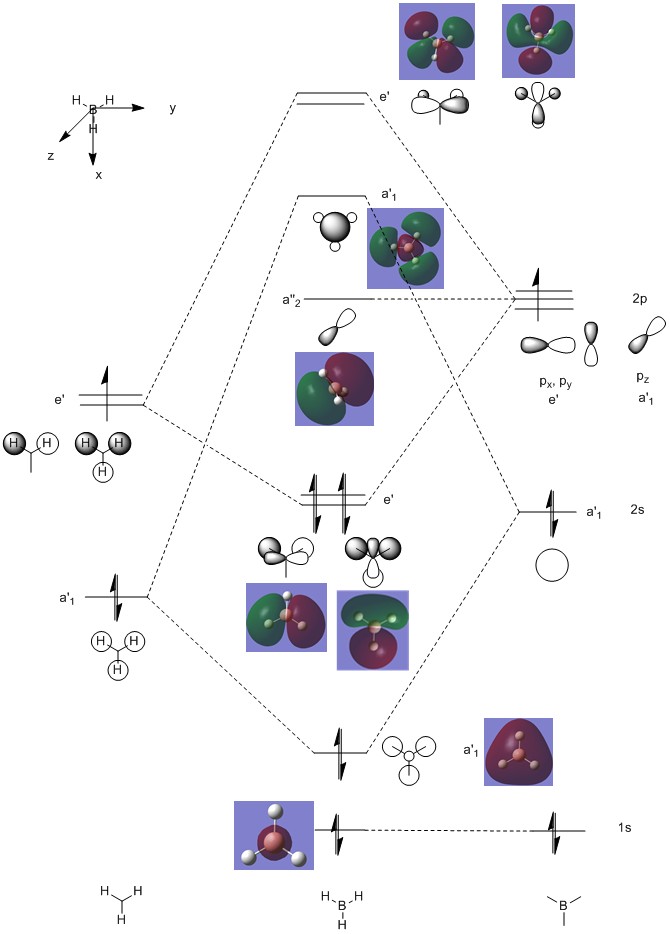
Figure 3: The MO diagram of BH3.
In the above diagram, it can be seen that the 1s orbital of B is non-bonding as it is too low in energy to react with the H3 fragment. The electron density is therefore entirely on B in that case. Only the B 2s and 2p orbitals are high enough in energy to react. It can be seen that the bonding orbitals consist mostly of the H3 orbitals, as those lie lower in energy than the B orbitals.
The non bonding orbital consits of the B pz orbital, as no orbital on the H3 fragment has an a2 symmetry. Above that, two anti-bonding orbitals can be seen. Those are located mostly on B; the reverse of the previous situation where most of the electron density was on H3.
It is quite interesting to see the actual pictures of the MOs in a molecule. Comparing the computed pictures to the LCAO predicted figures, it can be seen that the LCAO approach is remarkably accurate. It successfully predicts the origin of electron density (and hence indicates where the electron density will lie in a bonded situation), as well as the shapes of the orbitals. All of the computed orbitals can be easily matched in shape to the predicted ones, even though that the shape prediciton gets slightly worse as the higher energy antibonding orbitals are constructed. This can be attributed to the fact that because the orbitals do not match, they begin to deform so as to minimise the unfavourable interactions between them. This brings about changes in the shape that LCAO cannot really account for. Nevertheless, it is still a really good way of prediciting the MO shapes and is very useful for modelling bonding and constructing diagrams, such as the one above.
NH3 optimisation, frequency and population analysis
A full analysis of NH3 was performed here. The data is shown below in several tables. The complete optimisation file is liked to here.
Table 11: NH3 calculation data B3LYP/6-31G(d,p)
| Summary data | Convergence | Molecule structure | ||
|---|---|---|---|---|
Title Card Required File Name = MH_5NH3_opt File Type = .log Calculation Type = FOPT Calculation Method = RB3LYP Basis Set = 6-31G(d,p) Charge = 0 Spin = Singlet E(RB3LYP) = -56.55776873 a.u. RMS Gradient Norm = 0.00000323 a.u. Imaginary Freq = Dipole Moment = 1.8465 Debye Point Group = C3V Job cpu time: 0 days 0 hours 0 minutes 14.0 seconds. |
       Item               Value     Threshold  Converged?
 Maximum Force            0.000006     0.000450     YES
 RMS     Force            0.000004     0.000300     YES
 Maximum Displacement     0.000012     0.001800     YES
 RMS     Displacement     0.000008     0.001200     YES
 Predicted change in Energy=-9.844527D-11
 Optimization completed.
    -- Stationary point found.
|
Frequency calculation was performed after optimisation to confirm the minimum. The complete frequency file is liked to here.
Table 12: NH3 frequency data B3LYP/6-31G(d,p)
| Summary data | Low frequencies |
|---|---|
Nh3 frequency File Name = MH_5NH3_frequency File Type = .log Calculation Type = FREQ Calculation Method = RB3LYP Basis Set = 6-31G(d,p) Charge = 0 Spin = Singlet E(RB3LYP) = -56.55776872 a.u. RMS Gradient Norm = 0.00000322 a.u. Imaginary Freq = 0 Dipole Moment = 1.8465 Debye Point Group = C3 Job cpu time: 0 days 0 hours 0 minutes 7.0 seconds. |
Low frequencies --- -0.0138 -0.0026 -0.0009 7.0783 8.0932 8.0937 Low frequencies --- 1089.3840 1693.9368 1693.9368 |
Again, the vibrations were visualised. There are 6 distinct ones, all of which are theoretically IR active because the molecule is not as symmetrical as the previous trigonal planar ones. However, the intensity of vibrations is so low for the 3 vibrations with the highest frequency (3461, 3590 cm-1), that only 2 peaks are expected in the IR spectrum (as the vibrations at 1694 are degenerate).
Table 13: Vibration frequencies of NH3
| Wavenumber | Intensity | IR active | Type |
|---|---|---|---|
| 1089 | 145 | Yes | Bend (wag) |
| 1694 | 14 | Yes | Bend (scissoring) |
| 1694 | 14 | Yes | Bend (scissoring) |
| 3461 | 1 | Yes (slight) | Stretch (symmetrical) |
| 3590 | 0 | No | Stretch |
| 3590 | 0 | No | Stretch |
The IR spectrum confirms the prediciton about only 2 peaks being observed.
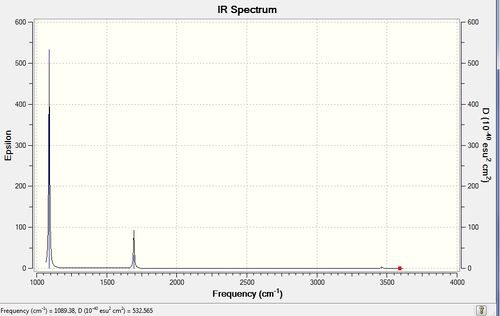
Figure 4: The IR spectrum of frequency optimised NH3.
After the frequency analysis, the population calculations were performed. The complete population file is liked to here.
NBO analysis of NH3
Next, the NBO analysis was done. The charge distribution is shown in the figure below.
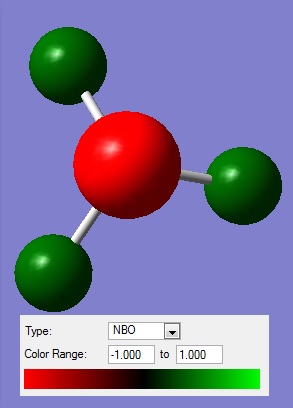
Figure 5: The charge distribution of NH3.
The actual charge numbers are:
H atoms: +0.375
N atom: -1.125
A lot of interesting information can also be found if one looks into the full File of the calculation. Bonding in the compound is described in the "Bond orbital/ Coefficients/ Hybrids" titled section; it can be seen that NH3 forms 3 2 electron-2 centre bonds, which are 69 % located on N. N forms sp3 hybridised orbitals; which are 24.86% s, 75.05 % p in composition. H orbitals are entirely s, 31 % of the electron density is located on them.
 (Occupancy)   Bond orbital/ Coefficients/ Hybrids
 ---------------------------------------------------------------------------------
     1. (1.99909) BD ( 1) N   1 - H   2
                ( 68.83%)   0.8297* N   1 s( 24.86%)p 3.02( 75.05%)d 0.00(  0.09%)
                                            0.0001  0.4986  0.0059  0.0000  0.0000
                                            0.0000  0.8155  0.0277 -0.2910  0.0052
                                            0.0000  0.0000 -0.0281 -0.0087  0.0014
                ( 31.17%)   0.5583* H   2 s( 99.91%)p 0.00(  0.09%)
                                            0.9996  0.0000  0.0000 -0.0289  0.0072
     2. (1.99909) BD ( 1) N   1 - H   3
                ( 68.83%)   0.8297* N   1 s( 24.86%)p 3.02( 75.05%)d 0.00(  0.09%)
                                            0.0001  0.4986  0.0059  0.0000 -0.7062
                                           -0.0239 -0.4077 -0.0138 -0.2910  0.0052
                                            0.0076  0.0243  0.0140  0.0044  0.0014
                ( 31.17%)   0.5583* H   3 s( 99.91%)p 0.00(  0.09%)
                                            0.9996  0.0000  0.0250  0.0145  0.0072
     3. (1.99909) BD ( 1) N   1 - H   4
                ( 68.83%)   0.8297* N   1 s( 24.86%)p 3.02( 75.05%)d 0.00(  0.09%)
                                            0.0001  0.4986  0.0059  0.0000  0.7062
                                            0.0239 -0.4077 -0.0138 -0.2910  0.0052
                                           -0.0076 -0.0243  0.0140  0.0044  0.0014
                ( 31.17%)   0.5583* H   4 s( 99.91%)p 0.00(  0.09%)
                                            0.9996  0.0000 -0.0250  0.0145  0.0072
     4. (1.99982) CR ( 1) N   1           s(100.00%)
                                            1.0000 -0.0002  0.0000  0.0000  0.0000
                                            0.0000  0.0000  0.0000  0.0000  0.0000
                                            0.0000  0.0000  0.0000  0.0000  0.0000
     5. (1.99721) LP ( 1) N   1           s( 25.38%)p 2.94( 74.52%)d 0.00(  0.10%)
                                            0.0001  0.5036 -0.0120  0.0000  0.0000
                                            0.0000  0.0000  0.0000  0.8618 -0.0505
                                            0.0000  0.0000  0.0000  0.0000 -0.0310
Another interesting section is the Natural Bond Order (summary), which shows the occupancy of each of the bonds (2 electrons, as expected for a "normal" bond) and also confirms that it is acceptable to not account for the core orbitals when performing calculations - its' energy is much lower than the bonding orbitals (-0.60 au compared to -14.2 au).
 Natural Bond Orbitals (Summary):

                                                        Natural Bond Orbitals (Summary):

                                                            Principal Delocalizations
           NBO                        Occupancy    Energy   (geminal,vicinal,remote)
 ====================================================================================
 Molecular unit  1  (H3N)
     1. BD (   1) N   1 - H   2          1.99909    -0.60417
     2. BD (   1) N   1 - H   3          1.99909    -0.60417
     3. BD (   1) N   1 - H   4          1.99909    -0.60417
     4. CR (   1) N   1                  1.99982   -14.16768
     5. LP (   1) N   1                  1.99721    -0.31757  16(v),20(v),24(v),17(v)
Ammonia-borane calculatios
A calculation was performed on the NH3BH3 molecule to determine the association bond energy in the N-B bond. Because the analysis was done on the same level of analysis as before for the BH3 and NH3 fragments, the relative energies can be compared and the energy difference found. The energy difference between the sum of the two fragments and the NH3BH3 complex equals to the N-B bond energy.
Optimisation file can be found here.
Table 14: NH3BH3 calculation data B3LYP/6-31G(d,p)
| Summary data | Convergence | Molecule structure | ||
|---|---|---|---|---|
nh3bh3 opt File Name = MH_NH3BH3_OPT File Type = .log Calculation Type = FOPT Calculation Method = RB3LYP Basis Set = 6-31G(d,p) Charge = 0 Spin = Singlet E(RB3LYP) = -83.22468906 a.u. RMS Gradient Norm = 0.00000115 a.u. Imaginary Freq = Dipole Moment = 5.5646 Debye Point Group = C3 Job cpu time: 0 days 0 hours 0 minutes 27.0 seconds. |
         Item               Value     Threshold  Converged?
 Maximum Force            0.000001     0.000015     YES
 RMS     Force            0.000001     0.000010     YES
 Maximum Displacement     0.000033     0.000060     YES
 RMS     Displacement     0.000015     0.000040     YES
 Predicted change in Energy=-5.980745D-11
 Optimization completed.
    -- Stationary point found.
|
Frequency file can be found here.
Table 15: NH3BH3 frequency data B3LYP/6-31G(d,p)
| Summary data | Low frequencies |
|---|---|
nh3bh3 freq File Name = MH_NH3BH3_FREQ File Type = .log Calculation Type = FREQ Calculation Method = RB3LYP Basis Set = 6-31G(d,p) Charge = 0 Spin = Singlet E(RB3LYP) = -83.22468906 a.u. RMS Gradient Norm = 0.00000119 a.u. Imaginary Freq = 0 Dipole Moment = 5.5646 Debye Point Group = C3 Job cpu time: 0 days 0 hours 0 minutes 24.0 seconds. |
Low frequencies --- -0.7254 -0.6474 -0.0087 0.1319 0.3226 3.7576 Low frequencies --- 263.5181 632.9793 638.4612 |
All of the vibrations and their frequencies are again listed in the table below. In total, there are 18 vibrations, which nicely demonstrates that the size of the molecule does influence the number of vibrations - the bigger the molecule, the bigger the number of vibrations; following the v = 3N - 6 formula.
Table 16: Vibration frequencies of NH3BH3
| Wavenumber | Intensity | IR active | Type |
|---|---|---|---|
| 264 | 0 | No | Bend |
| 633 | 14 | Yes (slight) | Stretch |
| 638 | 4 | Yes (very slight) | Bend |
| 638 | 4 | Yes (very slight) | Bend |
| 1069 | 41 | Yes | Bend |
| 1069 | 41 | Yes | Bend |
| 1196 | 109 | Yes | Stretch |
| 1203 | 4 | Yes (very slight) | Bend |
| 1203 | 4 | Yes (very slight) | Bend |
| 1328 | 114 | Yes | Stretch |
| 1676 | 28 | Yes | Bend |
| 1676 | 28 | Yes | Bend |
| 2473 | 67 | Yes | Stretch |
| 2533 | 231 | Yes | Stretch |
| 2533 | 231 | Yes | Stretch |
| 3464 | 3 | Yes (very slight) | Stretch |
| 3581 | 28 | Yes | Stretch |
| 3581 | 28 | Yes | Stretch |
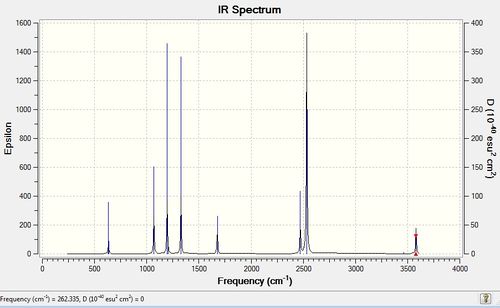
Figure 6: The IR spectrum of frequency optimised NH3BH3.
As mentioned, the number of frequencies is 18, however, the number of observed peaks in the IR spectrum is 8. This is because of 4 sets of degenerate vibrations and 4 sets of peaks (2 degenerate, 1 labelled "very slight vibration" and 1 IR inactive) that cannot be seen because their intensity is either too low or they are IR inactive.
To determine the energy of the N-B bond, the energies of the fragments must be compared as follows:
E(NH3) = -56.55776872 a.u.
E(BH3) = -26.61532360 a.u.
E(NH3BH3) = -83.22468897 a.u.
ΔE = E(NH3BH3)-[E(NH3)+E(BH3)] = 0.05159665 a.u.
The conversion factor between a.u. and kJ/mol is: 1 Hartree = 2625.5 kJ/mol. This gives:
ΔE = 0.05159665 a.u. = 135.47 kJ/mol
This is not a particularly strong bond, based on the discussion from above, it would be classified as a medium-weak bond.
An interesting comparison can be made between a molecule of ethane and NH3BH3, as they are isoelectronic, but the nature of the bond is markedly different. This can be seen by doing the NBO calculation.
Optimisation file can be found here.
Table 17: Ethane calculation data B3LYP/6-31G(d,p)
| Summary data | Convergence | Molecule structure | ||
|---|---|---|---|---|
ethane opt File Name = MH_ethane_opt File Type = .log Calculation Type = FOPT Calculation Method = RB3LYP Basis Set = 6-31G(d,p) Charge = 0 Spin = Singlet E(RB3LYP) = -79.83874168 a.u. RMS Gradient Norm = 0.00006666 a.u. Imaginary Freq = Dipole Moment = 0.0000 Debye Point Group = C1 Job cpu time: 0 days 0 hours 0 minutes 28.0 seconds. |
Item Value Threshold Converged? Maximum Force 0.000198 0.000450 YES RMS Force 0.000038 0.000300 YES Maximum Displacement 0.000390 0.001800 YES RMS Displacement 0.000117 0.001200 YES Predicted change in Energy=-8.261580D-08 Optimization completed. |
The NBO was then computed for NH3BH3 as well as ethane (full files here and here respectively). The differences can be seen in the figure below.
a) i)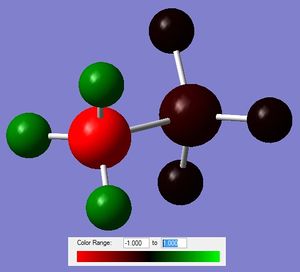 b) i)
b) i)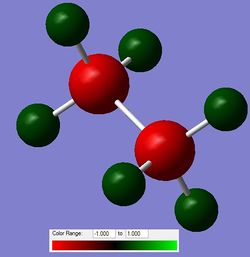
a) ii)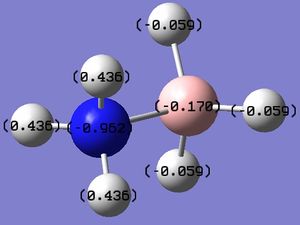 b) ii)
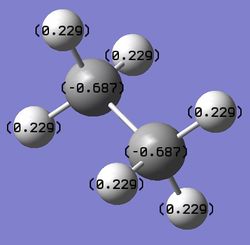
Figure 7: The charge distribution comparison between NH3BH3 (a) and ethane (b).
From the charge distribution plots and the numbers, it can be deducted that the N-B bond is charged, with the majority of electron density being located on the N. B is slightly negative, confirming a dative nature (N to B) of the bond. Ethane is, as expected, completely symmetrical in terms of charge distribution; with the charge being located on C atoms as they are more electronegative than H.
The charged nature of the N-B bond implies that it can be weakened if electron withdrawing groups are placed on the N, which would make the N less able to donate the electrons to B. The C-C bond could also be weakened in the same manner; that would induce a charged nature into the otherwise neutral bond.
Part 2: Aromaticity mini project
In this second part of the inorganic computational experiment, the aromaticity of different isoenergetic aromatic compounds will be explored and then compared. The model compound on which the comparisons will be based is benzene, which is probably the most famous aromatic compound and forms the basis of our understanding of the concept. It is a compound with the formula C6H6 and forms a ring. Its structural formula was unknown for a long time, despite the fact that the molecular formula was well known. It took Kekule to come up with the 6-membered ring structure with alternating double bonds to establish a clearer idea of what benzene was. In a molecule of benzene, all of the bonds between the C atoms are of the same length (140 pm), which falls in between a single and a double C-C bond length (135 pm, 147 pm respectively). It is planar, and the classical MO description describes the p orbitals on the C atoms overlapping and sharing a π electron cloud above and below the plane of the ring. This sharing of the electrons is referred to as aromaticity and gives rise to the unusual stability of benzene and its analogues.
Benzene
Optimisation
The optimisation, frequency analysis, and population analysis were performed on a molecule of benzene. The data obtained is shown below. The basis set used for all of the calculations was B3LYP/6-31G.
The full optimisation file can be found here.
Table 18: Benzene calculation data B3LYP/6-31G(d,p)
| Summary data | Convergence | Molecule structure | ||
|---|---|---|---|---|
benzene opt File Name = MH_benzene_opt File Type = .log Calculation Type = FOPT Calculation Method = RB3LYP Basis Set = 6-31G(d,p) Charge = 0 Spin = Singlet E(RB3LYP) = -232.25820200 a.u. RMS Gradient Norm = 0.00000046 a.u. Imaginary Freq = Dipole Moment = 0.0000 Debye Point Group = D6H Job cpu time: 0 days 0 hours 0 minutes 32.0 seconds. |
        Item               Value     Threshold  Converged?
 Maximum Force            0.000001     0.000015     YES
 RMS     Force            0.000000     0.000010     YES
 Maximum Displacement     0.000001     0.000060     YES
 RMS     Displacement     0.000000     0.000040     YES
 Predicted change in Energy=-4.249015D-12
 Optimization completed.
    -- Stationary point found.
|
Frequency analysis
Frequency file can be found here.
Table 19: Benzene frequency data B3LYP/6-31G(d,p)
| Summary data | Low frequencies |
|---|---|
benzene freq File Name = MH_benzene_freq File Type = .log Calculation Type = FREQ Calculation Method = RB3LYP Basis Set = 6-31G(d,p) Charge = 0 Spin = Singlet E(RB3LYP) = -232.25820200 a.u. RMS Gradient Norm = 0.00000040 a.u. Imaginary Freq = 0 Dipole Moment = 0.0000 Debye Point Group = D6H Job cpu time: 0 days 0 hours 0 minutes 43.0 seconds. |
Low frequencies --- -10.2549 -5.6651 -5.6651 -0.0056 -0.0056 -0.0014 Low frequencies --- 414.5451 414.5451 621.0429 |
The full frequency table is shown below.
Table 20: Vibration frequencies of benzene
| Wavenumber | Intensity | IR active | Type |
|---|---|---|---|
| 414 | 0 | No | Bend |
| 414 | 0 | No | Bend |
| 621 | 0 | No | Bend |
| 621 | 0 | No | Bend |
| 693 | 74 | Yes | Bend |
| 718 | 0 | No | Bend |
| 864 | 0 | No | Bend |
| 864 | 0 | No | Bend |
| 974 | 0 | No | Bend |
| 974 | 0 | No | Bend |
| 1013 | 0 | No | Bend |
| 1018 | 0 | No | Stretch |
| 1020 | 0 | No | Stretch |
| 1066 | 3 | Yes (very slight) | Stretch |
| 1066 | 3 | Yes (very slight) | Stretch |
| 1079 | 0 | No | Bend |
| 1202 | 0 | No | Bend |
| 1202 | 0 | No | Bend |
| 1356 | 0 | No | Stretch |
| 1380 | 0 | No | Bend |
| 1524 | 7 | Yes (very slight) | Stretch + bend |
| 1524 | 7 | Yes (very slight) | Stretch + bend |
| 1653 | 0 | No | Stretch + bend |
| 1653 | 0 | No | Stretch + bend |
| 3174 | 0 | No | Stretch |
| 3184 | 0 | No | Stretch |
| 3184 | 0 | No | Stretch |
| 3200 | 47 | Yes | Stretch |
| 3200 | 47 | Yes | Stretch |
| 3210 | 0 | No | Stretch |
The IR spectrum for benzene is shown below. It only has 4 peaks, despite having 30 distinct vibrations. This is because it is a highly symmetric molecule, giving rise to a lot of IR inactive vibrations.

Figure 8: The IR spectrum of frequency optimised benzene.
Population analysis
The MOs of benzene were calculated and then visualised. The full file can be found here.
A MO diagram was constructed on the basis of the calculated MO orbitals. The LCAO figures of orbitals are included; they can be derived from the electron density maps of the actual MOs.
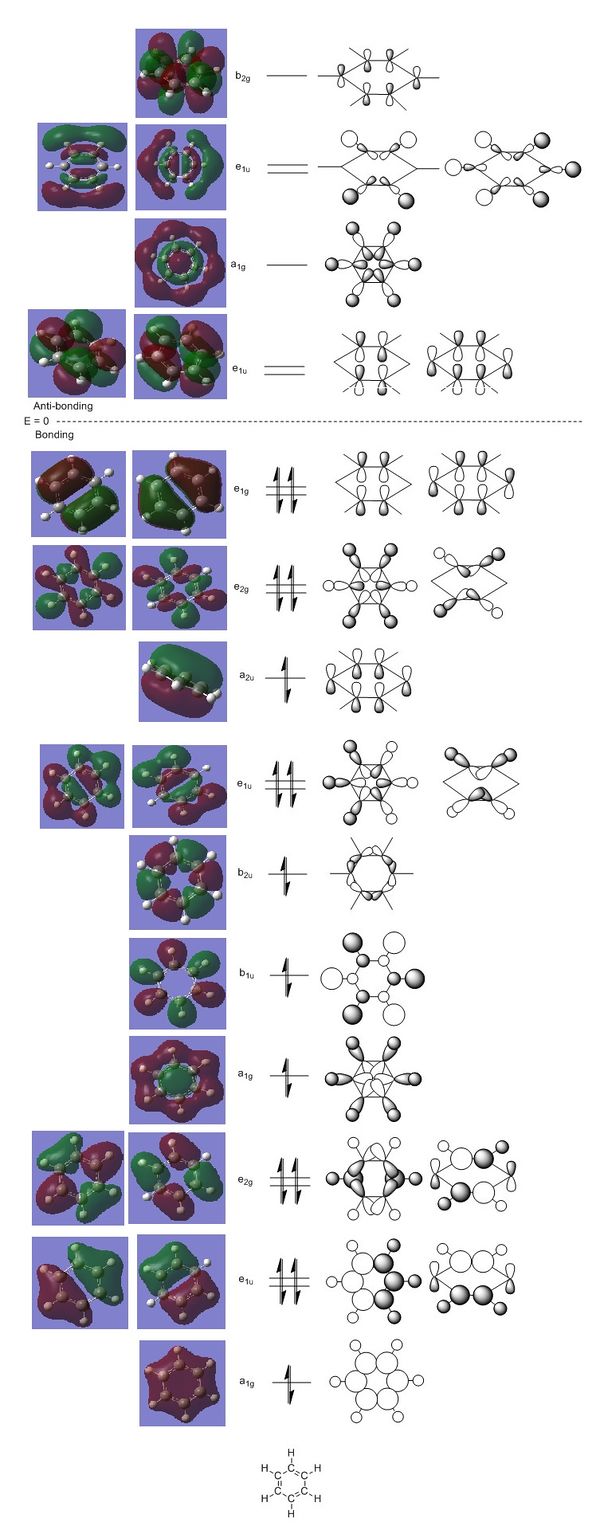
Figure 9: The MO diagram of benzene.
The digram above shows the MOs of benzene. On the left, the calculated orbitals are presented, whereas on the right, the LCAO constructed orbitals are shown. The diagram only shows the valence orbitals (7-27); the core orbitals are not as interesting as they are mostly located on single atoms and are too deep in energy to be involved in bonding.
It is quite interesting to see that even some antibonding orbitals are actually involved in bonding (eg. are filled with electrons), such as the fully antibonding b1u σ orbital. It is actually lower in energy than the bonding π orbitals, which are normally considered the "glue" that holds benzene together. The latter are actually found at the very border between bonding and anti-bonding orbitals. It is not suprising to see MOs where through-space bonding interactions are the main source of stabilisation towards the top of the bonding MO scale. Furthermore, the MOs with many nodes are also found to have quite high relative energies, since having nodes inherently brings the number of antibonding interactions up.
The symmetrical nature of benzene is again nicely demonstrated in terms of the MOs. There are many pairs of degenerate orbitals, which have the same energy despite sometimes very different shapes (eg. e1u pair).
Aromaticity discussion
In general, aromaticity referes to delocalisation within a cyclic molecule, where a part of the electrons involved in bonding is able to be "delocalised" (shared) among all the atoms. The prediciton of whether a molecule is aromatic or not is usually done using the empirical Hückel's rule, which says that a molecule will be aromatic if it possesses 4n+2 π electrons (n is an integer). Benzene fits the rule with n=1.
Overall, it seems the MOs as shown above do not show delocalisation as being as big a part of benzene's bonding as it is usually claimed. The computed MOs actually reveal a very high degree of σ bonding, which contributes significantlly to the overall bonding energy (and hence stability) in benzene. The three fully π orbitals which could be labelled as the "resoncance" part of the molecule are the MOs at the very top of the bonding part of the MO diagram: the orbitals with symmetries a2u and e1g (degenerate set). In terms of the "classic" picture of bonding in benzene, 6 electrons are usually presented as the π electron cloud above and below the plane of the ring (which looks like the a2u orbital), but the MO diagram reveals that there are actually only 2 electrons involved in that particular MO. So, in other words, the 6 "resonance" electrons are actually divided between the 3 seperate sets of MOs, which are comprised of p orbitals on C atoms.
NBO analysis
The NBO picture of benzene presents the charge distribution. This is shown below.
i)  ii)
ii) 
Figure 10: The charge distribution of benzene.
From the above figure, it can be seen that the charge is evenly distributed in the molecule. All of the C and H atoms have the same value of charge distribution; with the H numbers being the opposite of that of C. The "evenness" is the consequence of the high symmetry of the molecule. Most of the charge is hence located on the C atoms, which is to be expected, as the C atoms are more electronegative.
Boratabenzene
Optimisation
Boratabenzene, a benzene analogue with one C replaced by B, was optimised . Full optimisation file can be found here.
Table 21: Boratabenzene calculation data B3LYP/6-31G(d,p)
| Summary data | Convergence | Molecule structure | ||
|---|---|---|---|---|
boratabenzene opt File Name = MH_boratabenzene_opt File Type = .log Calculation Type = FOPT Calculation Method = RB3LYP Basis Set = 6-31G(d,p) Charge = -1 Spin = Singlet E(RB3LYP) = -219.02052178 a.u. RMS Gradient Norm = 0.00017317 a.u. Imaginary Freq = Dipole Moment = 2.8495 Debye Point Group = C1 Job cpu time: 0 days 0 hours 2 minutes 47.0 seconds. |
 Item               Value     Threshold  Converged?
 Maximum Force            0.000433     0.000450     YES
 RMS     Force            0.000086     0.000300     YES
 Maximum Displacement     0.001784     0.001800     YES
 RMS     Displacement     0.000524     0.001200     YES
 Predicted change in Energy=-1.167403D-06
 Optimization completed.
    -- Stationary point found.
|
Frequency analysis
Frequency file can be found here.
Table 22: Boratabenzene frequency data B3LYP/6-31G(d,p)
| Summary data | Low frequencies |
|---|---|
boratabenzene freq File Name = MH_boratabenzene_freq File Type = .log Calculation Type = FREQ Calculation Method = RB3LYP Basis Set = 6-31G(d,p) Charge = -1 Spin = Singlet E(RB3LYP) = -219.02052178 a.u. RMS Gradient Norm = 0.00017318 a.u. Imaginary Freq = 0 Dipole Moment = 2.8495 Debye Point Group = C1 Job cpu time: 0 days 0 hours 5 minutes 58.0 seconds. |
Low frequencies --- -1.8889 -0.0007 0.0004 0.0008 6.6178 9.3053 Low frequencies --- 371.5578 404.5188 565.2351 |
Low frequencies show that a minimum was found.
Population analysis
The full file can be found here.
The MOs were found to be higher in energy than benzene MOs, which is to be expected as B is less electronegative than C and hence the AOs originate higher in energy than in benzene. Also, considering the symmetry of the orbitals, it was found that they were no longer degenerate because of the presence of B.
NBO analysis
The NBO charge distribution is shown in the figure below.
i) 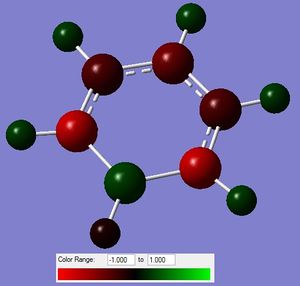 ii)
ii) 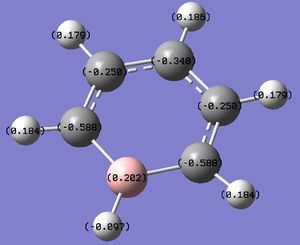
Figure 11: The charge distribution of boratabenzene.
As expected, the B carries a positive charge, as it is less electronegative than C. Also, the uniform charge distribution seen in benzene is no longer observed here. The sum of the charges is -1, as the molecule is negatively charged.
Pyridinium
Optimisation
Pyridinium, a benzene analogue with one C replaced by N, was optimised next. Full optimisation file can be found here.
Table 23: Pyridinium calculation data B3LYP/6-31G(d,p)
| Summary data | Convergence | Molecule structure | ||
|---|---|---|---|---|
Title Card Required File Name = MH_pyridinium_opt File Type = .log Calculation Type = FOPT Calculation Method = RB3LYP Basis Set = 6-31G(d,p) Charge = 1 Spin = Singlet E(RB3LYP) = -248.66806083 a.u. RMS Gradient Norm = 0.00006290 a.u. Imaginary Freq = Dipole Moment = 1.8724 Debye Point Group = C1 Job cpu time: 0 days 0 hours 3 minutes 16.0 seconds. |
         Item               Value     Threshold  Converged?
 Maximum Force            0.000122     0.000450     YES
 RMS     Force            0.000030     0.000300     YES
 Maximum Displacement     0.000336     0.001800     YES
 RMS     Displacement     0.000099     0.001200     YES
 Predicted change in Energy=-8.873999D-08
 Optimization completed.
    -- Stationary point found.
|
Frequency analysis
Frequency file can be found here.
Table 24: Pyridinium frequency data B3LYP/6-31G(d,p)
| Summary data | Low frequencies |
|---|---|
pyridinium freq File Name = MH_pyridinium_freq File Type = .log Calculation Type = FREQ Calculation Method = RB3LYP Basis Set = 6-31G(d,p) Charge = 1 Spin = Singlet E(RB3LYP) = -248.66806083 a.u. RMS Gradient Norm = 0.00006283 a.u. Imaginary Freq = 0 Dipole Moment = 1.8724 Debye Point Group = C1 Job cpu time: 0 days 0 hours 5 minutes 10.0 seconds. |
Low frequencies --- -9.2678 -4.2432 -0.0009 -0.0005 0.0006 3.2265 Low frequencies --- 391.8842 404.3507 620.1968 |
Low frequencies show that a minimum was found.
Population analysis
The full file can be found here.
The MOs were found to be lower in energy than benzene MOs, which is to be expected as N is more electronegative than C and hence the AOs originate deeper in energy than in benzene.
NBO analysis
The NBO charge distribution is shown in the figure below.
i) 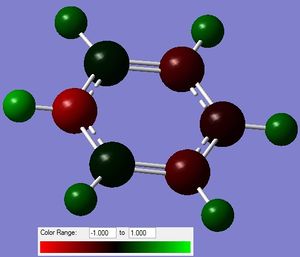 ii)
ii) 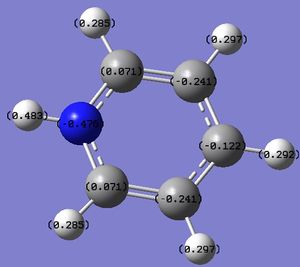
Figure 12: The charge distribution of pyridinium.
From the figure above it can be seen that most of the negative charge is located on N, as it is the most electronegative. Other C and H atoms show an uneven distribution of charge, as opposed to that in benzene. Because the molecule is positively charged, the charges add up to +1.
Borazine
Optimisation
Borazine, a benzene analogue with C atoms replaced by alternating B and N atoms, was optimised last. Full optimisation file can be found here.
Table 25: Borazinecalculation data B3LYP/6-31G(d,p)
| Summary data | Convergence | Molecule structure | ||
|---|---|---|---|---|
borazine opt File Name = MH_borazine_opt File Type = .log Calculation Type = FOPT Calculation Method = RB3LYP Basis Set = 6-31G(d,p) Charge = 0 Spin = Singlet E(RB3LYP) = -242.68459952 a.u. RMS Gradient Norm = 0.00003574 a.u. Imaginary Freq = Dipole Moment = 0.0000 Debye Point Group = C1 Job cpu time: 0 days 0 hours 1 minutes 33.0 seconds. |
       Item               Value     Threshold  Converged?
 Maximum Force            0.000089     0.000450     YES
 RMS     Force            0.000030     0.000300     YES
 Maximum Displacement     0.000324     0.001800     YES
 RMS     Displacement     0.000112     0.001200     YES
 Predicted change in Energy=-6.258680D-08
 Optimization completed.
    -- Stationary point found.
|
Frequency analysis
Frequency file can be found here.
Table 26: Borazine frequency data B3LYP/6-31G(d,p)
| Summary data | Low frequencies |
|---|---|
borazine freq File Name = MH_borazine_freq File Type = .log Calculation Type = FREQ Calculation Method = RB3LYP Basis Set = 6-31G(d,p) Charge = 0 Spin = Singlet E(RB3LYP) = -242.68460007 a.u. RMS Gradient Norm = 0.00005716 a.u. Imaginary Freq = 0 Dipole Moment = 0.0009 Debye Point Group = C1 Job cpu time: 0 days 0 hours 2 minutes 53.0 seconds. |
Low frequencies --- 0.0011 0.0013 0.0014 5.5065 8.9373 11.5093 Low frequencies --- 289.8399 290.1287 404.6026 |
Low frequencies show that a minimum was found.
Population analysis
The full file can be found here.
The MOs were found to be closest in energy to those of benzene among all 3 analogues. Also, the shapes of the orbitals closely resembled those of benzene in terms of symmetry. This is probably due to the fact that borazine is the most symmetric of the three molecules and is also neutral, which is the case in benzene.
NBO analysis
The NBO charge distribution is shown in the figure below.
i) 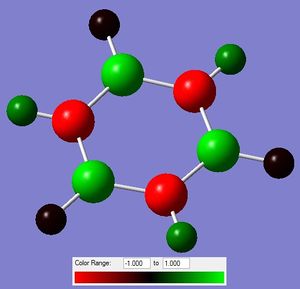 ii)
ii) 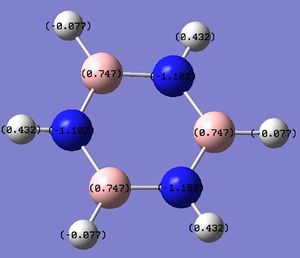
Figure 13: The charge distribution of borazine.
The NBO charge distribution is again as expected. The electronegative N atoms carry the negative charge, while the more electropositive B atoms carry the positive charge. The charge density on the N and B atoms is also reflected in the electron density on the H atoms connected to them. The ones connected to B are more negative than those connected to N, because of the relative electronegativities of the atom pairs.
Comparison of Charge Distribution
In the following table, the charge distribution data of all 4 aromatic cycles is summarised and compared.
Table 27: Comparison of charge distribution data
As shown in the table, benzene is the molecule with the most evenly distributed charge density. It also has a dipole moment of 0.00. This arises from the inherent six-fold molecular symmetry and the fact that it is made only of C and H atoms. All of the C-C bonds and the C-H bonds are the same, which gives rise to identical charge density values on both types of atoms respectively. C atoms have a negative value (-0.239), indicating that most of the charge located there. This is as expected, since they are more electronegative and also the π cloud is located in the region above and below the C atoms. H atoms have a value of +0.239. The bonds are hence slightly polarised, but overall the molecule is still non-polar and non-charged.
By introducing either a N or a B atom into the benzene structure to replace a C, the symmetry is broken. This results in a non-uniform charge distribution and a dipole moment in both molecules. Despite being more similar to each other than they are to benzene, boratabenzene and pyridinium still markedly differ.
In boratabenzene, the charge density is moved away from B atom, as the latter is more electropostive than C. The charge density is not uniformly spaced out on the other 5 carbons as one might expet - despite the fact that all of them posses a negative charge density, the two ortho and the para C posses a lower value than the meta C (-0.588, -0.340 for ortho, para respectively, cf. -0.250 for meta). This phenomenon can be explained by the resoncance forms of boratabenzene (shown below). The negative charge can only be stabilised in a particular way, employing 3 distinct resonance forms. In those, the negative charge is localized on the ortho and para positions.

Figure 14: The resonance forms of boratabenzene.
The charge distribution on H atoms is also not uniform. The H connected to B actually has a sightly negative value (-0.096), because it is slightly more electronegative than B. The charge densities on other H atoms in a way "match" the charge densities on C atoms to which they are bonded - the more charge located on C, the less is H. In other words, the ortho and para H have a more positive value than the meta bonded H (0.184, 0.186 for ortho, para respectively cf. 0.179 for meta). The difference is very small however. Compared to benzene, the H atoms are less positively charged. This is due to the overall negative charge of the molecule, which "forces" all parts of the molecule to posses a higher energy density than they "normally" (in a neutral state) would. Because B is the most electropositive of all the atoms, the extra -1 charge is distributed mostly among the other atoms.
In contrast to boratabenzene, in pyridinium, the charge density is moved towards the substituted atom. N is more electronegative than C or H, so it the charge density is mostly located on it (-0.476). As before, the charge density is not uniformly spread over the remaining atoms. In this case, the two "outliers" when it comes to C atoms are again the meta ones, and they carry the most negative charge (-0.241, cf ortho, para 0.071, -0.122). This can again be explained by resonance forms, as shown below.

Figure 15: The resonance forms of boratabenzene.
As before, the H atoms reflect the charge density on the atom to which they are connected. All of the H atoms here have a positive value of charge density, as both C and N are more electronegative than H. The H atom on N is the most devoid of electron density; the value of charge density is 0.483, simply because it is right next to the electronegative N. The other 5 H in C-H bonds all have similar values; they are slightly larger on the meta C atoms, again due to resonance.
The values on C and H atoms are in general more positive than on benzene, this is due to the molecule having an overall positive charge.
Perhaps the most interesting of the 3 compounds, borazine, has a very distinct charge distribution. The symmetry seen in benzene is partially restored (except it is a 3-fold symmetry now, not 6-fold). Because of that, it has no dipole moment and also the values on each species of the atoms are equal to each other. As expected, most of the charge is located on N atoms as they are the most electronegative (-1.102), whereas the least is located on B (0.747). The charge density values on H atoms vary, depending on whether they are connected to a N or a B. In N-H pairs, the H atoms have a charge density value of 0.432, indicating that they are the more electropositive atom in the pair, whereas in B-H pairs, the value is -0.077, indicating that they are slightly more electronegative than B. Interestingly, both of the values are smaller (closer to 0) than they were in boratabenzene and pyridinium for the H atoms, directly attached to either B or N. This is because in those two molecules, the electron density was either distinctly pulled away or pushed to the single heteroatom, hence influencing the H in the B-H/N-H pair more than in the symmetric borazine. Also, borazine is not charged, whereas the previous two species are, which influences the resulting charge density values, making them all smaller (if the charge is +1) or all larger (if the charge is -1).
Comparison of MOs
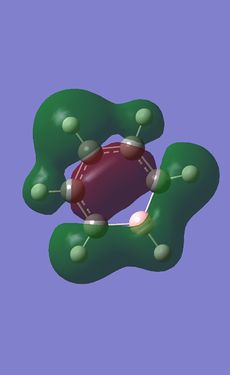
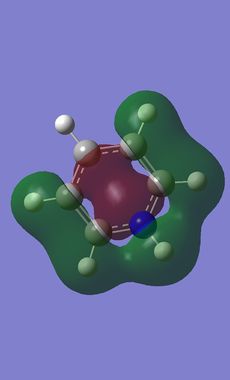
Comparison of MOs was done on three bonding, non-core orbitals. Looking at the full MO of benzene, orbitals 12, 18, 19 were chosen because of their peculiar shapes. Pictures of each of the orbitals is shown in the table below. The energies of the MOs are also shown below their pictures.
Table 28: Comparison of MOs
| Benzene | Boratabenzene | Pyridinium | Borazine | |
|---|---|---|---|---|
| 12th bonding MO | 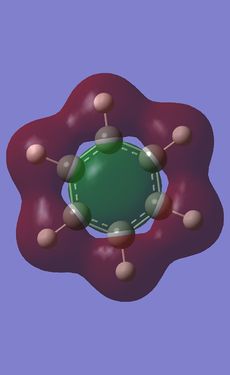
|
|
|

|
| 18th bonding MO | 
|

|

|

|
| 19th bonding MO | 
|

|

|

|
| Energies of bonding MOs | 
|

|

|

|
The 12th MO is a "semi-bonding" orbital in benzene. From the MO diagram of benzene, shown earlier, it can be seen that the orbitals that constitute this MO are p orbitals on C atoms and s orbitals on H atoms. The p orbitals lie in the plane of the ring and there is a bonding interaction inside the ring (between the lobes of p orbitals) and also outside of the ring, where the H s orbitals and the other lobe of each of the p orbitals overlap. The entire MO is remiscent of a doughnut; with a small bonding zone in the middle (the "filling") inside a larger ring. There is also a non-bonding area all around the smaller inside part where the nodes of the p orbitals on C come together; the electron density there is 0. Because the contributions from each of the atoms are exactly the same, the MO is completely symmetric in benzene.
The differences between benzene and the analogues are manifested in the shapes of the MOs as well - just as was the case before with NBO charge distributions. In the 12th MO of boratabenzene, it can be seen that the electron density moves away from the B atom (at least the inside part), suggesting that it does not form a bonding interaction with the C atoms in this MO, as there is quite a significant gap between the B atom itself and the red "filling" part of the electron density (larger than the just the node gap, as seen in benzene). Also, the red middle part does not connect the B atom to the two neighbouring C atoms, as was the case before in benzene where all of the C were connected. The outer part of the MO is also changed; a discontinuity is observed in the ring of positive ineractions between ortho and meta H atoms. This can be explained using the resonance forms of boratabenzene from before (figure 14). The ortho and para atoms carry more charge (as the negative charge is mostly located there); hence making the in-between region devoid of electrons. The localisation of negative charge can be quite clearly seen on the para C-H; the region of electron density is much larger than on the neighbouring meta positions. Overall, the not-so-strong bonding in this MO (considering the missing C-B-C interactions and discontinuity in the outer "bonding ring") results in a higher energy of the orbital - it lies at -0.28944 (benzene 12th MO -0.51974). After looking at the facts, the significat rise in energy is not surprising.
In pyridinium, the situation is reversed. Because N is more electronegative than C, it pulls the electrons towards itself (as mentioned before in the NBO section). This can again be seen as a deformation of the 12th MO, where the electron density is mostly located on the N atom, making the para H completely electron-free! This is again in agreement with the resonance forms from before, where it was noted that positive charge is localised on the para position. In contrast to borazine however, the bonding is better overall. All of the ring atoms are in a favourable bonding interaction (the red part of the MO), the N actually contributes a major part of the electorn density in this region. The outer H atoms are also well connected with through-space interactions. Overall, this results in a lowering of the MO energy in comparison to boratabenzene (and also benzene), bringing it down to -0.79009.
Borazine is, in terms of MO 12, completely different than any of the three previous molecules. MO 12 in this case is a non-symmetric 4-lobed orbital, arising from p orbitals on N and B atoms and s orbitals from 4 of the H atoms. There is a nodal plane, going through the centre of the molecule. Surprisingly, most of the electron density is located on the B atoms, despite the fact that B is less electronegative than N. This could be due to the fact that antibonding AOs are being used (those would be bigger on B than on N); but that does not explain the low overall energy of the MO. In terms of energy it is quite close to the energy of the 12th MO in benzene (-0.52453, cf. -0.51974 in benzene), but overall, it is does not seem to be strongly bonding. Out of the three analogues, it is hence the most similar to benzene in terms of energy, but differs very much in terms of the orbital shape.
Orbitals 18 and 19 are best compared together, as they are a set of degenerate orbitals in benzene. As in the case of MO 12, they are comprised of a mixture of s and p orbitals; with C atoms again contributing their p orbitals, while the H atoms contribute s orbitals to produce the final MO. The inner part of the ring is now not fully bonding - as expected for a MO that is higher in energy, there are less positive (bonding) interactions. Some of the lobes of C p orbitals do not match inside the ring, hence producing non-bonding regions in both MOs. The 18th orbital has a nodal plane, going through the centre of the molecule, hence leaving two of the H devoid of any electron density (they do not participate in bonding in this orbital). Only pairs of atoms are actually bonded here; but the fact that there are many nodes (because of p orbitals from C), the red and green lobes never actually touch, hence the orbital is not destabilised.
In contrast to MO 18, the 19th orbital does not have a nodal plane, which means that all of the atoms participate in bonding. There are now two "strips" of electron density (red), going along the two C-C-C halves of the ring. This increases the interactions between 5 atoms at a time (H-C-C-C-H), but sacrifices the possibility of through-space interactions. Overall, this gives rise to two distinctly shaped MOs with identical energy.
An interesting observation can be made when one takes a look at the 18th and 19th MO of boratabenzene: compared to benzene, they have reversed their order. It is not surprising that they are no longer degenerate either. The shapes of the orbitals are again changed, as was seen in MO 12. It is peculiar to see that MO 18 now shows more electron density located on B than on the other atoms - when compared to MO19 of benzene, it can be seen that the lobes are larger in the vicinity of the B atom. This is due to the fact that the antibonding B orbitals are now being used in bonding, and those make a larger contribution (are larger) than the p antibonding orbitals on C atoms, as B is more electropositive (it makes a larger contribution in the anti-bonding region). Similar distortion effect is also seen in MO 19 - electrons are mostly localised in the area around B. This is also seen in the rising of the energy of MOs 18 and 19; they are very close to 0 in this case (-0.09152 and -0.08396 for 18 and 19 respectively) and are much higher than in benzene (-0.33961).
Not surprisingly, again the reverse happens in pyridinium when compared to boratabenzene. The order of MOs here is the same as in benzene. The electron density is now pushed away from the N atom - as it is more electronegative than C, the antibonding orbitals are lower in energy and hence make a lower contribution in that region. Hence, most of the electron density is located on para C side of the ring. As before, the energies of the MOs are lower than in boratabenzene (and benzene), lying at -0.57740 and -0.57432 (MO 18, 19 respectively).
Borazine is again a complete outlier when it comes to the orbital shape comparison. MOs 18 and 19 seem to form a degenerate set of orbitals here when one compares the shapes - they are the same, only rotated around the molecule. The energies however, are not exactly the same; the values slightly differ (-0.31992, -0.31989). They are very close however; much closer than the energies of MOs 18 and 19 in boratabenzene and pyridinium.
To summarise, it is quite obvious that substitutions have a big effect on the overall properties of a molecule. The first is the loss of degeneracy which arises from the introduction of a different ring atom (B or N) - as the symmetry is broken, the degenerate energy levels seperate into distinct energy levels. Despite perserving their general appearance, the new MOs differ from the ones in benzene in the exact positions and distributions of the electron density. This also arises from the fact that the substituted atoms B and N have inherently different properties than C. The different electronegativities promote different behaviour, such as charge localisation and overall energy of the molecule, as that depends on the energy of the AOs coming into the molecule to form MOs. In borazine, the effect in changing of the shapes of the orbitals is very pronounced in certain orbitals (such as the ones shown above). However, degenerate energy levels can still be expected, because of the high symmetry of the molecule, even if the symmetry is not as high as in benzene (D3h cf. D6h in benzene).
The overall MO diagrams of the 3 analogues of benzene would look fairly similar to the benzene one in terms of the number of the orbitals and general shapes of most of the orbitals (except in the case of borazine, where some are significantly different). The energies of the entire diagram would however be appropriately shifted as shown in the table - in boratabenzene, the entire MO diagram would move higher in energy, whereas the pyridinium one would be lower. The borazine would be the most similar in terms of the energies. The degeneracy, seen in the benzene MO diagram, would mostly be lost; again the borazine MO diagram would be the most similar because of the high symmetry of the molecule.
Conclusion
At this point, it can be said that the computational experiment was a success, as we have managed to obtain all the structures and energies of all the molecues that were investigated. Meaningful comparisons could be draw and the results interpretation of data yielded some intersting results.
We have managed to determine the optimised structures for 4 EX3 species - BH3, GaBr3, BBr3, and NH3. The differences in bond lengths and strengths were explained using the orbital and size difference arguments. Using the energy data for BH3 and NH3, the strength of the N-B bond in a BH3NH3 complex was calculated. The result was 135.47 kJ/mol, which is not a really strong bond.
In the second part of the experiment benzene, boratabenzene, pyridinium, and borazine were compared. Using symmetry, electronegativity, and energy arguments, the differences in the NBO charge distribtutions and MO shapes and energies were explained. It was shown that the aromatic p cloud is not the only thing that holds benzene together; a notion that is usually left out in the text books. Boratabenzene was found to be less stable than benzene, as the B atom is less able to stabilise the electrons, whereas pyridinium was found to be more stable (lower in energy), because of higher electronegativity. Both were found to have lost the degeneracy in orbitals, as they are no longer symmetric; a phenomenon that was much less pronounced in the more symmetric borazine.
References
1. http://en.wikipedia.org/wiki/Chemical_bond#Strong_chemical_bonds accessed on 5th March 2015
2. P. Atkins, J. De Paula, Atkins's Physical Chemistry, Oxford University Press, 9th ed, 2010
3. J. Clayden, N. Greeves, S. Warren, and P. Wothers, Organic Chemistry, Oxford University Press, New York, 2nd edition, 2012
