Rep:Mod:inorganiclab01331511
Second Year Inorganic Lab
Revision section
BH3
B3LYP/6-31G(d,p)
BH3 optimized molecule |
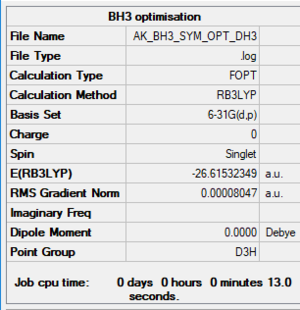
         Item               Value     Threshold  Converged?
 Maximum Force            0.000161     0.000450     YES
 RMS     Force            0.000105     0.000300     YES
 Maximum Displacement     0.000638     0.001800     YES
 RMS     Displacement     0.000418     0.001200     YES
Link to the frequency analysis file
Low frequencies ---   -0.2456   -0.1129   -0.0054   44.0270   45.1846   45.1853

Low frequencies --- 1163.6049 1213.5924 1213.5951
Frequencies
| Wavenumber (cm-1) | Intensity (arbitrary units) | Symmetry | IR active? | Type |
|---|---|---|---|---|
| 1164 | 92 | A2" | YES | Out-of-plane bend |
| 1214 | 14 | E' | YES | Bend |
| 1214 | 14 | E' | YES | Bend |
| 2580 | 0 | A1' | NO | Symmetric stretch |
| 2713 | 126 | E' | YES | Asymmetric stretch |
| 2713 | 126 | E' | YES | Asymmetric stretch |
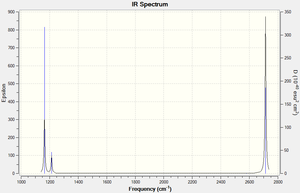
The IR shows only 3 peaks instead of 6 listed in the frequency table. There are two degenerate pairs of stretches/bends (of the same energy hence shown as a single signal, 1214 cm-1 bends and 2713 cm-1 asymmetric stretches). The symmetric stretch at 2580 has an intensity of 0 hence is not IR active, as it does not have a change in dipole present.
MO diagram / Energies
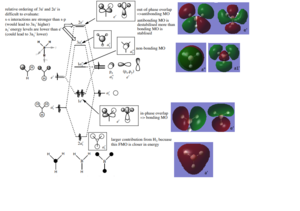
As can be seen from the diagram, the MO theory results in general molecular orbital's shapes, which correspond to the ones computed using Gauss function. The main difference is in drawing/representation, as the computed MO diagrams contain the clearly distinguishable nodes (at the places with out-of-phase overlap), as well as the orbitals (their overlap) is shown as single units, rather than the individual atomic orbitals overlapping. Thus it can be concluded that MO theory can be used for qualitative purposes.
Ng611 (talk) 18:03, 29 May 2019 (BST) What other differences can you identify?
Association energiesː Ammonia-Borane
Ammonia (NH3)
B3LYP/6-31G(d,p)
NH3 optimized molecule |
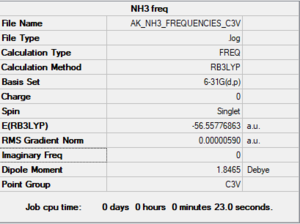
       Item               Value     Threshold  Converged?
 Maximum Force            0.000006     0.000450     YES
 RMS     Force            0.000004     0.000300     YES
 Maximum Displacement     0.000012     0.001800     YES
 RMS     Displacement     0.000008     0.001200     YES
Link to the frequency analysis file
 Low frequencies ---   -8.5223   -8.4750   -0.0033    0.0335    0.1919   26.4067
 Low frequencies --- 1089.7616 1694.1862 1694.1866
Ammonia-Borane
B3LYP/6-31G(d,p)
Ammonia-Borane optimized molecule |
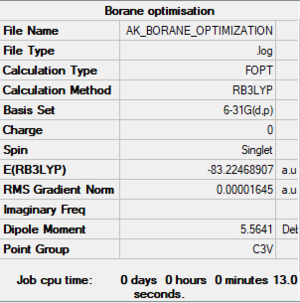
       Item               Value     Threshold  Converged?
 Maximum Force            0.000042     0.000450     YES
 RMS     Force            0.000011     0.000300     YES
 Maximum Displacement     0.000196     0.001800     YES
 RMS     Displacement     0.000063     0.001200     YES
Link to the frequency analysis file
 Low frequencies ---   -0.1201   -0.0605   -0.0200   14.5731   14.7916   18.0595
 Low frequencies ---  263.6593  632.7481  639.2050
Energy calculation
E(NH3)= -56.558 AU E(BH3)= -26.615 AU E(NH3BH3)= -83.225 AU
Ng611 (talk) 18:05, 29 May 2019 (BST) You've rounded to 5 s.f. too early. These calculations are actually accurate to 5 d.p. (not 5 s.f.). However, you should not round at all, but rather use the full precision number and then only round your final result.
ΔE=E(NH3BH3)-[E(NH3)+E(BH3)] = 0.052 AU, = 140 kJ/mol
1 au = 2625.5 kJ/mol
The strength of the interaction can be considered as 'medium'. It is lower in comparison to the average B-N bond strength (B̠-N, 389 kJ/mol [2]), but still higher than dipole-dipole intermolecular interactions (2-8 kJ/mol).
NI3, Basis sets and Pseudo-potentials
N B3LYP/6-31G(d,p) I B3LYP/LanL2DZ
NI3 optimised optimized molecule |
Optimised N-I distance = 2.18 A
Ng611 (talk) 18:06, 29 May 2019 (BST) Looks like you got the right answer but again rounded inappropriately.
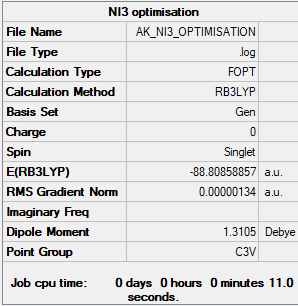
Item               Value     Threshold  Converged?
 Maximum Force            0.000002     0.000450     YES
 RMS     Force            0.000001     0.000300     YES
 Maximum Displacement     0.000014     0.001800     YES
 RMS     Displacement     0.000011     0.001200     YES
Link to the frequency analysis file
Low frequencies ---  -12.5522  -12.5460   -6.0047   -0.0040    0.0191    0.0664
 Low frequencies ---  100.9969  100.9977  147.3377
Project Partː MAIN GROUP HALIDES (Lewis acids and bases)
5 possible AlCl4Br2 isomers

Ng611 (talk) 18:07, 29 May 2019 (BST) You should also give their point groups.
AlCl4Br2 Br bridging isomer
Al, Br, Cl B3LYP/LanL2DZ
AlCL4Br2 Br Bridging optimised optimized molecule |
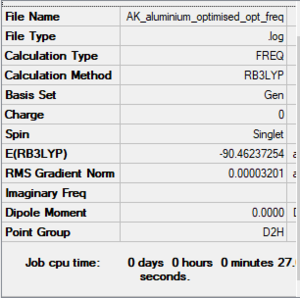
Item               Value     Threshold  Converged?
 Maximum Force            0.000055     0.000450     YES
 RMS     Force            0.000023     0.000300     YES
 Maximum Displacement     0.000835     0.001800     YES
 RMS     Displacement     0.000304     0.001200     YES
Link to the frequency analysis file
 Low frequencies ---   -0.0003    0.0000    0.0000    0.2429    2.0847    3.6746
 Low frequencies ---   16.8583   52.4440   72.9768
AlCl4Br2 Cl bridging trans-isomer
Al, Br, Cl B3LYP/LanL2DZ
AlCL4Br2 Cl Bridging trans optimised optimized molecule |
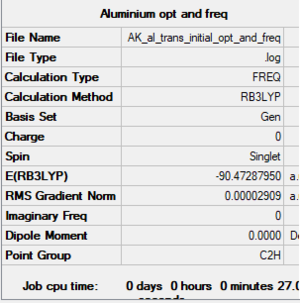
Ng611 (talk) 18:08, 29 May 2019 (BST) Your values are significantly off from the correct values. Did you input your pseudopotential correctly?
Item               Value     Threshold  Converged?
 Maximum Force            0.000064     0.000450     YES
 RMS     Force            0.000026     0.000300     YES
 Maximum Displacement     0.000950     0.001800     YES
 RMS     Displacement     0.000449     0.001200     YES
Link to the frequency analysis file
 Low frequencies ---   -3.5809    0.0000    0.0000    0.0000    2.3120    2.9354
 Low frequencies ---   17.9674   40.4527   64.5589
AlCl2Br
Al, Br, Cl B3LYP/LanL2DZ
AlCl2Br optimized molecule |
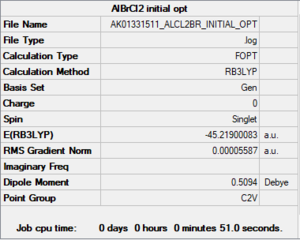
Item               Value     Threshold  Converged?
 Maximum Force            0.000205     0.000450     YES
 RMS     Force            0.000096     0.000300     YES
 Maximum Displacement     0.001133     0.001800     YES
 RMS     Displacement     0.000778     0.001200     YES
Following are the frequencies for the optimised AlCl2Br molecule. As can be seen from the analysis, some variables from the item table did not converge, which indicates that the potential energy surface is very flat. The information is included for referenceː
Item               Value     Threshold  Converged?
 Maximum Force            0.000205     0.000450     YES
 RMS     Force            0.000096     0.000300     YES
 Maximum Displacement     0.002559     0.001800     NO
 RMS     Displacement     0.002272     0.001200     NO
Link to the frequency analysis file
 Low frequencies ---   -0.0004    0.0000    0.0000    0.3591    4.4018    5.3444
 Low frequencies ---  108.1390  119.7508  168.4249
Energies
Al2Cl4Br2 Br bridging molecule = -90.462 au = -237510 kJ/mol
Al2Cl4Br2 Cl trans bridging molecule = -90.473 au = -237540 kJ/mol
1 au = 2625.5 kJ/mol
AlCl2Br = -45.219 au = - 118720 kJ/mol
Dissociation Energy: -237540 - (-118720 x 2) = -100 kJ/mol The dissociation reaction is endothermic, showing that AlCl2Br is more stable.
Stability Discussionː Cl-Cl trans isomer shows greater stability (lower energy) than Br bridging isomer. The bridging bonds are 3c-2e, which are longer and weaker than ‘normal’ 2c-2e bonds. The reason for greater stability can be associated with the more matching Cl/Al atomic sizes (hence atomic orbitals of similar sizes) as they are both from period 3 (Br – period 4), therefore the molecular orbital overlap during bond formation is better hence the interactions for the weaker connecting bonds are stronger, which overall increase the stability.
Molecular Orbital analysis
Lowest energy conformer - Al2Cl4Br2 Cl trans bridging molecule.
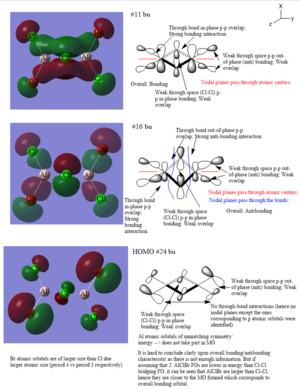
Ng611 (talk) 18:11, 29 May 2019 (BST) Good MO analysis!
References
- ↑ T. Hunt, Figure 5 Annotated MO diagram for BH3, presented in part at the Lecture 4 Tutorial Problem Model Answers, Imperial College London, London, November, 2018.
- ↑ T. T. L. Cottrell, The Strengths of Chemical Bonds, 2d ed., Butterworth, London, 1958; B. deB. Darwent, National Standard Reference Data Series, NationalBureau of Standards, no. 31, Washington, 1970; S. W. Benson, J. Chem. Educ. 42:502 (1965); and J. A. Kerr, Chem. Rev. 66:465 (1966). [Available fromː https://labs.chem.ucsb.edu/zakarian/armen/11---bonddissociationenergy.pdf]
