Rep:Mod:inorganicjp2517
BH3
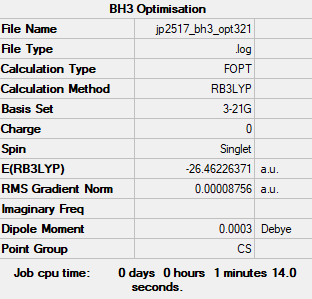
Lower Basis Set
Computational Level: B3LYP
Basis Set: 3-21G
         Item               Value     Threshold  Converged?
 Maximum Force            0.000217     0.000450     YES
 RMS     Force            0.000105     0.000300     YES
 Maximum Displacement     0.000692     0.001800     YES
 RMS     Displacement     0.000441     0.001200     YES
Log file: JP2517 BH3 OPT321.LOG
In terms of presentation, the lower basis set calculation etc. aren't really relevant to the report content and were just revision calculations. It would have been ok maybe if you'd made some supporting comments about why these lower level calculations are sometimes done first etc. Smf115 (talk) 18:34, 1 June 2019 (BST)
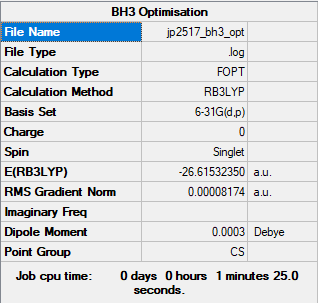
Higher Basis Set
Computational Level: B3LYP
Basis Set: 6-31G(d.p)
         Item               Value     Threshold  Converged?
 Maximum Force            0.000203     0.000450     YES
 RMS     Force            0.000098     0.000300     YES
 Maximum Displacement     0.000849     0.001800     YES
 RMS     Displacement     0.000415     0.001200     YES
Log file: JP2517 BH3 OPT.LOG
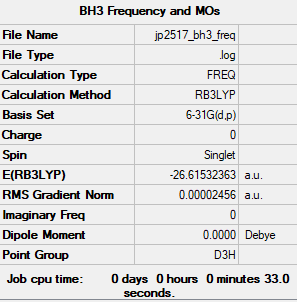
Frequency Calculation
Method: Frequency
Computational Level: B3LYP
Basis Set: 6-31G(d.p)
It's worth noting that before the frequency analysis was performed, the molecule was constrained manually to D3h symmetry and reoptimised.
Frequency file: JP2517 BH3 FREQ.LOG
Low frequencies ---   -0.2279   -0.0081   -0.0012   22.0037   22.0049   24.0346
Low frequencies --- 1163.1731 1213.2725 1213.2727
NH3 |
| Wavenumber (cm-1) | Intensity (arbitrary units) | Symmetry | IR Active? | type |
| 1163 | 92 | A2 | Yes | In-plane symmetric bend |
| 1213 | 14 | E | Yes | Out-of-plane asymmetric bend |
| 1213 | 14 | E | Yes | Out-of-plane symmetric bend |
| 2582 | 0 | A1' | No | Symmetric stretch |
| 2715 | 126 | E' | Yes | Asymmetric stretch |
| 2715 | 126 | E' | Yes | Asymmetric stretch |
The IR spectrum shows only three peaks, despite there being six modes present. The one occurring at 2582 cm-1 is IR inactive, as the symmetry with which the stretch occurs results in no change in dipole moment. There are two more pairs of vibrations which occur at the same wavenumber, 1213 cm-1 and 2715 cm-1, which overlap, meaning only three peaks are left in the spectrum. The peaks occurring at 1213 cm-1 involve only a slight change in dipole moment, thus less IR radiation is absorbed in the vibration, hence why they appear with less intensity on the spectrum.
Clear analysis of the spectra and the vibrational modes of the molecule! Smf115 (talk) 18:38, 1 June 2019 (BST)
MO Diagram
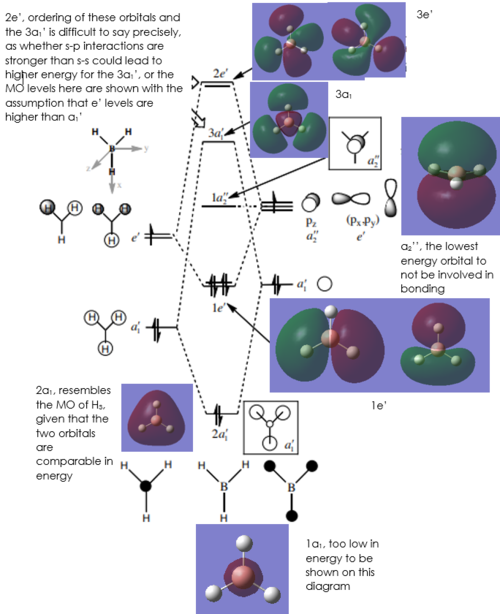
[1] Diagram adapted from: Dr Patricia Hunt, BH3 MO Diagram, http://www.huntresearchgroup.org.uk/teaching/teaching_comp_lab_year2a/Tut_MO_diagram_BH3.pdf
As can be seen on the diagram, there aren't really any significant differences between the real MOs and the LCAO MOs in terms of their shape and relative energy levels, which is a good indicator of the usefulness of qualitative MO Theory. The 'real' MOs have been blended together a bit more, with continuous regions of each phase, unlike on the LCAO diagram, where orbitals of the same phase are not necessarily shown to overlap. From here, it can be used to predict the reactivity of the molecule based on which MOs are occupied.
Clear inclusion of the calculated MOs on to the MO diagram and an ok evaluation of the usefulness of LCAO theory. However, the difference mentioned of the lack of 'blending together' is just due to the drawing convention of the LCAOs and you could have instead considered the differences in terms of orbital contributions (e.g. look at the 3a1' or 2e' MOs), for example. The comparison might have been easier if the LCAOs were also included in the MO diagram. Smf115 (talk) 18:42, 1 June 2019 (BST)
Association Energies
We already have the energy of BH3, and it's -26.62 a.u.
Therefore, to compute the reaction energy, we need the energies of the optimised NH3BH3 molecule and the NH3 molecule.
NH3BH3 Optimisation and Frequency Analysis
Computational Level: B3LYP
Basis Set: 6-31G (d.p.)
         Item               Value     Threshold  Converged?
 Maximum Force            0.000122     0.000450     YES
 RMS     Force            0.000058     0.000300     YES
 Maximum Displacement     0.000539     0.001800     YES
 RMS     Displacement     0.000297     0.001200     YES
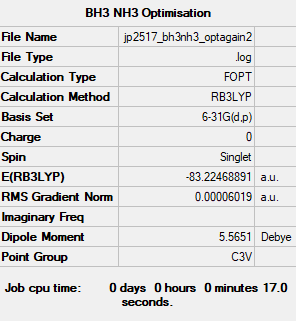
Log file: JP2517 BH3NH3 OPTAGAIN2.LOG
Low frequencies ---   -0.0250   -0.0031    0.0012   17.1394   17.1417   37.1989
Low frequencies ---  265.8013  632.2135  639.3553
Frequency File: JP2517 BH3NH3 FREQ2.LOG
NH3BH3 |
NH3 Optimisation and Frequency Analysis
Computational Level: B3LYP
Basis Set: 6-31G (d.p.)
         Item               Value     Threshold  Converged?
 Maximum Force            0.000006     0.000450     YES
 RMS     Force            0.000004     0.000300     YES
 Maximum Displacement     0.000012     0.001800     YES
 RMS     Displacement     0.000008     0.001200     YES
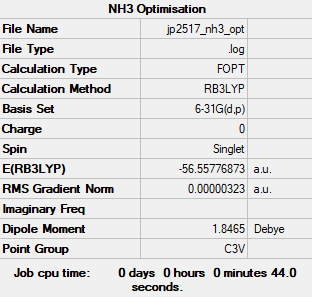
Log file: JP2517 NH3 OPT.LOG
Low frequencies ---   -0.0138   -0.0032   -0.0015    7.0783    8.0932    8.0937
Low frequencies --- 1089.3840 1693.9368 1693.9368
Frequency file: JP2517 NH3 FREQ2.LOG
NH3 |
Energy Calculation
From this it can be seen that the energies of the molecules are as follows:
E(NH3)= -56.56 a.u.
E(BH3)=-26.62 a.u.
E(NH3BH3)= -83.22 a.u.
Therefore, ΔE for this process = E(NH3BH3)-[E(NH3)+E(BH3)] = -0.04 a.u.
Converted to kJmol-1, this is -105.02 kJmol-1
Based on this calculation, it's clear that the B-N dative bond is pretty weak, when compared to a B-B bond at 293 kJmol-1 and an N-N bond at 167 kJmol-1 [2] . However, this process is overall exothermic, thus there is energy gain in forming it.
Good comparison with referenced literature values. However, you have truncated the energy values too early leading to an incorrect answer. To improve, full figures should be used in calculations and the final reported energy values should then be left to the correct degree of accuracy (5 d.p. for a.u. and the nearest 1 kJmol-1). Smf115 (talk) 18:47, 1 June 2019 (BST)
Heavy Molecule Optimisation
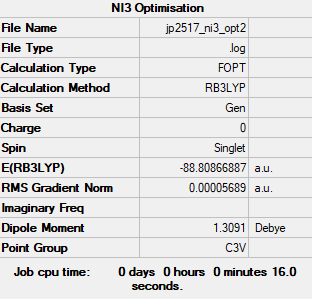
NI3 is the molecule to be optimised.
Method: B3LYP
Basis Set: GEN
         Item               Value     Threshold  Converged?
 Maximum Force            0.000084     0.000450     YES
 RMS     Force            0.000062     0.000300     YES
 Maximum Displacement     0.001108     0.001800     YES
 RMS     Displacement     0.000520     0.001200     YES
Log file: JP2517 NI3 OPT2.LOG
Low frequencies ---   -1.7762   -1.7378   -0.7557   -0.0031    0.0322    0.0731
Low frequencies ---  101.3565  101.3572  148.4310
Frequency file: JP2517 NI3 FREQ.LOG
NI3 |
From the calculations, we can see that the optimised N-I distance is 2.18 Å, much longer than the N-H distance in NH3 due to the larger and more diffuse Iodine orbitals providing reduced overlap with the N orbitals, hence the longer, weaker bond.
Correct implementation of the pseudopotential and nice comment on the comparative bond lengths. Just note that 'GEN' wasn't the basis set used, this is just a keyword which tells Gaussian to read in user-defined input for the basis-set and pseudopotential. Smf115 (talk) 18:48, 1 June 2019 (BST)
Ionic Liquids
Two ionic liquids will be investigated: [N(CH3)4]+ and [P(CH3)4]+, in order to investigate their charge distributions and molecular orbitals, with a view to predicting their properties without synthesising them.
[N(CH3)4]+
Optimisation
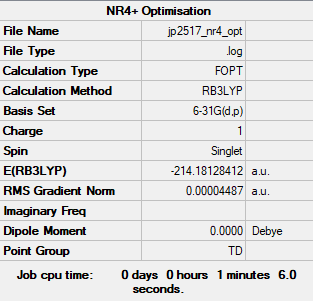
Before commencing optimisation, the molecule was constrained to Td symmetry.
Method: B3LYP
Basis Set: 6-31G(d,p)
         Item               Value     Threshold  Converged?
 Maximum Force            0.000068     0.000450     YES
 RMS     Force            0.000027     0.000300     YES
 Maximum Displacement     0.000151     0.001800     YES
 RMS     Displacement     0.000067     0.001200     YES
Log file: JP2517 NR4 OPT.LOG
 Low frequencies ---   -0.0005   -0.0004    0.0003   22.7128   22.7128   22.7128
 Low frequencies ---  190.7454  294.0627  294.0627
Frequency file: JP2517 NR4 FREQ.LOG
[N(CH3)4]+ |
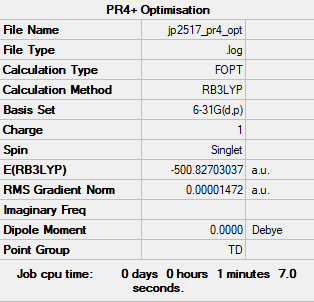
[P(CH3)4]+
Optimisation
         Item               Value     Threshold  Converged?
 Maximum Force            0.000030     0.000450     YES
 RMS     Force            0.000012     0.000300     YES
 Maximum Displacement     0.000107     0.001800     YES
 RMS     Displacement     0.000044     0.001200     YES
Log file: JP2517 PR4 OPT.LOG
Low frequencies ---   -0.0016    0.0019    0.0020   25.3058   25.3058   25.3058
Low frequencies ---  161.2513  195.7468  195.7468
Frequency file: JP2517 PR4 FREQ.LOG
[P(CH3)4]+ |
Charge Distribution Comparison
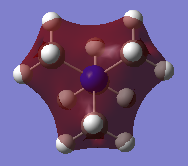
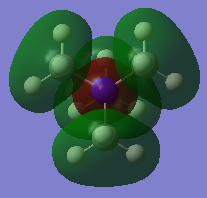
The Charge Distribution was computed for both molecules and yielded the following images.
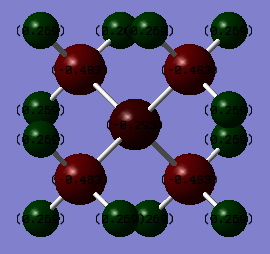
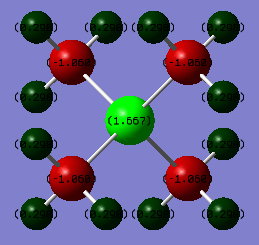
[N(CH3)4]+
| Atom | Charge |
| N | -0.295 |
| C | -0.483 |
| H | +0.269 |
| Δ charge | 0.591 |
[P(CH3)4]+
| Atom | Charge |
| P | +1.667 |
| C | -1.060 |
| H | +0.298 |
| Δ charge | 2.727 |
The differences between the two charge distributions are as follows:
- The amount of charge residing on the central atom; Nitrogen in [N(CH3)4]+ carries much more electron density (-0.295) than Phosphorus in [P(CH3)4]+ (+1.667). This is largely due to the higher electronegativity of N compared to P. Nitrogen has smaller orbitals (in fact, a lack of d-orbitals), meaning the effective nuclear charge on the outermost electrons is greater, hence its ability to attract a negative charge is greater, which is why more negative charge resides on it in this complex.
- The polarity of the P/N atom to Carbon bond; [N(CH3)4]+ ranges from -0.483 to +0.269, while [P(CH3)4]+ ranges from -1.060 to +1.667, meaning its bonds are more polar overall. This is due to the fact that while Nitrogen is more electronegative than Phosphorus, Nitrogen has a more similar electronegativity to Carbon than Phosphorus, thus the polarity of the Group 5 element to C bond is lower for Nitrogen.
- The amount of electron density residing on H; for [N(CH3)4]+ the relative charge distribution on the H atoms is +0.269, while for [P(CH3)4]+ the Hydrogens have less electron density on them, at +0.298. This is due to the fact that in [N(CH3)4]+, the carbons of the methyl groups carry less of the electron density (-0.483) than in the methyl groups of [P(CH3)4]+ (-1.060), therefore there is less electron density shared among the Hydrogens in [P(CH3)4]+, which is why they're sharing more positive charge.
Clearly presented NBO charges using the same colour range for both ILs. The charge analysis is good and you've raised some good points based on the relative electronegativities but other effects could have been mentioned. It might be worth considering that the charges on the H atoms are actually very similar given the relative N/P-C bond polarities, can you link this to the diffuse nature of the P orbitals? Smf115 (talk) 20:31, 3 June 2019 (BST)
Based on the results for [N(CH3)4]+, it's clear that the traditional description, featuring a +1 charge on the Nitrogen, is largely inaccurate. This traditional description represents a +1 charge seated wholly on the Nitrogen, with the other atoms being neutral, which is more of a valence-bond approach. By computing the Molecular Orbitals and producing the charge distribution for [N(CH3)4]+, we can see that the charge is in fact spread more evenly across all the atoms in the molecule, and is specifically located primarily on the Hydrogen atoms in this cation.
Conversely, in [P(CH3)4]+, the traditional description is more accurate, with most of the positive charge residing on the central P atom.
Good identification of where the charge actually sits and comparison to [P(CH3)4]+, however, you haven't really explained why the +1 formal charge arises which is from formal electron counting. Smf115 (talk) 20:35, 3 June 2019 (BST)
Molecular Orbitals
[N(CH3)4]+
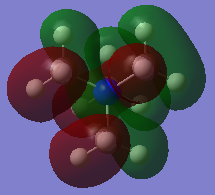
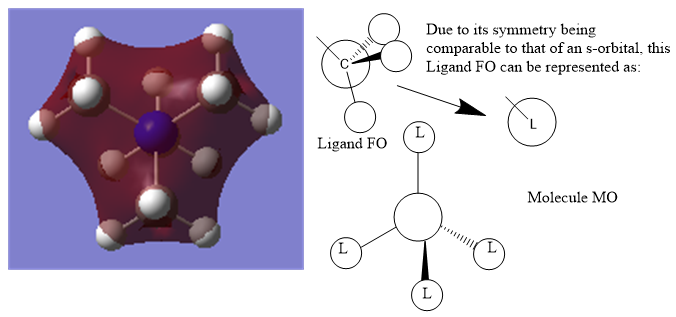
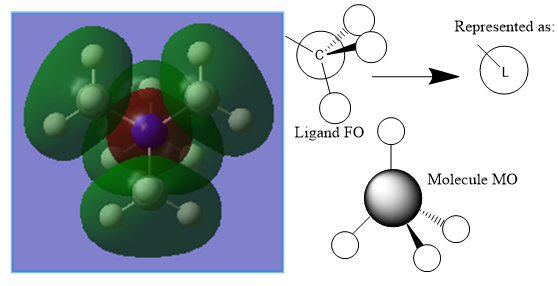
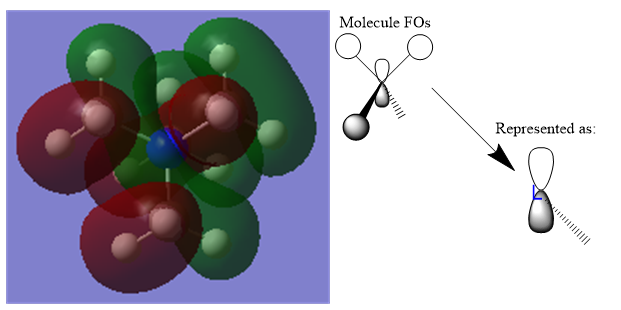
All of the occupied MOs for [N(CH3)4]+ were visualised, including the five lowest-energy unoccupied Molecular Orbitals, making 26 in total. Three of these were chosen and the LCAO diagram was generated for them.
From left to right, the MOs in question are MO 6, MO 10 and MO 21 (the HOMO).
LCAO Diagrams
Molecular Orbital 6 is a valence bonding orbital deep in energy with mostly bonding character, hence why it appears red, and the ligand FO can be approximated to an s-orbital for simplification due to its spherical symmetry.
Molecular Orbital 10 is a valence antibonding orbital. Similarly to MO 6, the Ligand FO can be approximated to an s-orbital due to it being spherically symmetric, however the difference here is the amount of antibonding character, leading to a different molecule MO.
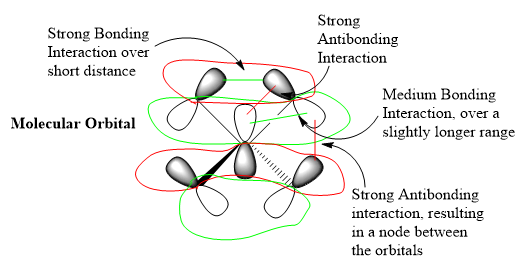
Molecular Orbital 21 is the HOMO and features a mixture of bonding and antibonding interactions. The ligand FOs have similar symmetry to a p-orbital, given that there are nodes halfway across the C-H bonds, thus can be approximated as such.
Ok MO analysis, while your FOs and LCAOs are correct the FOs should arise from considering the application of the BH3 MO diagram to CH3 and not quite from your reasoning. You've identified some of the interactions but it would have been better to see a little more analysis and the bottom annotations could be clearer. Smf115 (talk) 21:13, 3 June 2019 (BST)
Final Note
The thing I found most useful about this project was being able to see the concepts we've studied in Dr. Hunt's Molecular Orbital Theory course being brought to life in a computational chemistry environment. Having studied BH3 on paper, it was fascinating to optimise it and play around with the real MOs. The larger molecules, such as [N(CH3)4]+, have some fantastically complicated Molecular Orbitals. I feel that I've been able to use this lab to brush up on my knowledge of Molecular Orbital theory and apply some of the concepts we've learned to their real-world applications.
Overall, a decent report with well-presented sturcture information throughout.Smf115 (talk) 21:13, 3 June 2019 (BST)
References
1. Diagram adapted from: Dr Patricia Hunt, BH3 MO Diagram, http://www.huntresearchgroup.org.uk/teaching/teaching_comp_lab_year2a/Tut_MO_diagram_BH3.pdf
2. http://www.wiredchemist.com/chemistry/data/bond_energies_lengths.html

