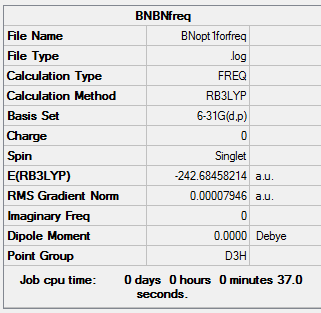
Rep:Mod:inorganicjk1911
Computational Modelling of Simple Inorganic Molecules
Jan Kosco
Part 1: BH3
Generating Distorted BH3 molecule
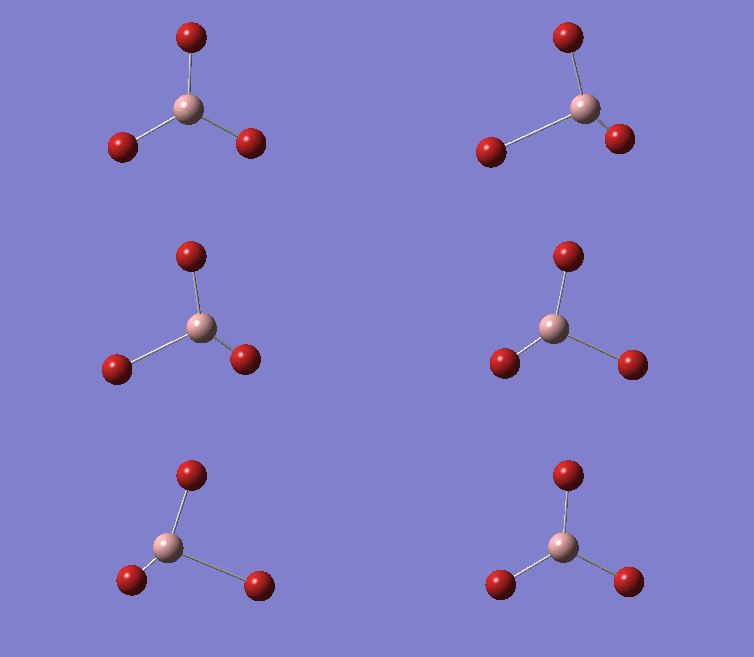
A molecule of BH3 was generated using the default geometry where all B-H bond lengths are the same at 1.180 Å. In order to break the D3h symmetry of the molecule, one bond was elongated to 1.53 Å, one to 1.54 Å, and one to 1.55 Å. This breaks the symmetry of the molecule by making it lose its C3 axis, σV planes, and C2 axes.
| Initial BH3, all bond lengths are equal. | |||
|---|---|---|---|
| |||
| Distorted BH3. All bonds different lengths. | |||
|
Optimising Distorted BH3 molecule
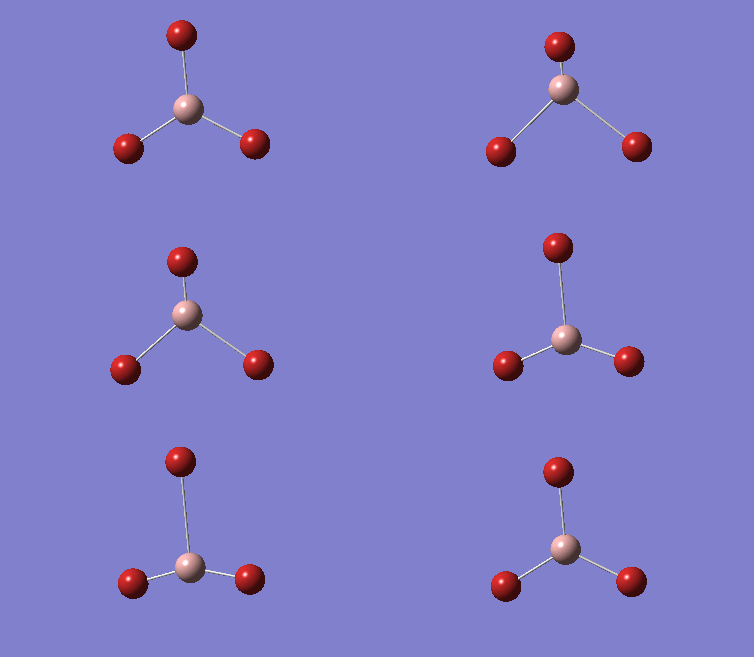
A rough geometry optimisation was carried out using a B3LYP method, with a 3-21G basis set. The BH3 molecule is generated with roughly equal B-H bond lengths.
| 3-21G optimised BH3. | |||
|---|---|---|---|
|
Calculation Summary
BH3 optimisation jk
- File Name = JKBH3OPTIMISATION.log
- File Type = .log
- Calculation Type = FOPT
- Calculation Method = RB3LYP
- Basis Set = 3-21G
- E(RB3LYP) = -26.46226429 a.u.
- RMS Gradient Norm = 0.00008851 a.u.
- Dipole Moment = 0.0003 Debye
- Point Group = CS
- Job cpu time: 0 days 0 hours 0 minutes 21.0 seconds.
 Item               Value     Threshold  Converged?
 Maximum Force            0.000220     0.000450     YES
 RMS     Force            0.000106     0.000300     YES
 Maximum Displacement     0.000709     0.001800     YES
 RMS     Displacement     0.000447     0.001200     YES
 Predicted change in Energy=-1.672479D-07
 Optimization completed.
    -- Stationary point found.
                           ----------------------------
                           !   Optimized Parameters   !
                           ! (Angstroms and Degrees)  !
 --------------------------                            --------------------------
 ! Name  Definition              Value          Derivative Info.                !
 --------------------------------------------------------------------------------
 ! R1    R(1,2)                  1.1947         -DE/DX =   -0.0002              !
 ! R2    R(1,3)                  1.1944         -DE/DX =   -0.0001              !
 ! R3    R(1,4)                  1.1948         -DE/DX =   -0.0002              !
 ! A1    A(2,1,3)              119.9983         -DE/DX =    0.0                 !
 ! A2    A(2,1,4)              120.0157         -DE/DX =    0.0                 !
 ! A3    A(3,1,4)              119.986          -DE/DX =    0.0                 !
 ! D1    D(2,1,4,3)            180.0            -DE/DX =    0.0                 !
 --------------------------------------------------------------------------------
 GradGradGradGradGradGradGradGradGradGradGradGradGradGradGradGradGradGrad
All of the optimisation items have converged, which indicates that a minimum in the potential surface has been reached, however not all of the B-H bond lengths are exactly equal. This is due to the inaccurate nature of the optimisation. The unequal bond lengths break the symmetry of the molecule, and leave it with a lower symmetry point group.
Results
Bond lengths
All B-H bond lengths are equal to 1.19 Å, but vary in the last few decimal places.
Bond Angles
All bond angles are 120.0˚
Energy 3-21G
The energy converges at -26.46226429 a.u.
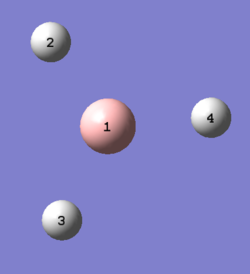
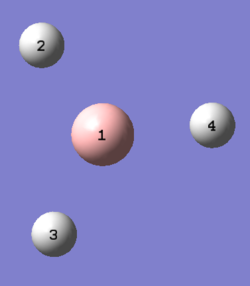
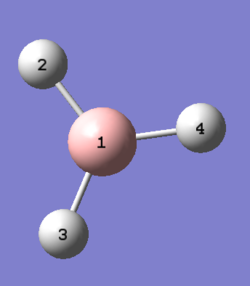
The optimisation of BH3 takes 7 steps (see log file in link above). During the optimisation the B-H distances get progressively shorter, until at step 4 they are displayed as bonds. The bond assignment in Gaussview is based only on a predefined bond distance criteria; once two nuclei are closer together than a certain value, a bond is drawn. A more comprehensive definition of a “bond” could be achieved by imposing a minimum attractive force that needs to be between two atoms before a bond is displayed between them. The attractive force could be determined from the gradient of the potential surface for individual atoms once the overall geometry has been optimised.
 |
 |
 |
 |
 |
 |
 |
The geometry is optimised once the global minimum in the potential surface for the entire molecule is found. This geometry should have all forces balanced (0 RMS gradient), and the most negative energy. As can be seen from the graphs of geometry optimisation, the energy is the most negative in the final structure, but zero RMS gradient has not been reached. Further optimisation could therefore be done using a more accurate model to yield a BH3 molecule with equal B-H bond lengths. RMS gradient converges at 0.0000885130 Hartree/Bohr.
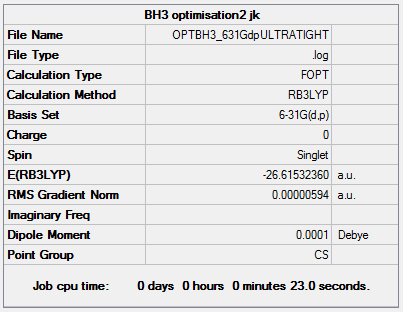
Further Optimisation of BH3 Using 6-31G(d,p) Basis Set
The roughly optimised geometry from the 3-21G basis set is subjected to further optimisation using a larger basis set: 6-31G(d,p).
Calculation Summary
- BH3 optimisation2 jk
- File Name = OPTBH3_631Gdp
- File Type = .log
- Calculation Type = FOPT
- Calculation Method = RB3LYP
- Basis Set = 6-31G(d,p)
- Charge = 0
- Spin = Singlet
- E(RB3LYP) = -26.61532360 a.u.
- RMS Gradient Norm = 0.00000707 a.u.
- Dipole Moment = 0.0001 Debye
- Point Group = CS
Job cpu time: 0 days 0 hours 0 minutes 5.0 seconds.
 Item               Value     Threshold  Converged?
 Maximum Force            0.000012     0.000450     YES
 RMS     Force            0.000008     0.000300     YES
 Maximum Displacement     0.000061     0.001800     YES
 RMS     Displacement     0.000038     0.001200     YES
 Predicted change in Energy=-1.069288D-09
 Optimization completed.
    -- Stationary point found.
                           ----------------------------
                           !   Optimized Parameters   !
                           ! (Angstroms and Degrees)  !
 --------------------------                            --------------------------
 ! Name  Definition              Value          Derivative Info.                !
 --------------------------------------------------------------------------------
 ! R1    R(1,2)                  1.1923         -DE/DX =    0.0                 !
 ! R2    R(1,3)                  1.1923         -DE/DX =    0.0                 !
 ! R3    R(1,4)                  1.1923         -DE/DX =    0.0                 !
 ! A1    A(2,1,3)              120.0007         -DE/DX =    0.0                 !
 ! A2    A(2,1,4)              120.0055         -DE/DX =    0.0                 !
 ! A3    A(3,1,4)              119.9938         -DE/DX =    0.0                 !
 ! D1    D(2,1,4,3)            180.0            -DE/DX =    0.0                 !
 --------------------------------------------------------------------------------
 GradGradGradGradGradGradGradGradGradGradGradGradGradGradGradGradGradGrad
Results
Bond Lengths
All B-H bond lengths are equal to 1.19 Å, but still vary slightly in the last few decimal places.
This signifies that either the equilibrium structure does not have D3h symmetry, or the structure has not been fully optimised.
Bond Angles
All bondangles are equal to 120.0˚.
Energy 6-31G(d,p)
The energy converges at -26.61532360 a.u.
Part 2: GaBr3
GaBr3 Structural Optimisation
A molecule of GaBr3 was generated in a rough geometry, and its symmetry was very strictly constrained to D3h (tolerance: Very tight (0.0001)). This geometry was subjected to geometry optimisation using a DFT method with a LanL2DZ basis set.
Calculation Summary
- GaBr3_optimisation_jk
- File Name = Optimised_geometry_of_GaBr3
- File Type = .log
- Calculation Type = FOPT
- Calculation Method = RB3LYP
- Basis Set = LANL2DZ
- Charge = 0
- Spin = Singlet
- E(RB3LYP) = -41.70082783 a.u.
- RMS Gradient Norm = 0.00000016 a.u.
- Dipole Moment = 0.0000 Debye
- Point Group = D3H
- Job cpu time: 0 days 0 hours 0 minutes 23.0 seconds.
Item               Value     Threshold  Converged?
 Maximum Force            0.000000     0.000450     YES
 RMS     Force            0.000000     0.000300     YES
 Maximum Displacement     0.000003     0.001800     YES
 RMS     Displacement     0.000002     0.001200     YES
 Predicted change in Energy=-1.282691D-12
 Optimization completed.
    -- Stationary point found.
                           ----------------------------
                           !   Optimized Parameters   !
                           ! (Angstroms and Degrees)  !
 --------------------------                            --------------------------
 ! Name  Definition              Value          Derivative Info.                !
 --------------------------------------------------------------------------------
 ! R1    R(1,2)                  2.3502         -DE/DX =    0.0                 !
 ! R2    R(1,3)                  2.3502         -DE/DX =    0.0                 !
 ! R3    R(1,4)                  2.3502         -DE/DX =    0.0                 !
 ! A1    A(2,1,3)              120.0            -DE/DX =    0.0                 !
 ! A2    A(2,1,4)              120.0            -DE/DX =    0.0                 !
 ! A3    A(3,1,4)              120.0            -DE/DX =    0.0                 !
 ! D1    D(2,1,4,3)            180.0            -DE/DX =    0.0                 !
 --------------------------------------------------------------------------------
 GradGradGradGradGradGradGradGradGradGradGradGradGradGradGradGradGradGrad
GaBr3 optimised geometry LanL2DZ DOI: http://hdl.handle.net/10042/26074
| Optimised Structure of GaBr3, all bond lengths are equal. | |||
|---|---|---|---|
|
Bond Lengths
All Ga-Br bond lengths are equal at 2.35 Å. GaBr3 is electron deficient, so it doesn’t exist as a monomer in the solid state. This makes it difficult to determine the Ga-Br bond length for this compound. The literature bond length of gaseous GaBr3 determined by electron diffraction is 2.239 +/- 0.007 Å [1] The reported geometry is planar. The computed bond lengths for GaBr3 agree to within 0.1 Å, with the experimentally determined bond lengths . This shows that the computed bond lengths are reasonable, and computational models could be useful for studying the properties of these unstable compounds.
Bond Angles
All bond angles are 120.0˚, as this is what the D3h point group requires. The trigonal planar structure is consistent with the literature. [1] This is what is expected, because this is the structure in which the Br atoms are furthest from each other.
Part 3: BBr3
BBr3 Structural Optimisation
A molecule of BBr3 was created in a rough geometry, starting from the 6-31G(d,p) optimised BH3 geometry. Structural optimisation was carried out
using a 6-31G(d,p) basis set for the light B atom, and a LanL2DZ pseudo potential for the heavy Br atoms. During the optimisation the B-Br bonds
shortened slightly.
Summary
- Filename = E:/3rdyearlab/BBr3/OutputBBr3optimised.log
- File Name = OutputBBr3optimised
- File Type = .log
- Calculation Type = FOPT
- Calculation Method = RB3LYP
- Basis Set = Gen
- Charge = 0
- Spin = Singlet
- E(RB3LYP) = -64.43645013 a.u.
- RMS Gradient Norm = 0.00000965 a.u.
- Dipole Moment = 0.0004 Debye
- Point Group = CS
- Job cpu time: 0 days 0 hours 0 minutes 35.6 seconds.
Item               Value     Threshold  Converged?
 Maximum Force            0.000015     0.000450     YES
 RMS     Force            0.000009     0.000300     YES
 Maximum Displacement     0.000069     0.001800     YES
 RMS     Displacement     0.000041     0.001200     YES
 Predicted change in Energy=-1.505647D-09
 Optimization completed.
    -- Stationary point found.
                           ----------------------------
                           !   Optimized Parameters   !
                           ! (Angstroms and Degrees)  !
 --------------------------                            --------------------------
 ! Name  Definition              Value          Derivative Info.                !
 --------------------------------------------------------------------------------
 ! R1    R(1,2)                  1.934          -DE/DX =    0.0                 !
 ! R2    R(1,3)                  1.9339         -DE/DX =    0.0                 !
 ! R3    R(1,4)                  1.9339         -DE/DX =    0.0                 !
 ! A1    A(2,1,3)              120.0018         -DE/DX =    0.0                 !
 ! A2    A(2,1,4)              119.9974         -DE/DX =    0.0                 !
 ! A3    A(3,1,4)              120.0008         -DE/DX =    0.0                 !
 ! D1    D(2,1,4,3)            180.0            -DE/DX =    0.0                 !
 --------------------------------------------------------------------------------
 GradGradGradGradGradGradGradGradGradGradGradGradGradGradGradGradGradGrad
BBr3 Optimised Geometry 631G (d,p) and LanL2DZ
DOI: http://hdl.handle.net/10042/26082
The item table confirms that the geometry has been optimised and the energy minimum has been found.
Bond Lengths
All bond lengths are roughly equal at 1.93 Å
Bond Angles
All bond angles are equal at 120.0˚
As with the BH3 molecule, the geometry wasn’t constrained strictly to D3h, so the bond lengths are not all identical, and the bond angles are not
all exactly 120.000˚. The deviations are however so small that they can be neglected in this case.
|
Compound |
BH3 |
BBr3 |
GaBr3 |
|
Bond Length/Å |
1.19
|
1.93
|
2.35
|
Table 1: Comparing bond lengths for BX3 species
Effect of Changing the Ligand: BH3 vs. BBr3
It is clear from the above diagram that the B-H bond is much shorter than the B-Br bond. Both B-X bonds are formally 2c-2e single bonds, so the length difference doesn’t come from the bond order. More important are the orbitals used to bond to B. The H3 fragment bonds to B using fragment orbitals derived from three H 1s orbitals. These orbitals are small and electron dense, so they overlap strongly with the B 2s and 2p electrons. Furthermore, the electronegativities of B and H are very similar, and they both have small orbitals, so the orbital energies should be roughly similar as well. A bond between orbitals that are close in energy with good overlap is a strong interaction, and the stronger the bond the shorter the bond. The Br3 fragment bonds to the B using fragment orbitals derived from Br 3s and 3p orbitals, with net bonding coming mainly from the 3p orbitals. Because Br is in period 3, its orbitals are much larger and much more diffuse than the orbitals on hydrogen. However, Br is significantly more electronegative than B (and H), so the energy difference between the B and Br orbitals is much larger than for the B and H orbitals. This results in a fairly large energy gap, and worse orbital overlap, but it gives rise to a polar bond. The extra ionic component that comes from the polar bond strengthens the bond, making it stronger than the B-H bond. The length difference therefore is not due to bond strength.
Br is a much larger atom than H with more inner electron shells causing shielding, resulting in a larger VdW radius. This large VdW radius means that the three Br atoms can’t comfortably fit around the central B unless the bond is fairly long. If the Br atoms were too close, there would be too much unfavourable steric repulsion between the large electron clouds on the Br atoms and the B atom. H has a much smaller VdW radius than Br, so the three H atoms can comfortably fit closely around the B without causing unfavourable repulsions. This is the dominant factor in determining bond length here.
Effect of Changing the Central Atom
Both B and Ga are in group 13, but B is in the first row and Ga is in the third row of the p-block. Br bonds to Ga in exactly the same way as it does to B, but the Ga-Br bond has much weaker overlap. This is because the orbitals on Ga are 4s and 4p, not 2s and 2p as on B. The electronegativity difference between Ga and Br is greater than between B and Br, so the ionic component of the bond is stronger. However this is offset by an interaction between the lone pairs on Br and and B; in BBr3 the non-bonding p-lone pairs on Br are able to donate into the vacant p orbital on B, thereby stabilising the molecule and increasing bond order slightly. This interaction is so weak that it is almost negligible in GaBr3 because the orbital overlap is much worse; the empty p orbital on Ga is much more diffuse than on B. Ga also has a much larger VdW radius than B, due to extra d electrons and more electron shells. It therefore follows that the bonds it will form with Br will be longer.
 |
The computational model is consistent with the theory in the order of bond lengths.
What is a Bond?
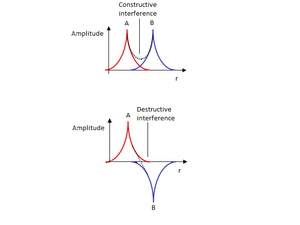
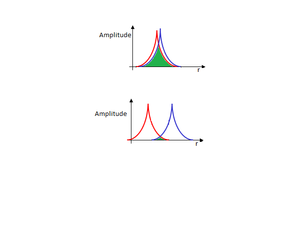
A simple chemical bond is an attractive attraction between two nuclei, caused by the location of electrons between the two nuclei. Nuclei are positively charged and electrons are negatively charged, so nuclei repel each other, and electrons repel each other, but electrons and nuclei attract. Therefore, when the electrons are predominantly between the two nuclei, the net interaction is attractive: a bond is formed. The distribution of electrons is governed by their wavefunctions. A wavefunction for a molecule, a molecular orbital, is formed from a linear combination of atomic orbitals. When atomic orbitals overlap in phase, there is a region of strong constructive interference between the two nuclei, leading to a high amplitude between the nuclei. Because electron density is proportional to the square of the wavefunction amplitude at a particular point, the electron density is high between the nuclei, resulting in an attractive interaction. If the wavefunctions are of opposite phases, there is a region of destructive interference between the two nuclei, and an overall repulsive interaction. This is an antibonding wavefunction.
 |
Gaussian draws bonds based on a predefined bond criteria. The distance between two nuclei at which a bond is drawn depends on the nature of the two nuclei. If the nuclei are further apart, no bond is drawn. This is not an accurate depiction of bonding because there may still be an attractive interaction at a longer distance, as long as the two atomic, or fragment orbitals overlap. The strength of a bond is further dependent on the overlap integral of the two wavefunctions. When the nuclei are close together the overlap integral is large, and the bond is strong. As the nuclei move further apart the overlap, and therefore the bond strength, gets gradually lower until there is no overlap and no bond. There is some optimum distance where the attraction due to the electrons offsets the repulsion of the nuclei the most. The internuclear distance set in Gaussian is most likely somewhere between these two extremes, so even if there is no bond drawn in Gaussian there may still be one in reality as long as the two interacting wavefunctions are in phase, and have a non-zero overlap. A more accurate representation would be to vary the width or opacity of the bond line from a maximum at the equilibrium bond distance, and gradually fade until the bond disappears when its strength is equal to RT.
 |
Frequency Analysis of BH3
The 6-31G(d,p) optimised BH3 molecule was subjected to frequency analysis in order to confirm that the structure found is an energy minimum.
Summary (unconstrained geometry)
Filename = E:\3rdyearlab\BH3\IR\jk_BH3_IRfreq.log
- BH3 frequency jk
- File Name = jk_BH3_IRfreq
- File Type = .log
- Calculation Type = FREQ
- Calculation Method = RB3LYP
- Basis Set = 6-31G(d,p)
- Charge = 0
- Spin = Singlet
- E(RB3LYP) = -26.61532360 a.u. (same as for optimised BH3 structure, so calculating vibrations for correct molecule)
- RMS Gradient Norm = 0.00000703 a.u.
- Imaginary Freq = 0
- Dipole Moment = 0.0001 Debye
- Point Group = CS
- Job cpu time: 0 days 0 hours 0 minutes 11.0 seconds.
Low frequencies ---  -24.9563  -13.1428   -0.0008   -0.0007   -0.0006   15.1819
 Low frequencies --- 1162.9975 1213.0240 1213.1458
Frequencies of optimised BH3 without imposing D3h symmetry
This frequency analysis produced very high low frequency values, which is inconsistent with the real geometry of the molecule. In order to get more meaningful results, the geometry of the molecule had to be constrained to D3h. This produces more realistic low frequency values, with a maximum at 11.74.
Summary (constrained geometry)
- D3hBH3 optimisation2 jk
- File Name = D3hBH3_631Gdpfor IR1
- File Type = .log
- Calculation Type = FREQ
- Calculation Method = RB3LYP
- Basis Set = 6-31G(d,p)
- Charge = 0
- Spin = Singlet
- E(RB3LYP) = -26.61532363 a.u.
- RMS Gradient Norm = 0.00000293 a.u.
- Dipole Moment = 0.0000 Debye
- Point Group = D3H
- Job cpu time: 0 days 0 hours 0 minutes 7.0 seconds.
Low frequencies ---   -0.9452   -0.8686   -0.0055    5.6959   11.6999   11.7380
 Low frequencies --- 1162.9961 1213.1825 1213.1852
Frequencies of optimised BH3 after imposing D3h symmetry
The optimised geometry constrained to D3h has a B-H bond length of 1.19 Å. The low frequencies are all under 15, so the result of this calculation can be considered fairly precise.
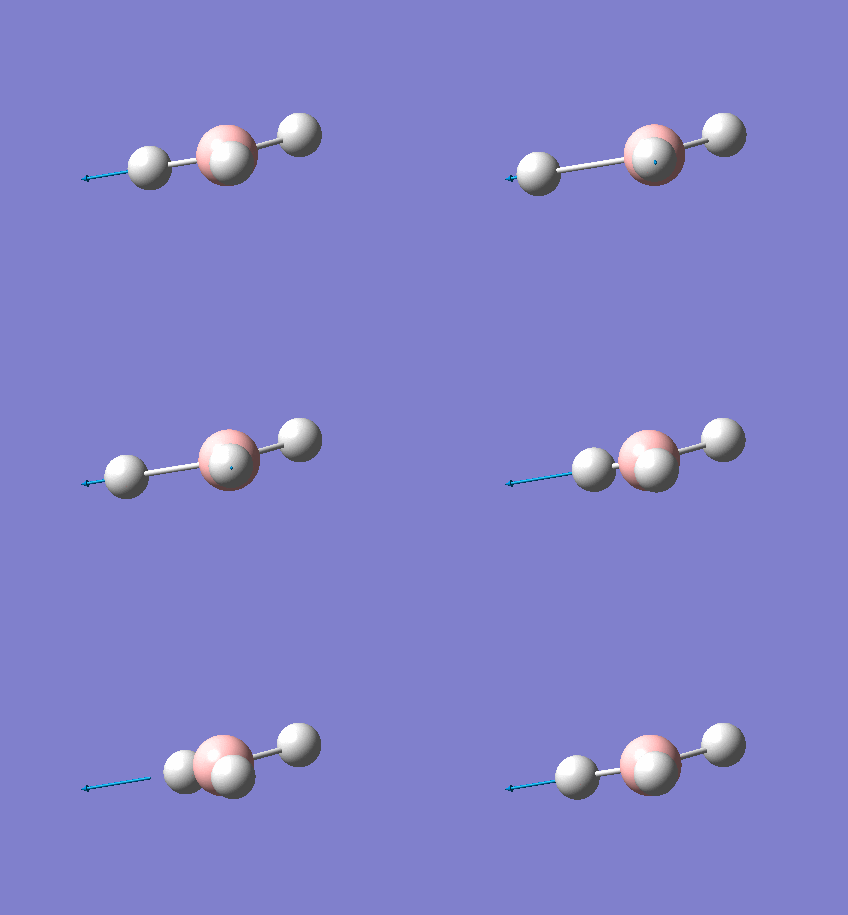
Description of Vibrations
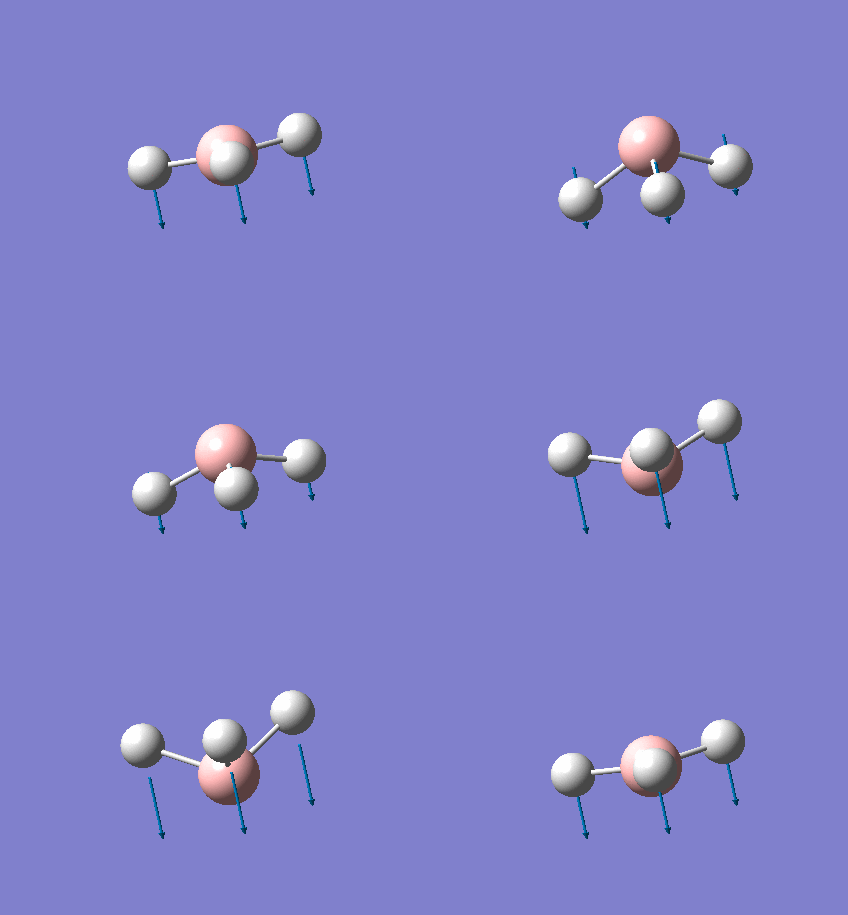
|
No. |
Form of Vibration |
Frequency |
Intensity |
Symmetry |
|
|
All three H atoms move up and down out of the σh plane with a fairly high amplitude, and the central B atom moves up and down out of the plane with a lower amplitude in the opposite phase. |
|
|
|
|
|
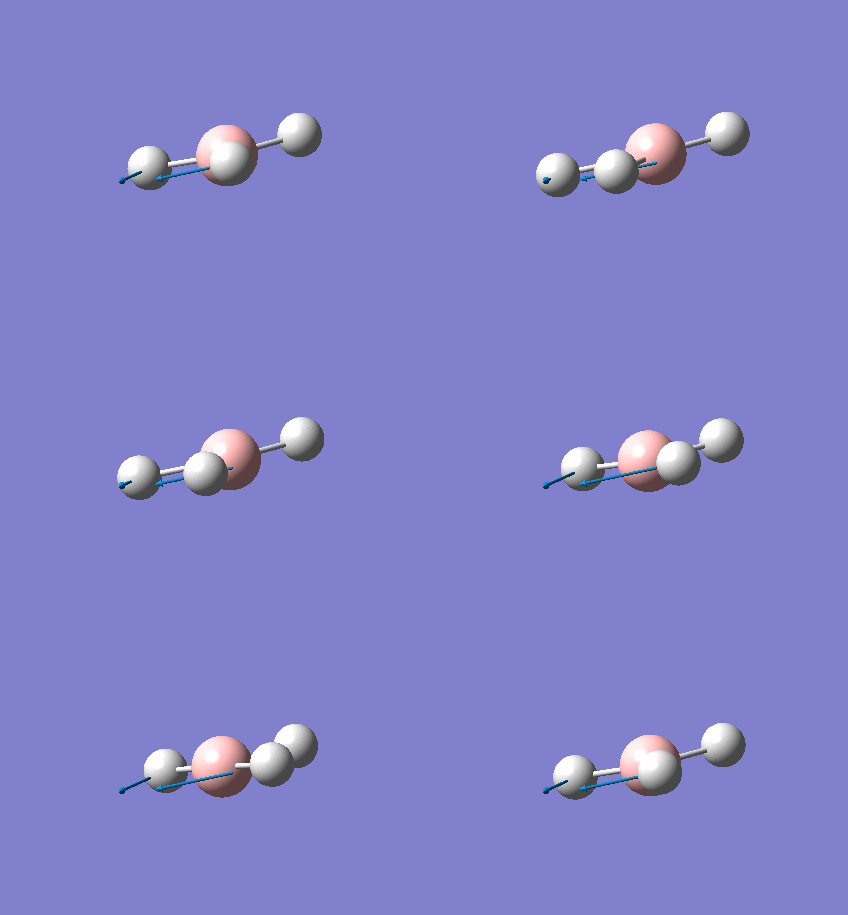
Two of the three H atoms (H1 and H2) “scissor” concertedly in the σh plane. The B-H3 unit moves out of phase with H1 and H2 in the σh plane. The B-H3 bond doesn’t change length. |
|
|
|
|
|
Two of the three H atoms (H1 and H2) “rock” in the σh plane. The third H atom (H3) “rocks” out of phase with, and with approximately twice the amplitude of H1 and H2 in the σh plane. The central B atom moves very slightly, also in the σh plane. |
|
|
|
|
|
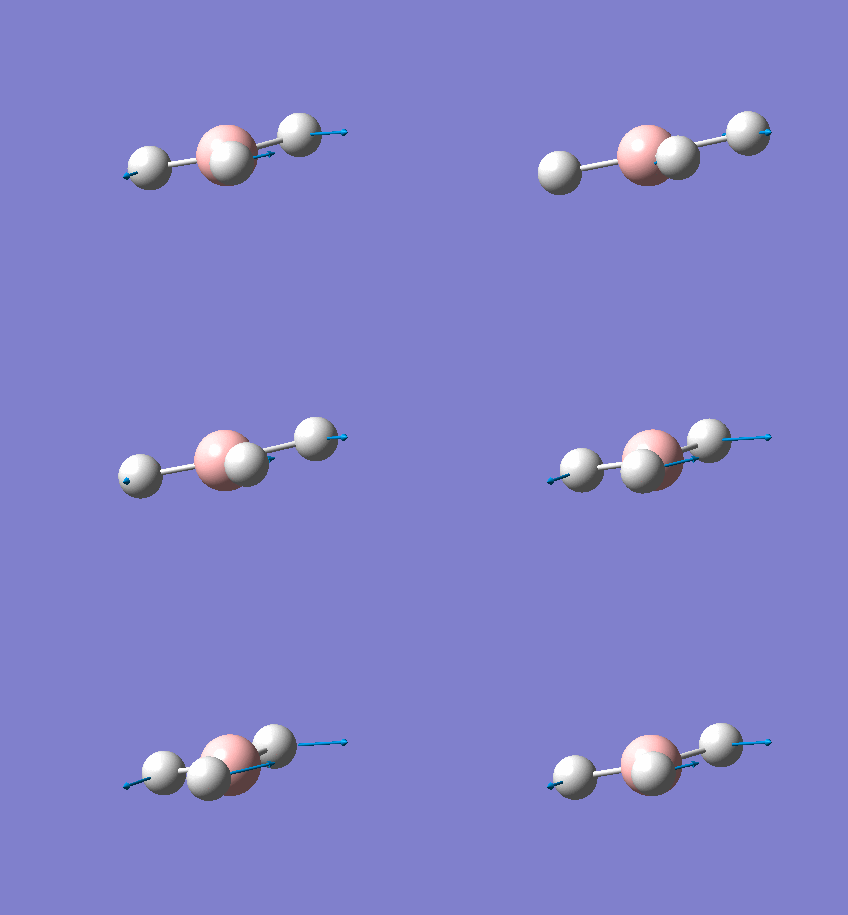
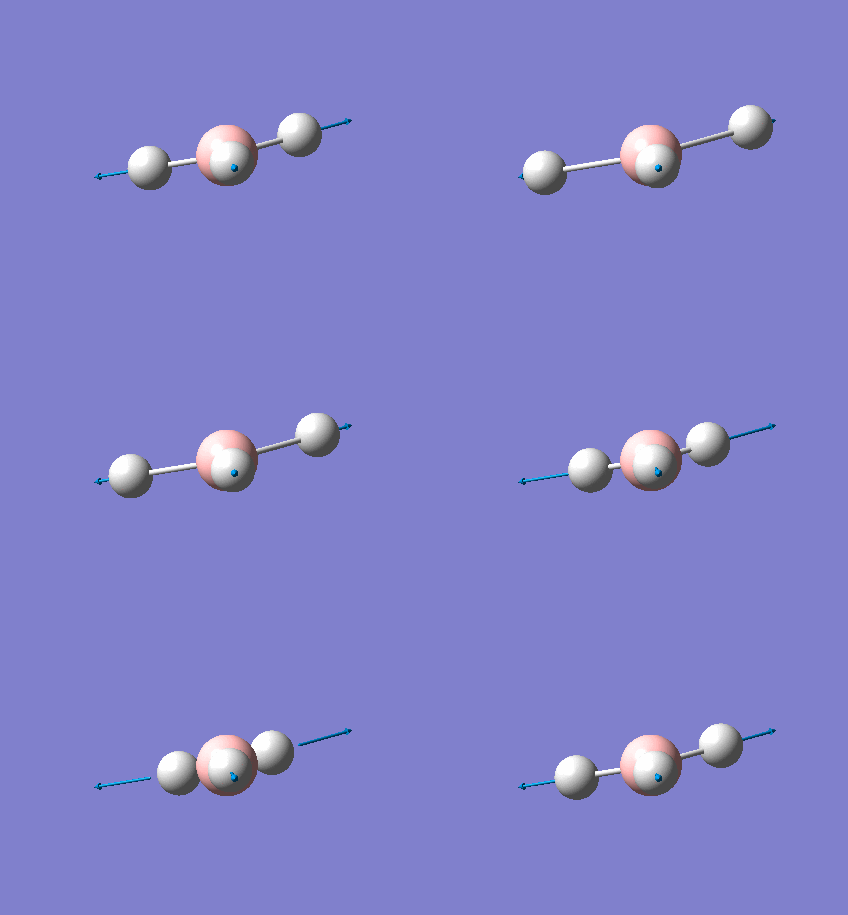
All three B-H bonds stretch and contract concertedly in the σh plane. The central B atom remains stationary. |
|
|
|
|
|
Two of the three B-H bonds stretch and contract periodically. The stretches are out of phase. The final H atom “rocks” very slightly to compensate. |
|
|
|
|
|
Two of the three B-H bonds stretch and contract concertedly, the final B-H bond stretches and contracts with a greater amplitude, out of phase with the other two. All stretches are in the σh plane, and the B atom doesn’t move. |
|
|
|
Table 1: Frequency Analysis of BH3
IR Spectrum
 |
The IR spectrum shows just three peaks for the 6 calculated vibrations. This is because vibrations 2 and 3 are degenerate, and vibrations 5 and 6 are degenerate. This means that the absorptions from them overlap in the spectrum, leading to just one peak from each pair. The third absorption is due to vibration 1. Vibration 4 causes no change in dipole moment in the molecule, so it doesn’t show up on IR.
The peak at 1163 cm-1 is due to vibration 1. The peak at 1213 cm-1 is due to vibrations 2 and 3. There is no peak for vibration 4 because it is not IR active. The peak at 2715 cm-1 is due to vibrations 5 and 6.
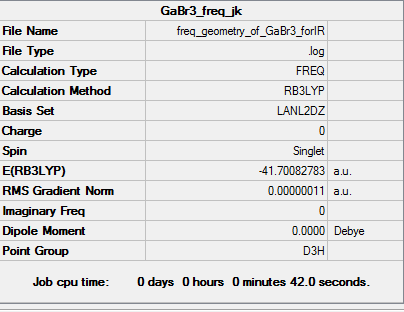
Frequency Analysis of GaBr3
Summary
Low frequencies ---   -0.5252   -0.5247   -0.0024   -0.0010    0.0235    1.2010
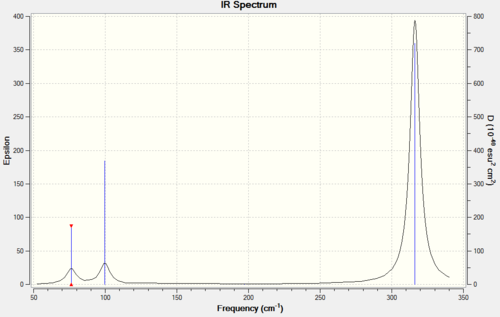
 Low frequencies ---   76.3744   76.3753   99.6982
All low frequencies are less than 15cm-1,which shows that the calculation is reasonably accurate. All normal frequencies are positive, confirming that an energy minimum has been reached.
The lowest "real" vibrational frequency comes from a degenerate set of rocking modes with E' symmetry.
IR Spectrum
 |
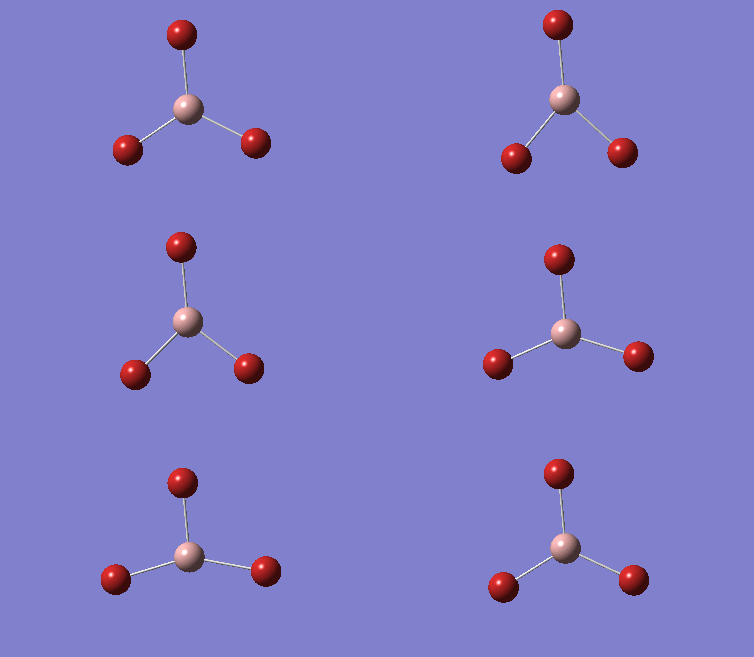
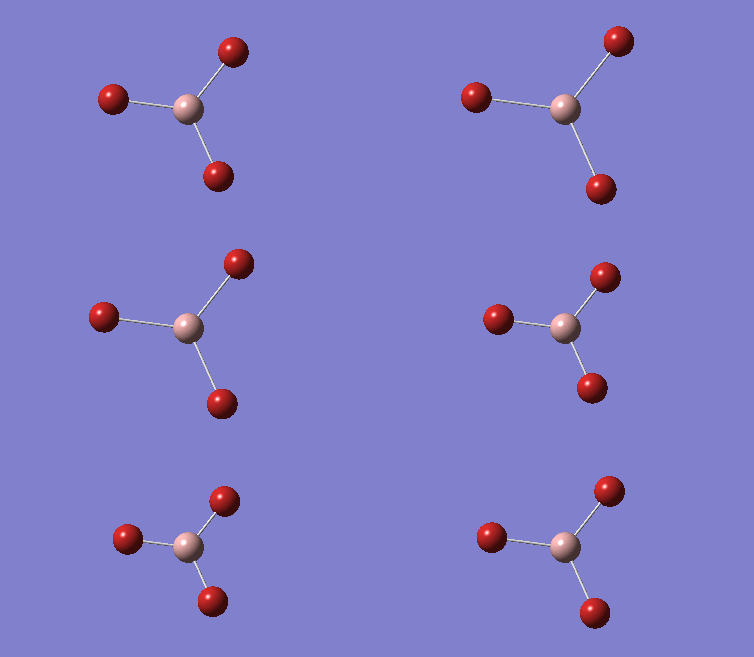
Comparison of Vibrational Frequencies and Modes BH3 and GaBr3
Table 2: Analysis of GaBr3 Vibrations
Analysis of Spectra
Both molecules have the same geometry, so give rise to the same types of vibrational modes, this makes the spectra look very similar. The symmetric stretch does not show up on IR because it causes no change in dipole moment, and the two sets of degenerate E’ vibrations each give rise to one vibrational band. The final A2” vibration gives rise to one band. In both spectra the A2” and “bending” E’ absorptions lie close together at a much lower frequency than the “stretching” A1’ and E’ modes. This is because it takes far more energy to stretch a bond than to bend one, and the energy of the photon that is responsible for the transition is directly proportional to its frequency. Stretching a bond reduces the overlap of the wavefunctions responsible for it, therefore considerably weakening the bond and destabilising the molecule. Compressing the bond increases the nuclear repulsion and also destabilises the molecule significantly. Bending a bond doesn’t change the internuclear distance, so it destabilises the molecule much less. In both spectra the most intense peak is due to the asymmetric stretch E’ mode, this is because the (change in dipole moment/distance moved) is the greatest for this motion. This also explains why all of the peaks for BH3 are more intense than the corresponding peaks for GaBr3: the Ga-Br bond is much longer, so the distance moved in each vibration is much greater for GaBr3 than for BH3, leading to stronger absorptions for BH3.
The general shapes of the spectra are similar, but the GaBr3 spectrum is shifted to a much lower frequency, despite fairly strong Ga-Br bonds. This is because:
where k is the spring constant for the bond, c is the speed of light, and μ is the reduced mass of the A–B system:
GaBr3 is much heavier than BH3 (309.435 g/mol vs. 13.8347 g/mol), so the reduced mass of BH3 will be much lower; leading to absorptions that are much higher in frequency.
Finally, it can be seen that there has been a reordering of vibrational modes. In BH3 the lowest energy mode is the A2” out of plane bend, and in GaBr3 the lowest energy mode comes from the rocking E’ vibrations. The secondary orbital interactions between Br lone pairs and an empty p orbital on Ga could be a reason for this reordering. When the structure of GaBr3 is at the maximum displacement of the A2” vibration, it is not planar, so it loses a lot of the overlap between the empty p orbital on Ga and the Br lone pairs that is present in the equilibrium structure. This is equivalent to the bend having a large force constant. When the molecule adopts the geometry of the maximum displacement of either of the E’ vibrations it is still planar, so it doesn’t lose any π conjugation. This means that the energy difference between equilibrium and maximum displacement is lower for the E’ vibration; giving it a lower force constant. The vibration with the lower force constant appears at a lower frequency. There is no π conjugation possible in BH3 because H has no lone pairs, so the E’ vibration requires more energy because the H atoms come closer together, so it appears at a higher frequency than the A2” vibration.
Answers to Questions
A basis set is a way of describing a molecule using several basis functions. Generally, the larger the basis set the more accurate the representation of the real molecule. During optimisation the lowest energy structure is found by incrementally varying atomic coordinates in a direction that lowers the energy of the system until it converges at a minimum. The energy of the molecule is determined by the basis set that describes the system, so a different equilibrium geometry could be found for each basis set. During the frequency analysis, the second derivative of the potential surface is calculated at the minimum obtained in the optimisation step. If a different basis set is used for the frequency calculation, the new potential surface will have a different shape, so it is likely that the geometry from the optimisation won’t be at a minimum in the new basis set. This makes it likely that the wrong second derivative will be found, most likely corresponding to an unoptimised structure. This will give the wrong frequencies and a meaningless IR spectrum.
The frequency analysis is a way of checking that an energy minimum has been found, because a stationary point could be either a minimum or a maximum. The second derivative of the potential surface will be positive only if the stationary point is a minimum. Therefore, if all the “real” frequencies are positive, an energy minimum has been found. The frequencies also serve to predict the IR spectrum of the molecule and assign each vibration to the vibrational mode that is responsible for it. This kind of analysis can help with assigning IR spectra of real molecules, especially if the molecule has never been characterised properly before.
The Low frequencies in the frequency calculation represent the (-6) in the (3N-6) vibrations that every molecule has. N is the number of atoms in the molecule. Ideally the low frequencies should all be zero, because they represent the movement of the centre of mass of the molecule – this should remain stationary.
BH3 Molecular Orbitals
The molecule that was constrained to D3h geometry was used because this is the shape the molecule adopts in reality, and the D3h geometry is in fact slightly lower in energy than the “almost D3h” generated in the optimisation.
Summary
Filename = E:\3rdyearlab\BH3\MO\D3h_BH3_optimised.chk
- D3hBH3 optimisation2 jk
- File Name = D3h_BH3_optimised
- File Type = .chk
- Calculation Type = FREQ
- Calculation Method = RB3LYP
- Basis Set = 6-31G(D,P)
- Charge = 0
- Spin = Singlet
- Total Energy = -26.61532363 a.u.
- RMS Gradient Norm = 0.00000291 a.u.
- Dipole Moment = 0.0000 Debye
- Point Group = D3H
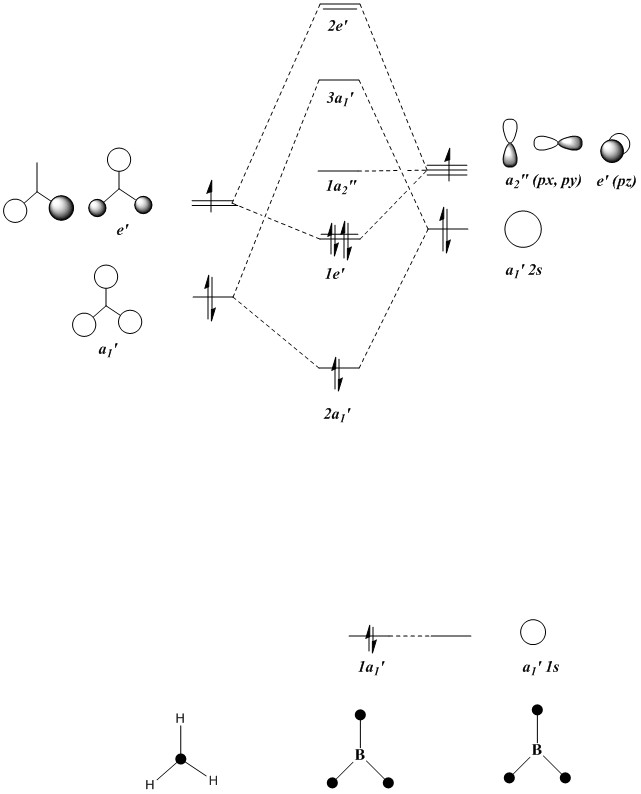
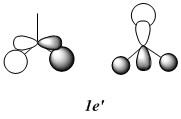
Qualitative MO diagram of BH3
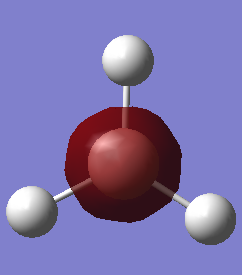
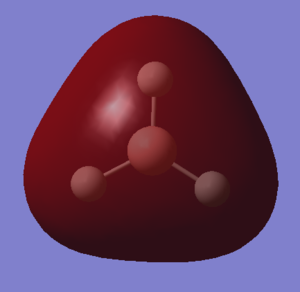
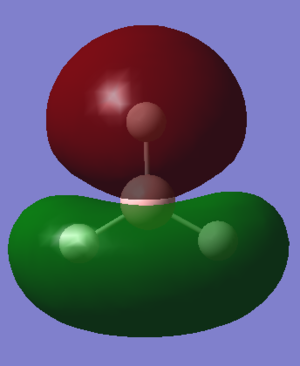
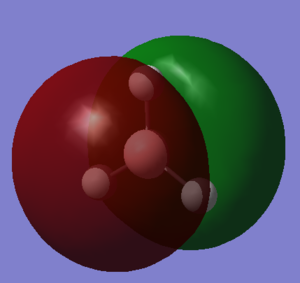
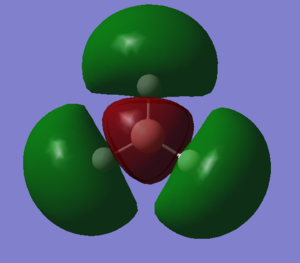
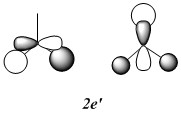
MOs of optimised BH3 after imposing D3h symmetry (.chk) MOs of optimised BH3 after imposing D3h symmetry (.log)
 |
 |
 |
 |
 |
  |
 |
 |
 |
 |
 |
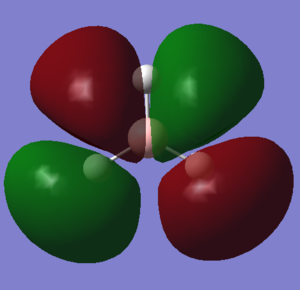 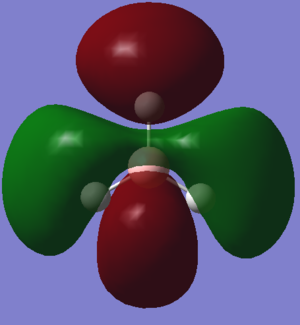 |
The “real” molecular orbitals (MOs) calculated quantum mechanically are compared with the approximate MOs derived from the LCAO approximation above. At first glance many of the “real” orbitals look similar to the approximate ones, for example 1a1’ and 1a2”, but as the orbitals get higher in energy deviations seem to appear. This is most noticeable for the 2e’ set where the shapes look quite different. Upon closer examination however, it can be seen that almost all of the information in the “real” MOs is depicted by the qualitative MOs: the phases are the same, the number and direction of nodes is the same, the symmetries are the same, and the rough direction of the lobes is the same. This means that a lot of the information that can be quantitatively gained from the “real” MOs, such as the way they interact with other orbitals (good and bad overlap directions), bonding/antibonding character, their relative energies, and the effects of populating or depopulating an orbital can be qualitatively gained from the approximate ones. The fact that all this information can be gained very quickly without carrying out any calculations makes qualitative MO theory very useful.
The only significant difference is in the 3a1’ orbital where the relative sizes of the lobes has been reversed in the “real” MO. This would lead to a greater than expected overlap, and therefore a greater than expected interaction between the green phase of the “real” MO, and another MO of the same phase. Another notable difference is that the “real” MOs are much more diffuse than the approximate MOs, especially as they go higher in energy. However this does not have an effect on how they behave qualitatively.
NH3 NBOs
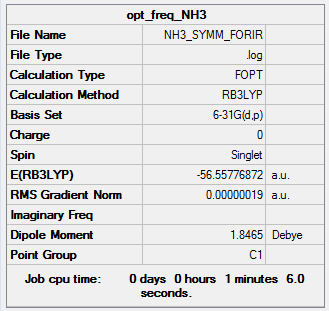
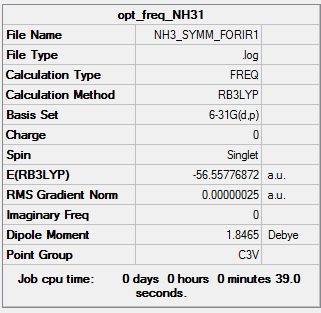
A rough molecule of NH3 was generated, and the geometry was optimised using a 631G-(d,p) basis set.
Summary
Item               Value     Threshold  Converged?
 Maximum Force            0.000000     0.000015     YES
 RMS     Force            0.000000     0.000010     YES
 Maximum Displacement     0.000001     0.000060     YES
 RMS     Displacement     0.000001     0.000040     YES
 Predicted change in Energy=-4.428261D-13
 Optimization completed.
    -- Stationary point found.
                           ----------------------------
                           !   Optimized Parameters   !
                           ! (Angstroms and Degrees)  !
 --------------------------                            --------------------------
 ! Name  Definition              Value          Derivative Info.                !
 --------------------------------------------------------------------------------
 ! R1    R(1,2)                  1.018          -DE/DX =    0.0                 !
 ! R2    R(1,3)                  1.018          -DE/DX =    0.0                 !
 ! R3    R(1,4)                  1.018          -DE/DX =    0.0                 !
 ! A1    A(2,1,3)              105.7445         -DE/DX =    0.0                 !
 ! A2    A(2,1,4)              105.7445         -DE/DX =    0.0                 !
 ! A3    A(3,1,4)              105.7445         -DE/DX =    0.0                 !
 ! D1    D(2,1,4,3)           -111.8635         -DE/DX =    0.0                 !
 --------------------------------------------------------------------------------
 GradGradGradGradGradGradGradGradGradGradGradGradGradGradGradGradGradGrad
All of the values in the Item table have converged, indicating that the optimisation has been successful.
Bond Lengths and Angles
| Optimised NH3, all bond lengths are equal. | |||
|---|---|---|---|
|
All bond lengths are equal at 1.02 Å. And all bond angles are equal at 105.7˚. This is a key characteristic of the C3V point group. The molecule therefore has the correct symmetry to a reasonable accuracy.
Frequencies
The optimised geometry was subjected to frequency analysis to confirm that a minimum has been reached.
Summary
 Low frequencies ---   -8.0229   -6.3248   -3.9605   -0.0013   -0.0010    0.0018
 Low frequencies --- 1089.3435 1693.9233 1693.9278
 Diagonal vibrational polarizability:
        0.1277135       0.1277151       3.3004380
 Harmonic frequencies (cm**-1), IR intensities (KM/Mole), Raman scattering
 activities (A**4/AMU), depolarization ratios for plane and unpolarized
 incident light, reduced masses (AMU), force constants (mDyne/A),
 and normal coordinates:
                      1                      2                      3
                      A                      A                      A
 Frequencies --   1089.3435              1693.9233              1693.9278
 Red. masses --      1.1800                 1.0644                 1.0644
 Frc consts  --      0.8250                 1.7995                 1.7995
 IR Inten    --    145.4303                13.5574                13.5573
  Atom  AN      X      Y      Z        X      Y      Z        X      Y      Z
     1   7     0.00   0.00   0.12     0.01   0.07   0.00    -0.07   0.01   0.00
     2   1     0.00  -0.21  -0.53    -0.07   0.15   0.26     0.76   0.01   0.02
     3   1     0.18   0.11  -0.53     0.38  -0.50  -0.15     0.11  -0.44   0.21
     4   1    -0.18   0.11  -0.53    -0.40  -0.56  -0.11     0.05   0.34  -0.23
                      4                      5                      6
                      A                      A                      A
 Frequencies --   3461.3667              3589.9078              3589.9321
 Red. masses --      1.0272                 1.0883                 1.0883
 Frc consts  --      7.2513                 8.2639                 8.2640
 IR Inten    --      1.0592                 0.2698                 0.2699
  Atom  AN      X      Y      Z        X      Y      Z        X      Y      Z
     1   7     0.00   0.00   0.04     0.01   0.08   0.00     0.08  -0.01   0.00
     2   1     0.00   0.55  -0.18     0.00  -0.75   0.31     0.02   0.08  -0.03
     3   1    -0.47  -0.27  -0.18    -0.40  -0.21  -0.18    -0.52  -0.31  -0.25
     4   1     0.47  -0.27  -0.18     0.27  -0.13  -0.12    -0.59   0.35   0.28
Frequencies for optimised NH3.
All Frequencies are positive, indicating that an energy minimum has been reached.
NBOs
The NBOs and charge distribution was calculated from the optimised energy minimum.
| NH3charge distribution (red is negative) | 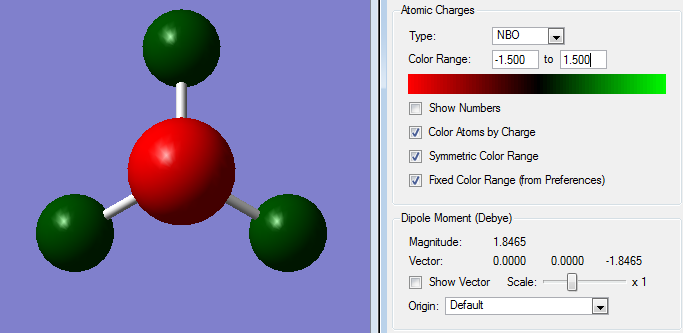
|
|---|
| NH3 atomic charges | 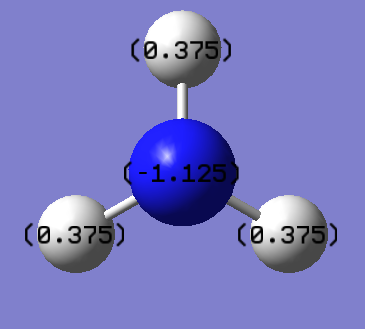
|
|---|
Charge Distribution of optimised NH3.
Association Energy of BH3NH3
BH3NH3
In order to get an accurate energy value, the same basis set and method must be used for calculating the energy of each molecule. The energy calculation of BH3 therefore had to be repeated.
BH3 optimisation ultrafine Summary
 Item               Value     Threshold  Converged?
 Maximum Force            0.000009     0.000015     YES
 RMS     Force            0.000007     0.000010     YES
 Maximum Displacement     0.000052     0.000060     YES
 RMS     Displacement     0.000034     0.000040     YES
 Predicted change in Energy=-7.705185D-10
 Optimization completed.
    -- Stationary point found.
                           ----------------------------
                           !   Optimized Parameters   !
                           ! (Angstroms and Degrees)  !
 --------------------------                            --------------------------
 ! Name  Definition              Value          Derivative Info.                !
 --------------------------------------------------------------------------------
 ! R1    R(1,2)                  1.1923         -DE/DX =    0.0                 !
 ! R2    R(1,3)                  1.1923         -DE/DX =    0.0                 !
 ! R3    R(1,4)                  1.1923         -DE/DX =    0.0                 !
 ! A1    A(2,1,3)              120.0007         -DE/DX =    0.0                 !
 ! A2    A(2,1,4)              120.0054         -DE/DX =    0.0                 !
 ! A3    A(3,1,4)              119.9939         -DE/DX =    0.0                 !
 ! D1    D(2,1,4,3)            180.0            -DE/DX =    0.0                 !
 --------------------------------------------------------------------------------
 GradGradGradGradGradGradGradGradGradGradGradGradGradGradGradGradGradGrad
BH3 Optimisation using ultrafine method BH3 Optimisation using ultrafine method.
Frequency analysis was undertaken to check that the geometry for BH3 is a minimum.
Summary
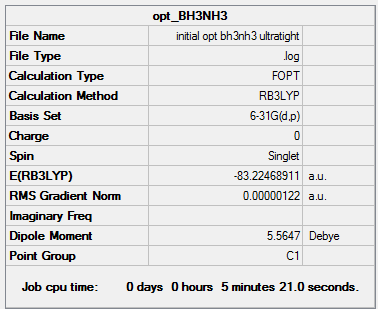
Low frequencies ---  -15.6084  -12.4386   -3.7690   -0.0004    0.0004    0.0006
 Low frequencies --- 1162.9774 1213.1423 1213.1596
All the low frequencies are reasonably low, and the energy is almost the same as the energy obtained from the same basis set but without using the ultrafine method, which suggests that the energy from this file is good enough to use to work out the bond dissociation energy. All the "real" frequencies are positive, and since the absolute values are not of interest here it doesn't matter that one low frequency value is above 15 cm-1.
NH3BH3
A rough geometry was generated, and optimised using the same basis set as for NH3 and BH3.
Summary
 Item               Value     Threshold  Converged?
 Maximum Force            0.000002     0.000015     YES
 RMS     Force            0.000001     0.000010     YES
 Maximum Displacement     0.000024     0.000060     YES
 RMS     Displacement     0.000010     0.000040     YES
 Predicted change in Energy=-8.754451D-11
 Optimization completed.
    -- Stationary point found.
                           ----------------------------
                           !   Optimized Parameters   !
                           ! (Angstroms and Degrees)  !
 --------------------------                            --------------------------
 ! Name  Definition              Value          Derivative Info.                !
 --------------------------------------------------------------------------------
 ! R1    R(1,7)                  1.0185         -DE/DX =    0.0                 !
 ! R2    R(2,7)                  1.0185         -DE/DX =    0.0                 !
 ! R3    R(3,7)                  1.0185         -DE/DX =    0.0                 !
 ! R4    R(4,8)                  1.2098         -DE/DX =    0.0                 !
 ! R5    R(5,8)                  1.2098         -DE/DX =    0.0                 !
 ! R6    R(6,8)                  1.2098         -DE/DX =    0.0                 !
 ! R7    R(7,8)                  1.6677         -DE/DX =    0.0                 !
 ! A1    A(1,7,2)              107.8749         -DE/DX =    0.0                 !
 ! A2    A(1,7,3)              107.8749         -DE/DX =    0.0                 !
 ! A3    A(1,7,8)              111.0239         -DE/DX =    0.0                 !
 ! A4    A(2,7,3)              107.8748         -DE/DX =    0.0                 !
 ! A5    A(2,7,8)              111.024          -DE/DX =    0.0                 !
 ! A6    A(3,7,8)              111.0239         -DE/DX =    0.0                 !
 ! A7    A(4,8,5)              113.874          -DE/DX =    0.0                 !
 ! A8    A(4,8,6)              113.874          -DE/DX =    0.0                 !
 ! A9    A(4,8,7)              104.5971         -DE/DX =    0.0                 !
 ! A10   A(5,8,6)              113.874          -DE/DX =    0.0                 !
 ! A11   A(5,8,7)              104.5973         -DE/DX =    0.0                 !
 ! A12   A(6,8,7)              104.5973         -DE/DX =    0.0                 !
 ! D1    D(1,7,8,4)            179.9999         -DE/DX =    0.0                 !
 ! D2    D(1,7,8,5)            -60.0002         -DE/DX =    0.0                 !
 ! D3    D(1,7,8,6)             59.9999         -DE/DX =    0.0                 !
 ! D4    D(2,7,8,4)            -60.0001         -DE/DX =    0.0                 !
 ! D5    D(2,7,8,5)             59.9999         -DE/DX =    0.0                 !
 ! D6    D(2,7,8,6)            180.0            -DE/DX =    0.0                 !
 ! D7    D(3,7,8,4)             59.9998         -DE/DX =    0.0                 !
 ! D8    D(3,7,8,5)            179.9998         -DE/DX =    0.0                 !
 ! D9    D(3,7,8,6)            -60.0001         -DE/DX =    0.0                 !
 --------------------------------------------------------------------------------
 GradGradGradGradGradGradGradGradGradGradGradGradGradGradGradGradGradGrad
BH3NH3 Optimisation using ultratight method
All values have converged so a stationary point has been found.
Frequency check for BH3NH3
Summary
 Low frequencies ---   -3.3467   -2.7923   -0.0010   -0.0008    0.0007    3.7171
 Low frequencies ---  263.3383  632.9625  638.4393
All low frequencies are low, all "real" frequencies are positive, so an energy minimum has been reached.
| Optimised NH3BH3 Structure | |||
|---|---|---|---|
|
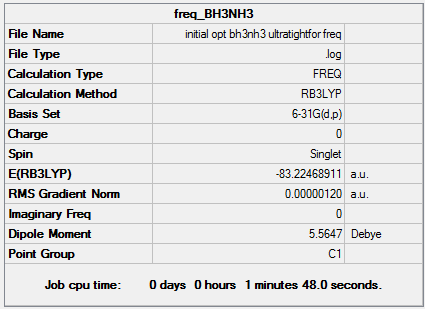
The ultrafine method wasused previously for NH3, so the energy can be taken directly from that calculation.
- E(NH3)= -56.55776872 a.u.
- E(BH3)= -26.61532364 a.u.
- E(NH3BH3)= -83.22468911 a.u.
Association energy = -0.05159675 a.u
Association energy = -135.47 kJmol-1
This is a fairly weak bond, since NH3 is quite stable without forming an adduct. It is slightly weaker than an O-O single bond (146 kJmol-1), but it is in the same order of magnitude, so it is a reasonable figure.
Investigating Aromaticity
A series of 6 membered, cyclic compounds that obey the (4n+2) rule is investigated. Each structure is optimised using a 631G-(d,p) basis set. The molecular orbitals are calculated and the key similarities and differences of these orbitals, and the energies of the molecules are compared.
Benzene
Benzene is used as a reference point for all the other aromatic species studied, so the MOs of benzene were computed first.
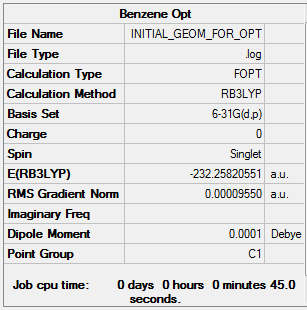
Benzene was generated in a rough geometry, and subjected to geometry optimisation using a 631G-(d,p) basis set.
Summary
This structure does not have the required D6h point group, so would give the wrong MOs. D6h symmetry is imposed and the structure is subjected to further optimisation.
Summary
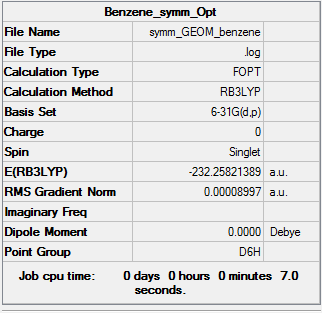
It can be seen from the energies of the optimised structures that the one with D6h geometry is lower in energy, so it should be a more accurate representation of the real structure.
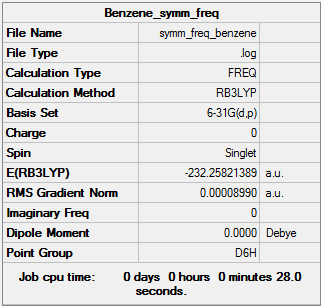
The D6h structure is subjected to frequency analysis.
Summary
Low frequencies ---   -2.5530   -2.5530   -0.0089   -0.0042   -0.0041   10.3930
 Low frequencies ---  413.9723  413.9723  621.1358
All low frequencies are low, and all "real" frequencies are positive, so an energy minimum has been found.
| Optimised Structure of Benzene (D6h) | |||
|---|---|---|---|
|
Results
- C-C bond length = 1.40 Å
- C-H bond length = 1.09 Å
- Energy(631G-(d,p)) = -232.25821389 a.u.
MO Calculation Benzene
The MOs were calculated from the optimised D6h structure of Benzene.
Summary
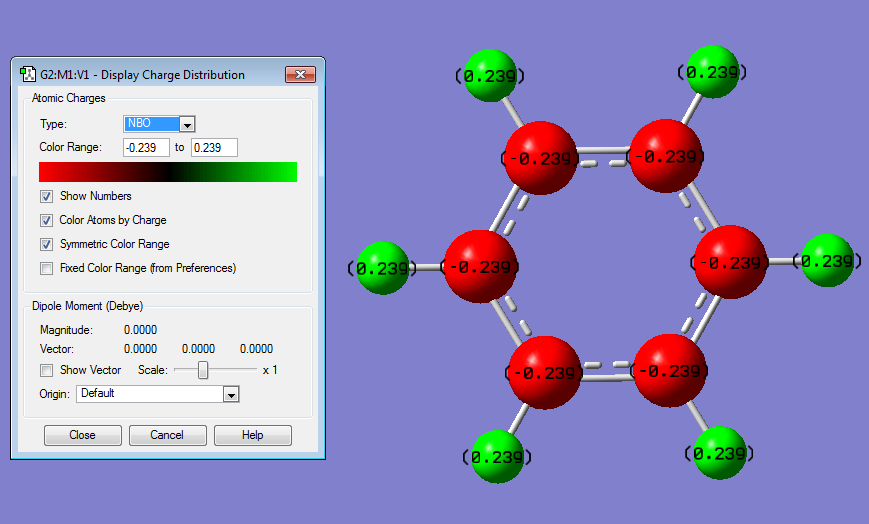
Charge Distribution
C is more electronegative than H, so the partial charge on C is negative.
MO Diagram for Benzene
| Central Section of the MO diagram of Benzene |
|---|
| File:Huge MO diagram.pdf |
The diagram is arranged in two columns, 3e2g is above 1a2u. The computed MOs are shown side by side with their LCAO approximations.
Most of the LCAO approximations describe the "real" MOs quite accurately, albeit in a qualitative way. There are however some exceptions towards the top of the MO diagram. The most notable of these is the 3e2g set, in which the p orbitals overlap in a way that isn't obvious from the LCAO diagram, resulting in an unusual shape in the MO.
The definition of aromaticity is complex. On a basic level, 2D aromaticity involves the cyclic delocalisation of electrons in a planar system. Hückel's rule states that the number of delocalised π electrons must be equal to (4n + 2) where n is an integer value. Aromaticity also grants the molecule certain physical properties, such as equal bond lengths and unusual stability compared to acyclic analogues. Furthermore, the cyclic delocalisation of electrons causes a diamagnetic ring current which isn't present in acyclic isomers. An important extension of Hückel's rule is that all bonding MOs in the molecule are fully occupied, and all antibonding orbitals are empty.
The MO diagram of benzene makes it possible to visualise some of the important aspects of aromaticity. For example, the 1a2u orbital illustrates perfectly the cyclic π delocalisation present in the molecule. The electrons in that orbital are completely delocalised above and below the plane of the molecule. There are three occupied π MOs in benzene, and since their wavefunctions all overlap there is no reason why electrons can't travel between the three orbitals provided they have the correct spin. The MO diagram also illustrates how benzene conforms to Hückel's rule: each MO formally contains 2 electrons, and there are three π MOs, making 6π electrons overall. Therefore n=1, and the molecule is aromatic.
Another feature of aromaticity that the MO diagram illustrates is the orbital occupation criteria: all of the bonding orbitals are fully occupied (up to and including the 3e1g set), and all antibonding orbitals are empty (1e2u onwards). All bonding orbitals have negative orbital energy values and all antibonding orbitals have positive energy values. Because all bonding orbitals are filled and all antibionding orbitals are empty the molecule is electronically as stable as is possible.
In addition to the π orbitals, some σ orbitals also display delocalisation. 2a1g for example is delocalised over the entire molecule, and even several higher energy σ orbitals display considerable delocalisation, such as 3a1g and 3e1u. It is possible that these σ MOs can overlap with the π MOs and increase the delocalisation of the molecule. This would explain why all the C-C bond lengths are identical despite the fact that not all of the MOs are contribute exactly the same amount of electron density to every C-C bond.
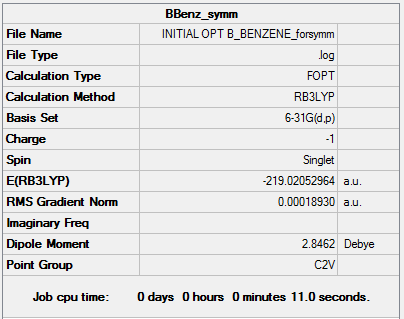
Boratabenzene
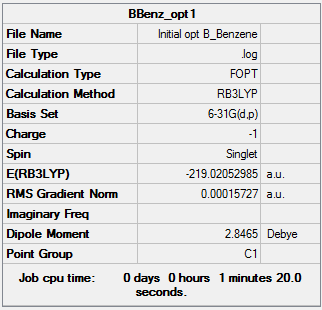
Boratabenzene was drawn in a rough geometry and then subjected to geometry optimisation using a 631G-(d,p) basis set.
Summary
This structure does not have the desired C2v point group, so it is symmetrised and subjected to further optimisation using the same basis set. This time the molecule has the correct point group.
| Optimised Structure of Boratabenzene (C2v) | |||
|---|---|---|---|
|
It can be seen from the energies in the item tables that the structure of boratabenzene with C2v symmetry is slightly higher in energy than the unsymmetrised structure. This indicates that the symmetrised structure is not fully optimised, and a better basis set or a tighter convergence criteria would be needed to make the C2v molecule lower in energy.
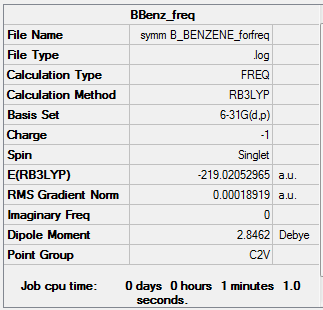
To check that an energy minimum has been found the optimised C2v structure of boratabenzene was subjected to frequency analysis using the 631G-(d,p) basis set.
Summary
Full mass-weighted force constant matrix:
 Low frequencies ---  -13.1280   -0.0011   -0.0010   -0.0009   15.5233   18.3505
 Low frequencies ---  371.3341  404.2351  565.2516
All the low frequencies are reasonably low, and all the "real" frequencies are positive. This indicates that an energy minimum has been found.
Results
- C-C bond length(adjacent to B) = 1.40 Å
- C-C bond length(opposite to B) = 1.41 Å
- C-H bond length(opposite to B) = 1.09 Å
- C-H bond length(all others) = 1.10 Å
- B-H bond length = 1.22 Å
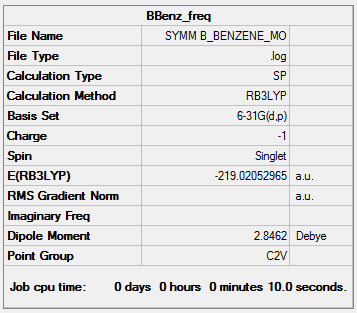
- Energy(631G-(d,p)) = -219.02052965 a.u.
The MOs and charge distribution were calculated from the optimised boratobenzene structure.
Summary
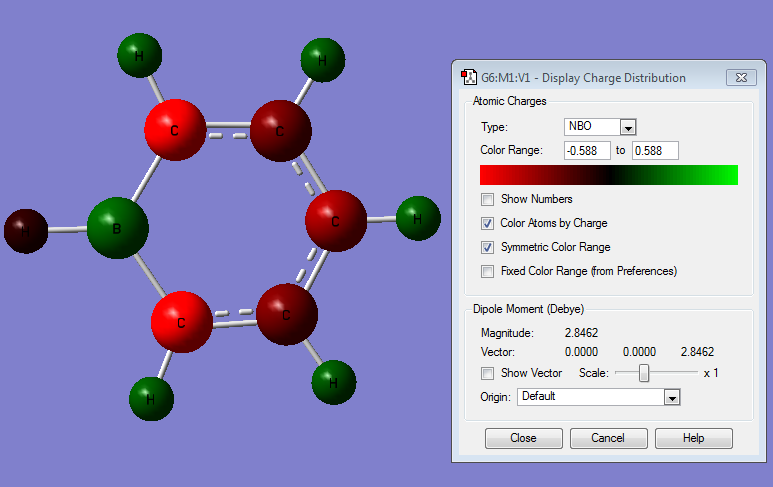
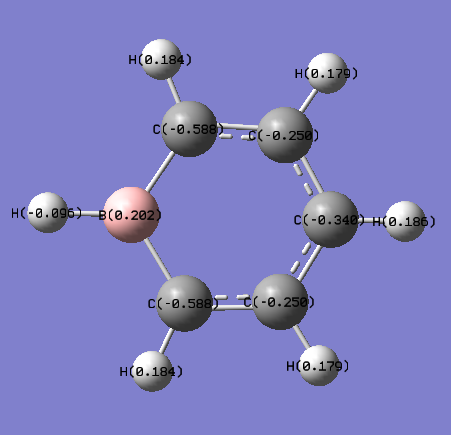
Charge Distribution
| NBO Charge Distribution of Boratobenzene |
|---|
|
|
Pyridinium
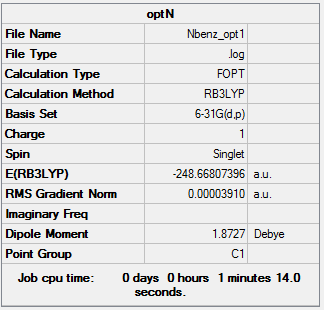
As for boratabenzene, the pyridinium ion was generated in a rough geometry, optimised using a 631G-(d,p) basis set, symmetrised to C2v, and re-optimised.
Initial Optimisation Summary
C2v symmetry is now imposed and the structure is optimised again.
Summary
Once again the molecule with C2v symmetry is slightly higher in energy than the unsymmetrised molecule. A better basis set with a tighter convergence criteria would optimise the molecule to a more accurate minimum, with the expected C2v symmetry.
Frequency Analysis was carried out on the molecule with C2v symmetry to check whether it is an energy minimum.
Summary
Low frequencies ---   -7.2801   -0.0008    0.0004    0.0006   17.3641   18.5605
 Low frequencies ---  392.5055  404.0587  620.4783
All low frequencies are reasonably low; a more accurate basis set with a tighter convergence criteria would give lower low frequencies, but for the qualitative comparison of MOs, this geometry is sufficiently accurate. All "real" frequencies are positive, indicating that an energy minimum has been reached.
| Optimised Structure of Pyridinium | |||
|---|---|---|---|
|
Results
- C-N bond length = 1.35 Å
- N-H bond length = 1.02 Å
- C-C bond length (adjacent to N) = 1.38 Å
- C-C bond length (opposite N) = 1.40 Å
- C-H bond length (opposite N) = 1.09 Å
- C-H bond length (all others) = 1.08 Å
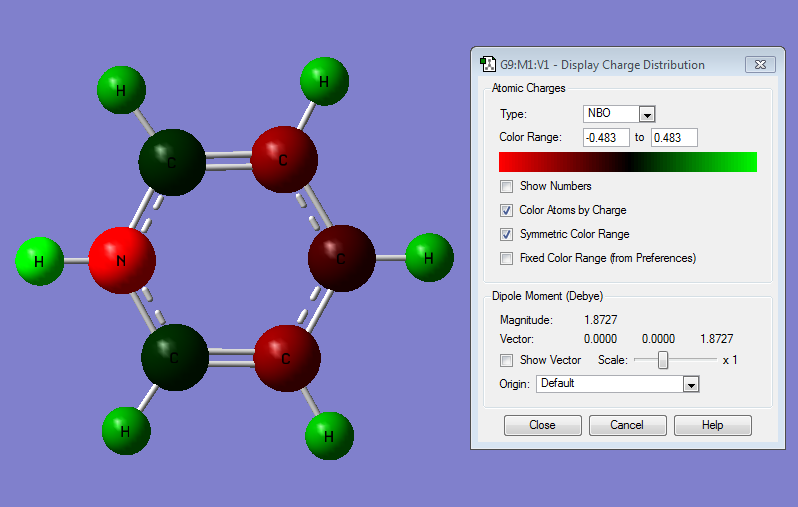
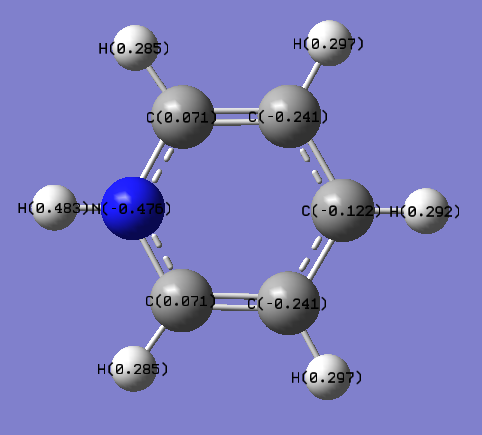
Charge Distribution
| NBO Charge Distribution of Pyridinium |
|---|
|
|
Borazine
Borazine was created in a rough geometry and the first optimisation was carried out.
Summary
The point group of this structure is not D3h, so the D3h symmetry is assigned, and a second optimisation is carried out.
Summary
As for the other heteroaromatic molecules, the molecule with the "real" symmetry is higher in energy than the one with lower symmetry, but the "real" higher symmetry structure will be used for calculating MOs.
The D3h structure is subjected to frequency analysis to confirm that it is an energy minimum.
Summary
 Low frequencies ---  -12.1146  -11.8808   -8.1025   -0.0097    0.0464    0.0700
 Low frequencies ---  289.1792  289.1896  403.7656
All the low frequencies are low, and all the "real" frequencies are positive. This confirms that the structure is sufficiently optimised and that an energy minimum has been found.
Results
- N-H bond length = 1.01 Å
- B-H bond length = 1.19 Å
- B-N bond length = 1.43 Å
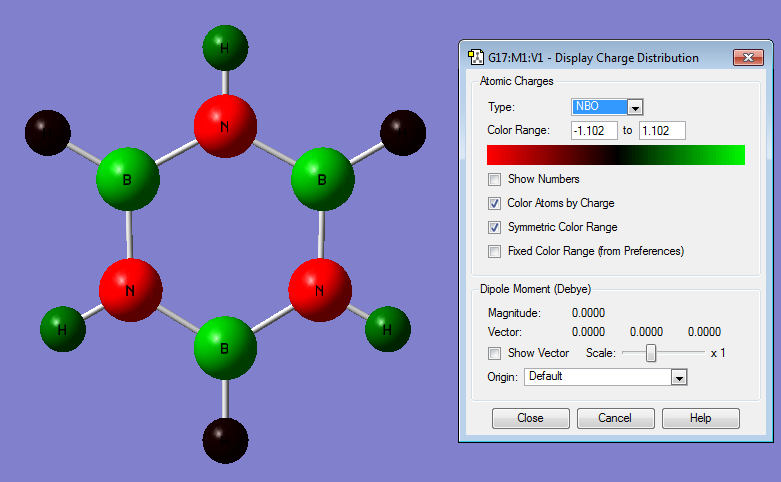
Charge Distribution
| NBO Charge Distribution of Borazine |
|---|
|

|
Discussion
Charge Distribution
Charge Distributions
|
Charge Distributions | ||||
|
Atom no. |
Benzene |
Boratabenzene |
Pyridinium |
Borazine |
|
|
Relative Charge |
Relative Charge |
Relative Charge |
Relative Charge |
|
1
|
C - 0.239 |
B + 0.202 |
N - 0.476 |
N - 1.102 |
|
2
|
C - 0.239 |
C - 0.586 |
C + 0.071 |
B + 0.747 |
|
3
|
C - 0.239 |
C - 0.520 |
C - 0.241 |
N - 1.102 |
|
4
|
C - 0.239 |
C - 0.340 |
C - 0.122 |
B + 0.747 |
|
5
|
C - 0.239 |
C - 0.520 |
C - 0.241 |
N - 1.102 |
|
6
|
C - 0.239 |
C - 0.586 |
C + 0.071 |
B + 0.747 |
|
7
|
H + 0.239 |
H - 0.096 |
H + 0.483 |
H + 0.432 |
|
8
|
H + 0.239 |
H + 0.184 |
H + 0.285 |
H - 0.077 |
|
9
|
H + 0.239 |
H + 0.179 |
H + 0.297 |
H + 0.432 |
|
10
|
H + 0.239 |
H + 0.186 |
H + 0.292 |
H - 0.077 |
|
11
|
H + 0.239 |
H + 0.179 |
H + 0.297 |
H + 0.432 |
|
12
|
H + 0.239 |
H + 0.184 |
H + 0.285 |
H - 0.077 |
Table 3: Comparison of Charge Distributions across the four Aromatic molecules. Atoms 1 to 6 are the p block elements that make up the ring, numbered clockwise starting from the heteroatom (or N in borazine). Atoms 7 to 12 are the Hs numbered clockwise starting from the H attached to atom 1.
Benzene
In benzene the charge distribution is very uniform. The more electronegative C atoms are slightly negatively polarised, and the less electronegative H atoms become positively polarised. All of the Cs have exactly the same charge, which is a result of the uniform C AO contribution to the MOs. For example for the bond between C4 and C5:
 BD*( 1) C   4 - C   5

                ( 50.00%)   0.7071* C   4 s( 35.20%)p 1.84( 64.76%)d 0.00(  0.04%)

                                           -0.0001  0.5932 -0.0079  0.0006 -0.7063

                                           -0.0300  0.3840 -0.0193  0.0000  0.0000

                                           -0.0151  0.0000  0.0000  0.0069 -0.0109

                ( 50.00%)  -0.7071* C   5 s( 35.20%)p 1.84( 64.76%)d 0.00(  0.04%)

                                           -0.0001  0.5932 -0.0079  0.0006  0.6857

                                           -0.0017 -0.4197 -0.0357  0.0000  0.0000

                                           -0.0135  0.0000  0.0000  0.0096 -0.0109
This is true for all C-C bonds. All the C-H bonds are predominantly H 1s AO based, for example the bond between C3 and H9:
(0.01225) BD*( 1) C   3 - H   9

                ( 37.96%)   0.6161* C   3 s( 29.58%)p 2.38( 70.39%)d 0.00(  0.04%)

                                            0.0003 -0.5437 -0.0126  0.0010 -0.7265

                                            0.0126  0.4194 -0.0073  0.0000  0.0000

                                            0.0144  0.0000  0.0000 -0.0083  0.0105

                ( 62.04%)  -0.7876* H   9 s( 99.95%)p 0.00(  0.05%)

                                           -0.9997 -0.0014  0.0197 -0.0114  0.0000
However, the more electronegative C pulls the majority of the electron density towards itself, leaving the H slightly positive.
Boratabenzene
In boratabenzene the charge distribution is much more irregular, with the greater contribution to the bonding coming from the more electronegative C atoms, and not so much the electropositive B:
(1.96995) BD ( 1) C   3 - B  12

                ( 66.70%)   0.8167* C   3 s( 42.04%)p 1.38( 57.95%)d 0.00(  0.01%)

                                            0.0000 -0.6482 -0.0158 -0.0012  0.0000

                                            0.0000  0.6116 -0.0293  0.4523  0.0090

                                            0.0000  0.0000 -0.0059  0.0070  0.0007

                ( 33.30%)   0.5771* B  12 s( 33.40%)p 1.99( 66.52%)d 0.00(  0.08%)

                                            0.0000 -0.5779  0.0059 -0.0048  0.0000

                                            0.0000 -0.7056 -0.0393 -0.4070  0.0096

                                            0.0000  0.0000 -0.0230  0.0156  0.0005
The electropositive B has the strongest effect on the C atoms that it is directly bonded to: these are the most negatively polarised because the electron density of the B-C bonds is shared the least evenly, with the more electronegative Cs having the majority. It is therefore likely that it would be these C atoms that are attacked by electrophiles in electrophilic aromatic substitution reactions.
Similarly to benzene, the H atoms attached to the Cs are positively charged in boratabenzene, but to a lesser extent. This is due to the electropositive B atom destabilising the σ MOs relative to benzene, making the boratabenzene ring withdraw less electron density from the Hs. This is most apparent in the H that is attached directly to the B; the H orbitals are lower in energy than the B orbitals so the majority of the electron density in the B-H bond ends up closer to the H.
Pyridinium
Pyridinium displays a reversal of the effects described for boratabenzene. The heteroatom is electronegative, so electrons are most stable near the N. This effect is so strong that the normally slightly negatively charged C atoms closest to the N become slightly positive. This is illustrated by the orbital contributions:
(1.98861) BD ( 1) C   3 - N  12

               <pre> ( 36.68%)   0.6057* C   3 s( 28.13%)p 2.55( 71.74%)d 0.00(  0.13%)

                                           -0.0001  0.5294 -0.0335 -0.0013  0.0000

                                            0.0000 -0.7417 -0.0277  0.4042  0.0563

                                            0.0000  0.0000 -0.0252 -0.0247 -0.0070

                ( 63.32%)   0.7957* N  12 s( 36.56%)p 1.73( 63.41%)d 0.00(  0.03%)

                                           -0.0001  0.6047 -0.0037  0.0006  0.0000

                                            0.0000  0.7069  0.0132 -0.3659  0.0187

                                            0.0000  0.0000 -0.0107 -0.0129
It can be seen that in bonding orbitals the majority of the orbital contribution comes from the more electronegative N atom. This gives rise to the observed polarisation. 0.0007 The other C atoms are charged almost identically to benzene. As with boratabenzene, the charge distribution across the molecule is less regular than in benzene due to the less symmetric shape of the molecule.
The electronegative N lowers the energy of the σ MOs of the ring, which withdraws electron density away from the H atoms more strongly than in benzene, making them significantly more positive. This effect is strongest on the H that is bonded directly to the N – making it quite strongly positively charged.
In electrophilic aromatic substitution reactions the electropile is likely to attack at one of the Cs that are meta to the N because these are most electron rich.
Borazine
Borazine displays all the effects described for the previous systems: it is quite highly symmetric so the charge distribution is also symmetric throughout the molecule. The N atoms are more electronegative so their orbitals are lower in energy – this pulls electron density away from both the B and the H atoms that are bonded to N. The orbital contributions can be seen from the log file:
(1.82090) BD ( 2) N   7 - B  10

                ( 88.21%)   0.9392* N   7 s(  0.00%)p 1.00(100.00%)d 0.00(  0.00%)

                                            0.0000  0.0000  0.0000  0.0000  0.0000

                                            0.0000  0.0000  0.0000  1.0000 -0.0003

                                            0.0000 -0.0005 -0.0046  0.0000  0.0000

                ( 11.79%)   0.3433* B  10 s(  0.00%)p 1.00( 99.62%)d 0.00(  0.38%)

                                            0.0000  0.0000  0.0000  0.0000  0.0000

                                            0.0000  0.0000  0.0000  0.9976 -0.0315

                                            0.0000  0.0573  0.0220  0.0000  0.0000
There is a greater electronegativity difference between B and N than either B and C or C and N. This means that the bonds are more polar in borazine than any of the other aromatic systems studied. The H atoms attached to B and N in borazine are polarised similarly to the H atoms attached to B and N in boratabenzene and pyridinium.
The strongly polar bonds in borazine suggest that it will be more reactive with both electrophiles and nucleophiles than any of the other systems. Nucleophiles will attack at the more positive B atoms, and electrophiles at the more negative N atoms.
Bond Lengths
Benzene
- C-C = 1.40 A
Boratabenzene
- B-C = 1.22 A
- C-C = 1.40 – 1.41 A
Pyridinium
- N-C = 1.35 A
- C-C = 1.38 – 1.40 A
Borazine
- B-N = 1.43 A
The trend in bond lengths can be explained by considering the extent of aromaticity in the molecule, and bond polarity. Benzene has maximum aromaticity, but bonds that are not at all polar. This gives a fairly short C-C bond length of 1.40 A. in boratabenzene the C-B bonds are highly polarised. This adds an additional ionic component to the bond, strengthening it and making it shorter. The C-C bond is almost the same length as in benzene, which shows that despite the added ionic component, the bonds are not stronger. This means that the aromaticity in boratabenzene is slightly weaker than in benzene. In Pyridinium the C-N bond length is also shorter than the C-C bond length in benzene due to the ionic component of the bond. This ionic character is strong in the rest of the molecule even among the Cs, so the average C-C bond length is shorter in pyridinium than in benzene. Finally, borazine has the most polar bonds, so they should be the shortest. However, the aromatic component in borazine is weak because most of the electron density is localised on the electronegative N atoms, so the B-N bond becomes the longest.
MO Comparison
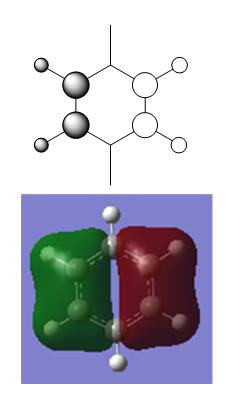
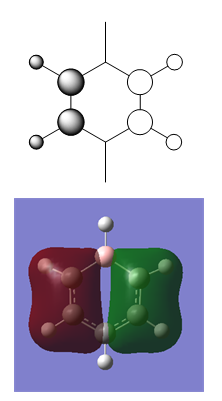
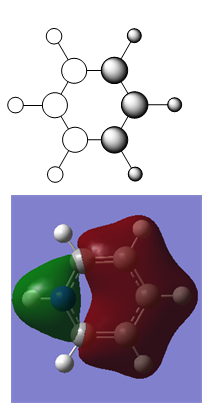
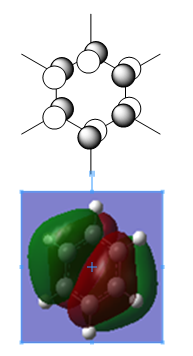
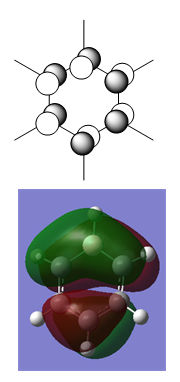
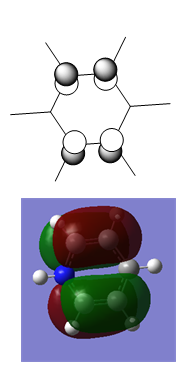
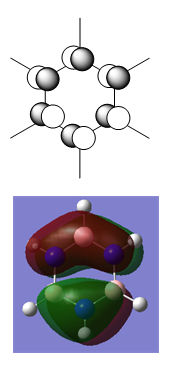
Table 4:Comparison of Molecular Orbitals Across the four Aromatic Molecules
Overall MO Energies
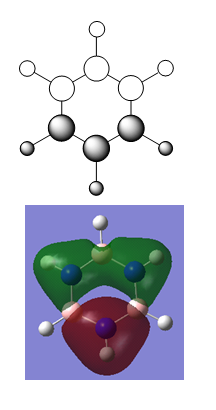
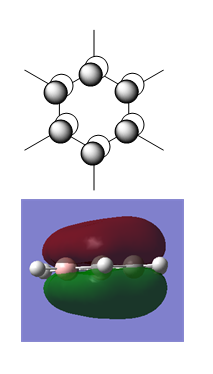
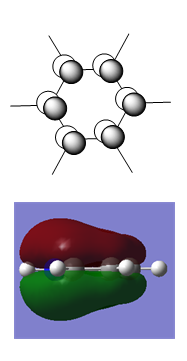
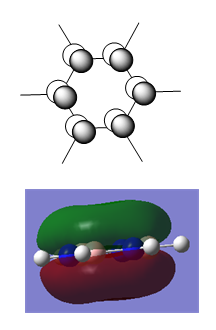
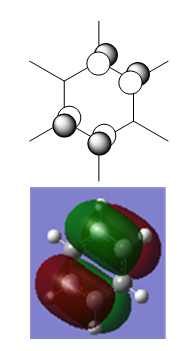
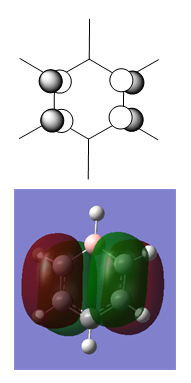
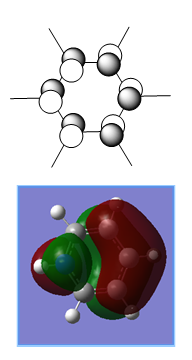
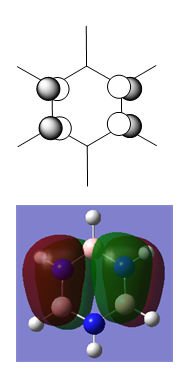
All of the orbitals shown in the above table are occupied, with orbital 21 being the HOMO in each molecule. In benzene all of the occupied orbitals are bonding; as shown by the negative energy values, and orbital energies range from -0.74005 to -0.24691 a.u. The overall energy range of the orbitals shown for boratabenzene is higher than for benzene due to the presence of an electropositive B atom. Because B is less electronegative than C, the electrons in B AOs are held less strongly than in C AOs, which makes them higher in energy. This in turn destabilises the MOs that the B AOs contribute to. The destabilising influence of the B atom is so great that the HOMO in borazine becomes antibonding. In the pyridinium ion the presence of an electronegative N atom has the opposite effect. The N AOs are lower in energy than C AOs, which means the electrons are held more tightly in the MOs that the N AOs contribute to. This lowers the energy of the MOs and makes them more strongly bonding. The ring in borazine is made up of equal numbers of B and N atoms. When averaged out the electronegativity on N and B is almost exactly the same as for C, which explains why borazine has MO energies closest to benzene. However although the MO energies are similar, all of the borazine orbitals shown are slightly lower in energy than the corresponding MO in benzene. This is because the more electronegative N atoms contribute more to the bonding orbitals, and the B AOs contribute more to the antibonding orbitals. This is most easily illustrated by examining the orbital contributions for MO 17. This MO is formed mostly form 2pz AOs. The molecular orbital coefficient for each N 2pz = 0.27556 and the coefficient for each B 2pz = 0.15866. This is a significant difference which leads to the bonding MO being formed from mainly N AOs. The same is true for MO 20: this MO is also formed predominantly from 2pz AOs. The magnitude of the molecular orbital coefficient for the two contributing N 2pz AOs = 0.39706, and for B 2pz = 0.14940 all the other bonding MOs shown. The log file confirms that this is the case for all of the bonding orbitals in borazine. In benzene all of the atoms are C, so there is no way of having a more electronegative atom contribute more to the bonding MOs. The orbital contribution from each C 2pz AO is identical. The bonding orbitals in borazine are therefore more “N-like”, so they are lower in energy than the bonding orbitals in benzene. The antibonding orbitals in borazine are therefore more “B-like”, making them more antibonding than benzene antibonding orbitals. Degeneracy
Benzene and Borazine
Both benzene and borazine are highly symmetric: benzene is D6h and borazine is D3h. This gives rise to several degenerate sets of orbitals. Molecular orbitals are degenerate when they are of equal energy. This happens when both MOs are formed from an identical mixture of AOs contributing in identical proportions. In both benzene and borazine orbitals 20 and 21 are degenerate. This is because each pair has identical orbital contributions overall. Both orbitals are formed almost exclusively of C 2pz and 3pz AOs, with minor contributions from 3dxz orbitals. Due to the symmetry of the molecule, the AOs mix in a way that results in degenerate energy of the two orbitals. In borazine orbitals 21 and 22 are formed almost exclusively of N and B 2pz and 3pz orbitals, with minor contributions from 3dxz orbitals. As for benzene, due to the symmetry of the molecule, both orbitals have identical contributions from N and B AOs. It therefore doesn’t matter that the AOs are not degenerate because they mix in a way that cancels this energy out.
Boratabenzene and Pyridinium
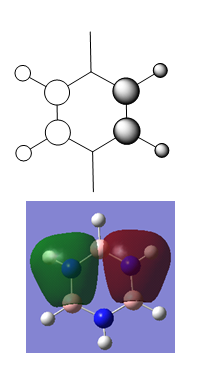
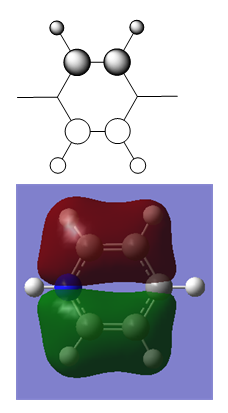
Unlike Benzene and borazine, boratabenzene and pyridinium only have one C2 axis, which makes them less symmetric (C group not D group). This results in non-identical AO contributions to MOs 20 and 21. In boratabenzene it can be seen just from the shape of the MOs that there is some contribution from B AOs to orbital 21, but in orbital 20 there is a node “above” and “below” B which shows that there is no contribution from B to this MO. This means that there are no longer identical AO contributions to MOs 20 and 21, which makes them non-degenerate. B is electropositive relative to C, so its AOs will be higher in energy; therefore when they contribute to a MO, this MO will be higher in energy than an identical MO with C instead of B (orbital 20). The destabilisation due to B is so great that an ordinarily bonding orbital becomes antibonding. The reverse effect occurs in pyridinium: N is more electronegative than C, so the orbital with a contribution from N AOs is lower in energy than the one with just C AOs. This results in the order of the a2 and b1 orbitals reversing in pyridinium compared to boratabenzene, and the b1orbital becoming strongly bonding.
σ MOs
Exactly the same energy arguments apply to the σ MOs 8 and 9 as for the π MOs 20 and 21. In benzene and borazine the symmetry means that 8 and 9 are degenerate because they have identical AO contributions. In boratabenzene and pyridinium the lower symmetry means that AO contributions are not identical, degeneracy is lost, and the orbital energies for boratabenzene and pyridinium are reversed.
General ordering of selected MOs
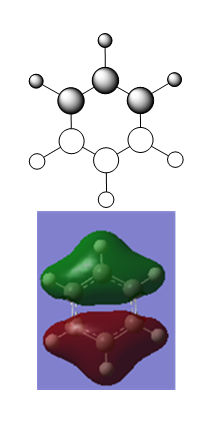
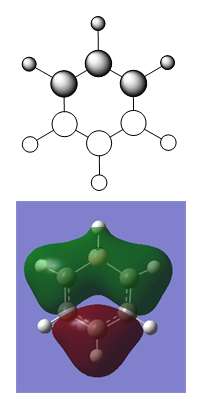
In all four aromatic molecules the general ordering of orbital energies is the same. The σ MOs are lowest in energy because they have the best overlap; the stronger the overlap the stronger the bonding (and antibonding) interactions. Orbital 17 comes next because it is fully bonding with just one low energy nodal plane that passes through the centres of nuclei. The bonding interaction comes from p orbitals wit π overlap. π overlap is weaker than σ overlap, so gives rise to a weaker interaction and hence a less strongly bonding orbital. Finally, orbitals 20 and 21 are the two highest occupied MOs, each has one low energy nodal plane that passes through the centres of nuclei, and one high energy nodal plane between atoms which corresponds to an antibonding interaction. The bonding interaction is so weak in boratabenzene that it is outweighed by the antibonding interaction, and the orbital becomes antibonding. The main effect of substituting a heteroatom into the benzene molecule has on the MO diagram is that it breaks the degeneracy of the HOMO. This will have a profound effect on the reactivity of the molecule. For example it is likely that boratabenzene will be a better π donor in transition metal complexes than pyridinium. An interesting feature of the fully bonding π MO is how strongly the orbital contribution changes across the four molecules. In benzene the orbital has an equal contribution from each C-giving rise to two discs in which the electron density is spread evenly above all six Cs with a slight dip in the middle of the circle. In boratabenzene there is a dip above and below the B, which shows that the majority of the electron density is above the more electronegative Cs. The opposite effect happens in pyridinium, where the N has an extra large orbital contribution. Finally in borazine the orbital has a bumpy topology, with dips above the Bs and peaks above the Ns.
References
Template loop detected: Template:Reflist

