Rep:Mod:inorganicismybestfriend
Inorganic computational lab (week 1)
Day 1
Optimization of BH3 molecule
A BH3 molecule has been drawn with three B-H bond distances set to 1.53 Å, 1.54 Å and 1.55 Å respectively. The geometry optimization was carried out by Gaussian using B3LYP method and 3-21G as basis sets.
Analysing the optimised BH3 molecule using two basis sets
The original output Log. file could be check through BH3-321-OPT
A table of the information of calculation is summarized in Table 1.
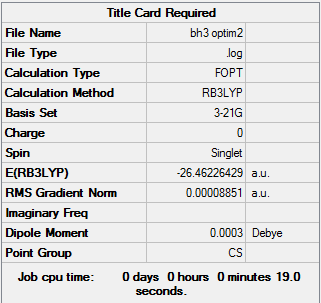
The log file was then checked to figure out whether the calculation has been to completion.
        Item               Value     Threshold  Converged?
Maximum Force            0.000220     0.000450     YES
RMS     Force            0.000106     0.000300     YES
Maximum Displacement     0.000940     0.001800     YES
RMS     Displacement     0.000447     0.001200     YES
Predicted change in Energy=-1.672479D-07
Optimization completed.
   -- Stationary point found.
                          ----------------------------
                          !   Optimized Parameters   !
                          ! (Angstroms and Degrees)  !
--------------------------                            --------------------------
! Name  Definition              Value          Derivative Info.                !
--------------------------------------------------------------------------------
! R1    R(1,2)                  1.1948         -DE/DX =   -0.0002              !
! R2    R(1,3)                  1.1947         -DE/DX =   -0.0002              !
! R3    R(1,4)                  1.1944         -DE/DX =   -0.0001              !
! A1    A(2,1,3)              120.0157         -DE/DX =    0.0                 !
! A2    A(2,1,4)              119.986          -DE/DX =    0.0                 !
! A3    A(3,1,4)              119.9983         -DE/DX =    0.0                 !
! D1    D(2,1,4,3)            180.0            -DE/DX =    0.0                 !
--------------------------------------------------------------------------------
GradGradGradGradGradGradGradGradGradGradGradGradGradGradGradGradGradGrad
Referring to the Log. file, all four values for force and displacement listed were converged to their minimum which were all smaller than the threshold value given. Therefore, it could be confirmed that the calculation has completed.
It could be found in the Log. file that the optimised B-H bond distance is 1.19 Å, and the optimised bond angle of H-B-H is 120.0о.
The better basis set for BH3 optimisation
A more accurate basis set, 6-31G(d,p), was used to optimise BH3 molecule
The original output Log. file could be check through BH3-321-OPT
A table of the information of calculation is summarized in Table 2.
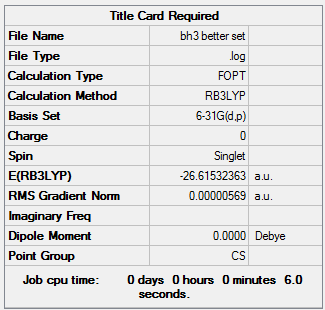
Again, the Log. file was checked if the calculation has been to completion.
Item                       Value     Threshold  Converged?
Maximum Force            0.000011     0.000450     YES
RMS     Force            0.000007     0.000300     YES
Maximum Displacement     0.000052     0.001800     YES
RMS     Displacement     0.000030     0.001200     YES
Predicted change in Energy=-7.533272D-10
Optimization completed.
   -- Stationary point found.
                          ----------------------------
                          !   Optimized Parameters   !
                          ! (Angstroms and Degrees)  !
--------------------------                            --------------------------
! Name  Definition              Value          Derivative Info.                !
--------------------------------------------------------------------------------
! R1    R(1,2)                  1.1924         -DE/DX =    0.0                 !
! R2    R(1,3)                  1.1924         -DE/DX =    0.0                 !
! R3    R(1,4)                  1.1924         -DE/DX =    0.0                 !
! A1    A(2,1,3)              119.9991         -DE/DX =    0.0                 !
! A2    A(2,1,4)              119.9978         -DE/DX =    0.0                 !
! A3    A(3,1,4)              120.0031         -DE/DX =    0.0                 !
! D1    D(2,1,4,3)            180.0            -DE/DX =    0.0                 !
--------------------------------------------------------------------------------
GradGradGradGradGradGradGradGradGradGradGradGradGradGradGradGradGradGrad
Referring to the Log. file, the calculation has been completed. It could be found in the Log. file that the optimised B-H bond distance is 1.19 Å, and the optimised bond angle of H-B-H is 120.0о. The value calculated perfectly agrees to the literature value given for the B-H bond distance of a BH3 molecule which is 1.19Å.[1]
Day 2
Use of psuedo-potentials and large basis sets for GaBr3
Pseudo-potentials could be used to easily model the core electrons of an atom from period 3 or higher. In order to investigate a 136-electron system of GaBr3, the pseudo-potential was used with the basic set adjusted to a medium level. The limitation needs mentioning that the symmetry of GaBr3 molecule should always be D3h.
The output Log. file could be check through DOI:10042/
A table of the information of calculation is summarized in Table 3.
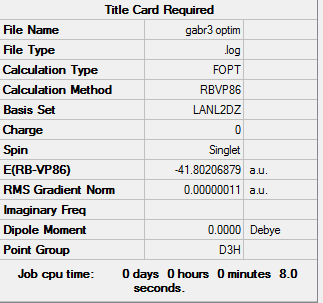
The Log. file was checked if the calculation has gone to completion.
    Item                   Value     Threshold  Converged?
Maximum Force            0.000000     0.000450     YES
RMS     Force            0.000000     0.000300     YES
Maximum Displacement     0.000002     0.001800     YES
RMS     Displacement     0.000001     0.001200     YES
Predicted change in Energy=-6.895727D-13
Optimization completed.
   -- Stationary point found.
                          ----------------------------
                          !   Optimized Parameters   !
                          ! (Angstroms and Degrees)  !
--------------------------                            --------------------------
! Name  Definition              Value          Derivative Info.                !
--------------------------------------------------------------------------------
! R1    R(1,2)                  2.3581         -DE/DX =    0.0                 !
! R2    R(1,3)                  2.3581         -DE/DX =    0.0                 !
! R3    R(1,4)                  2.3581         -DE/DX =    0.0                 !
! A1    A(2,1,3)              120.0            -DE/DX =    0.0                 !
! A2    A(2,1,4)              120.0            -DE/DX =    0.0                 !
! A3    A(3,1,4)              120.0            -DE/DX =    0.0                 !
! D1    D(2,1,4,3)            180.0            -DE/DX =    0.0                 !
--------------------------------------------------------------------------------
GradGradGradGradGradGradGradGradGradGradGradGradGradGradGradGradGradGrad
Referring to the Log. file, the calculation has been completed as the force and displacement values have converged to their minimum values that are smaller than threshold values.
It could be found that the optimised Ga-Br bond distance is 2.36 Å, which shows a slight deviation to the literature value 2.249 Å[2] measured by Gas phase electron diffraction. The optimised Br-Ga-Br bond angle is 120.0о.
The calculated value of Ga-Br bond distance is longer than that of literature reported, which indicates the need of a better basis set for the calculation. On the other hand, crystal packing of the molecule was not considered in the calculation; also, the calculation was carried out assuming the molecule is in its gas phase whereas the experimental value was determined using the closely-packed crystalline solid. Hence, the experimental value is supposed to be less than the value predicted. It could be certain that, the result predicted above is reasonable.
Combining basis-sets and psuedo-potentials
If a molecule under analysis contains heavy atoms and light atoms, it should be analyzed by combining psuedo-potentials and basis-set rather than applying them individually. For BBr3, Br atoms were calculated using LANL2DZ whereas B atom was calculated via 6-31G(d,p) basis set.
The HPC output Log. file could be check through DOI:10042/27680
A table of the information of calculation is summarized in Table 4.
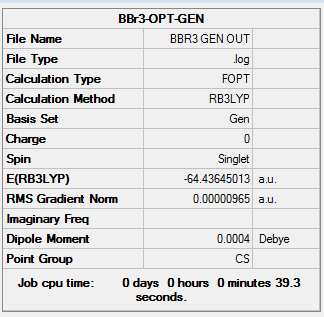
The output Log. file was checked whether the calculation has completed
       Item               Value     Threshold  Converged?
Maximum Force            0.000015     0.000450     YES
RMS     Force            0.000009     0.000300     YES
Maximum Displacement     0.000069     0.001800     YES
RMS     Displacement     0.000041     0.001200     YES
Predicted change in Energy=-1.505648D-09
Optimization completed.
   -- Stationary point found.
                          ----------------------------
                          !   Optimized Parameters   !
                          ! (Angstroms and Degrees)  !
--------------------------                            --------------------------
! Name  Definition              Value          Derivative Info.                !
--------------------------------------------------------------------------------
! R1    R(1,4)                  1.9339         -DE/DX =    0.0                 !
! R2    R(2,4)                  1.934          -DE/DX =    0.0                 !
! R3    R(3,4)                  1.9339         -DE/DX =    0.0                 !
! A1    A(1,4,2)              120.0018         -DE/DX =    0.0                 !
! A2    A(1,4,3)              120.0008         -DE/DX =    0.0                 !
! A3    A(2,4,3)              119.9974         -DE/DX =    0.0                 !
! D1    D(1,4,3,2)            180.0            -DE/DX =    0.0                 !
--------------------------------------------------------------------------------
GradGradGradGradGradGradGradGradGradGradGradGradGradGradGradGradGradGrad
Referring to the Log. file, the calculation has been completed as the force and displacement values have converged to their minimum values that are smaller than threshold values.
It could be found that the optimised B-Br bond distances is 1.93 Å, which shows a slight deviation to the literature value 1.893 Å[2] measured by Gas phase electron diffraction. The optimised Br-B-Br bond angle is 120.0о.
The calculated value of B-Br bond distance is longer than that of literature reported. This is again attributed to the difference in state of the molecule, and also without consideration of crystal packing of the molecule. Overall, the result is reasonable.
Structure comparison
The bond length of B-H, Ga-Br and B-Br bonds have been summarized in Table 5.
| Bond type | Optimised bond length | Literature bond length[2] |
|---|---|---|
| B-H | 1.1946 Å | 1.19 Å |
| Ga-Br | 2.3581 Å | 2.249 Å |
| B-Br | 1.924 Å | 1.893 Å |
Comparing BH3 and BBr3, the optimised bond lengths agree to the literature values which are experimentally determined. The B-H bond length is shorter than that of B-Br, which shows that replacing the H atoms as ligands by Br atoms elongates the bond. Both hydrogen and bromine form standard 2c-2e bonds with boron, and both of the have higher electronegativity than boron. The electronegativity difference between boron and bromine is larger than that of hydrogen and boron, therefore, the B-Br bond has a higher polarity and hence it has a longer bond length. On the other hand, the bromine has a more diffuse valence orbitals than hydrogen. In B-Br bond, boron and bromine has a poor overlap between 4p orbital of bromine and sp2 hybridized orbital of boron due to size mismatch. However, the B-H bond has a better orbital overlap between 1s orbital of hydrogen and sp2 hybridized orbital of boron. The better overlap between two atoms, the stronger bond they form, and shorter bond length the bond would be. Therefore, the B-Br bond is expected to be longer.
Comparing BBr3 and GaBr3, it could be seen that Ga-Br is a longer bond than B-Br, which shows that by replacing the central atom with a heavier atom would also elongate the bond. both gallium and boron form standard 2c-2e bonds with bromine as well. However, due to the difference in ground state electronic configuration, gallium has a poorer orbital overlap with bromine, which is 4p-4p overlap, comparing to 2p-4p overlap between boron and bromine. Therefore, the Ga-Br has a longer bond. It could also be explained by the larger atomic radius of gallium comparing to that of boron. Additionally, the electronegativity difference between gallium and bromine is larger than that of boron and bromine, so that the Ga-Br bond is more polar than B-Br bond contributing to a longer bond formed between gallium and bromine.
It could be seen that sometimes the Gaussview does not present a bond between bonding atoms as expected. It does not indicates that no bond is formed, however, it means that the bond length is not in the pre-defined range.
"Bond" is defined as the electronic attraction between atoms with opposite charge, which forms a new substance . Generally, The bonds are characterized into four types which are ionic, covalent, van der vaals' force and hydrogen bonding[3].
Day 3
Frequency analysis of BH3
The frequency analysis was carried out for the optimized BH3 molecule to analysis its structure. The symmetry of the BH3 molecule was restricted to D3h.
The HPC output Log. file could be check through DOI:10042/27681
A table of the information of calculation is summarized in Table 6, noted that the term "Imaginary frequency" has a value of 0, which means that the molecule is in its stable form.
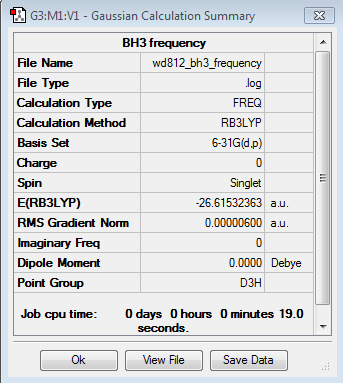
The Log. file was checked if the calculation has gone to completion.
       Item               Value     Threshold  Converged?
Maximum Force            0.000011     0.000450     YES
RMS     Force            0.000006     0.000300     YES
Maximum Displacement     0.000059     0.001800     YES
RMS     Displacement     0.000027     0.001200     YES
Predicted change in Energy=-8.300040D-10
Optimization completed.
   -- Stationary point found.
GradGradGradGradGradGradGradGradGradGradGradGradGradGradGradGradGradGrad
Referring to the Log. file, the calculation has been completed as the force and displacement values have converged to their minimum values that are smaller than threshold values.
Low frequencies ---  -22.2540   -0.0009   -0.0006   -0.0002   14.2099   16.5951
Low frequencies --- 1163.0042 1213.2113 1213.2913
The low frequencies lines are displayed above. the range of the low frequencies are within a range of 15cm-1.
Vibrational modes
The predicted IR spectrum is shown in Figure 1
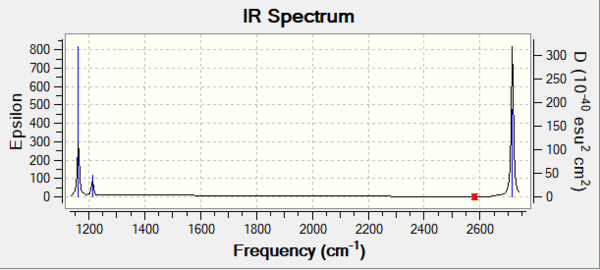
Referring to the IR spectrum, three peaks have been detected, which are 1163 cm-1, 1213 cm-1, 2715 cm-1 respectively. Although there are six different modes calculated, three peaks were found on the spectrum because Mode 2 and 3 are degenerate, also the Mode 5 and 6 are degenerate. Additionally, the Mode 4 is a symmetrical stretching which does not show any peak on IR due to no change in dipole moment. Therefore the three peaks indicates the Mode 1, Mode 2 and 3 as well as Mode 4 and 5.
Frequency Analysis of GaBr3
The frequency analysis was carried out for the optimized GaBr3 to investigate the structure of GaBr3 molecule. The symmetry of the GaBr3 molecule was restricted to D3h.
The HPC output Log. file could be check through DOI:10042/27683
A table of the information of calculation is summarized in Table 7, noted that the term "Imaginary frequency" has a value of 0, which means that the molecule is in its stable form.
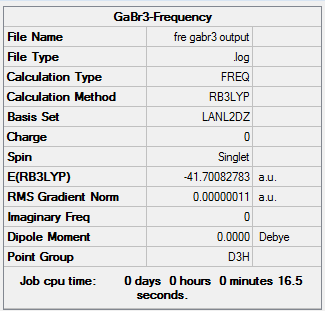
The Log. file was checked if the calculation has been completed.
     Item               Value     Threshold  Converged?
Maximum Force            0.000000     0.000450     YES
RMS     Force            0.000000     0.000300     YES
Maximum Displacement     0.000002     0.001800     YES
RMS     Displacement     0.000001     0.001200     YES
Predicted change in Energy=-6.142863D-13
Optimization completed.
   -- Stationary point found.
GradGradGradGradGradGradGradGradGradGradGradGradGradGradGradGradGradGrad
Referring to the Log. file, the calculation has been completed as the force and displacement values have converged to their minimum values that are smaller than threshold values.
Low frequencies ---   -0.5252   -0.5247   -0.0024   -0.0010    0.0235    1.2010
Low frequencies ---   76.3744   76.3753   99.6982
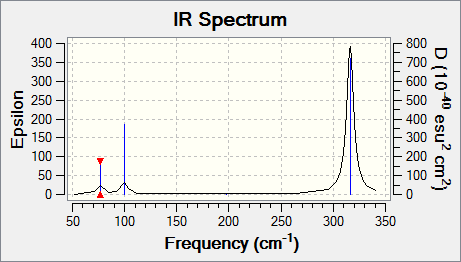
The lowest "real" normal mode is 76 cm-1.
The IR spectrum of the GaBr3 is shown in Figure 2.
Comparison between vibrational frequencies
A comparison between vibrational frequencies of GaBr3 and BH3 has been summarized in Table 8
| No. | BH3 Frequency (cm-1) | BH3 Intensity | BH3 Symmetry D3h point group | No. | GaBr3 Frequency (cm-1) | GaBr3 Intensity | GaBr3 Symmetry D3h point group |
|---|---|---|---|---|---|---|---|
| 1 | 1163 | 93 | A2" | 1 | 76 | 3 | E' (degenerate) |
| 2 | 1213 | 14 | E' (degenerate) | 2 | 76 | 3 | E' (degenerate) |
| 3 | 1213 | 14 | E' (degenerate) | 3 | 100 | 9 | A2" |
| 4 | 2582 | 0 | totally symmetric A1' | 4 | 197 | 0 | totally symmetric A1' |
| 5 | 2715 | 126 | E' (degenerate) | 5 | 316 | 57 | E' (degenerate) |
| 6 | 2715 | 126 | E' (degenerate) | 6 | 316 | 57 | E' (degenerate) |
From the table shown, it could be seen that there is a large difference between each frequency of vibrational mode of GaBr3 and BH3. Due to having a higher vibrational frequencies,B-H is a stronger bond comparing to Ga-Br. It is also found that the peak intensities of GaBr3 is lower than that of BH3. This is attributed to lower change in the dipole moment of GaBr3 molecule during vibration. For a non-linear molecule containing four atoms, there are supposed to be six different vibrational modes, but each IR spectrum gives only three peaks. This is because that there are two sets of degenerate modes, and also a totally symmetric vibrational mode which is IR inactive.
By comparing to the vibrational frequencies of A2" vibration mode and E' vibration modes for two different molecules. It could be seen that the A2" has a lower vibrational frequency than E' in BH3, whereas for Ga-Br, the vibrational frequency of A2" is higher than that of E'. This trend is due to long Ga-Br bond length.
Each molecule has an IR spectrum of three peaks which attribute to two degenerate modes and one individual mode. There is a slight difference in peak intensities. The results in shifting of degenerate mode into lower frequencies. It could also be seen that for each spectrum, the mode A2" has a similar energy to the mode E', whereas the mode A1' has a higher energy and it has a similar energy to another mode E'. This is related to different vibration motions. The mode A2" and the first degenerate mode E' are related to the bending motion, while the mode A1' and the second degenerate mode E' are related to stretching motions. The stretching motions are considered to have a relatively larger force constant than bending motions that results in higher energies required for stretching the bonds.
The reason why we have to use the same method and basis set for both the optimisation and frequency analysis calculation is that if two different method and basis set are used in optimisation, there would be two different optimised structures generated having two different total energies. The frequency analysis is used to examine whether the structure is fully optimised. Therefore, same method and basis set should be applied to optimisation and frequency analysis or otherwise the frequency analysis would be inaccurate for the structure.
The purpose of carrying out a frequency analysis is to minimize the structure. On the other hand, the vibrational modes of the structure as well as the IR spectrum could be predicted.
The term "Low frequencies" represent the motions on a molecule's mass centre. The number of the modes could be calculated following 3N-6 (for non-linear molecule) or 3N-5 (for linear molecule) where N is the number of atoms in the molecule.
Molecular Orbitals of BH3
The HPC output could be check through DOI:10042/27684
The information is summarized in Table 8
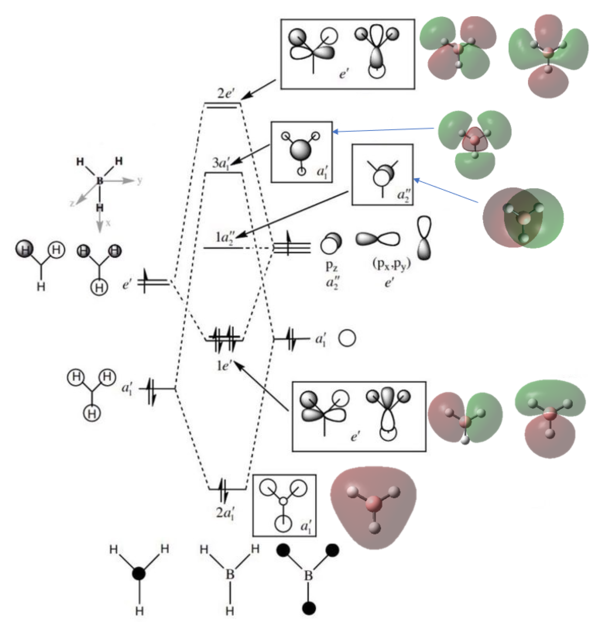
The molecular diagram has been shown in Figure 3
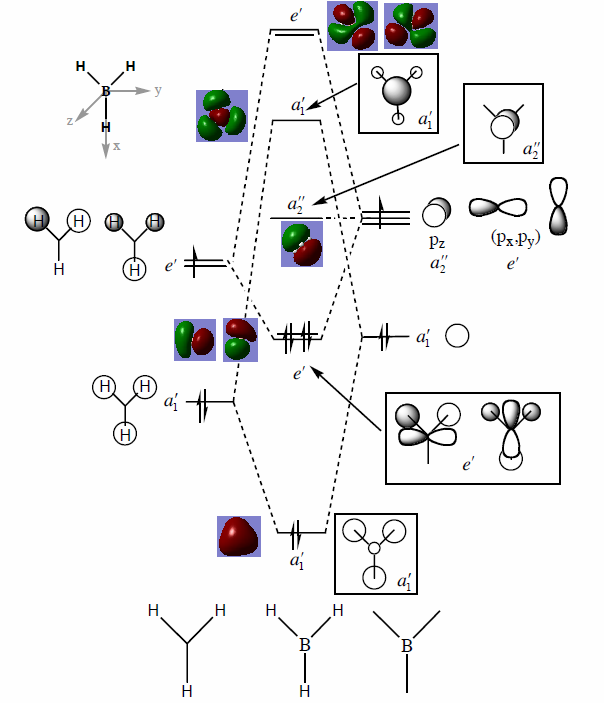
As it can be seen that there is a significant difference between the real MOs and LCAO MOs, as LCAO MOs only show the orbitals on each individual atom of a molecule, however, the real MOs delocolized on the whole, which indicates the electronic distributions. Therefore, real MOs could predict the electron density and distribution of a molecule but LCAO MOs cannot.
The qualitative MO theory could be use to predict the position of orbitals and the their combination. And the nodal planes of the combined orbitals could be predicted. However, the delocalized electron distribution and the shape of electron density could not be predicted by qualitative MO theory.
NBO Analysis of NH3
A NH3 was drawn. The molecule was optimizatized and frequency, MO analysis was carried out.
Geometry optimisation
The HPC output Log. file could be check through DOI:10042/27688
The information is summarized in Table 9
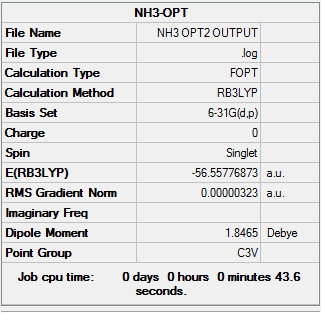
The Log. file was checked if the calculation has been completed.
      Item               Value     Threshold  Converged?
Maximum Force            0.000006     0.000450     YES
RMS     Force            0.000004     0.000300     YES
Maximum Displacement     0.000012     0.001800     YES
RMS     Displacement     0.000008     0.001200     YES
Predicted change in Energy=-9.844270D-11
Optimization completed.
   -- Stationary point found.
Referring to the Log. file, the calculation has been completed as the force and displacement values have converged to their minimum values that are smaller than threshold values.
It could be found that the optimised bond length is 1.01 Å, and the optimised H-N-H bond angle is 105.7o.
Frequency analysis
The information of calculation is summarized in the Table 10.
The HPC output Log. file could be check through DOI:10042/27685
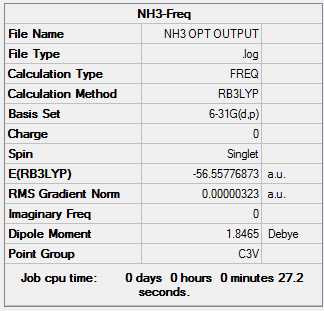
The Log. file was checked if the calculation has been completed.
        Item               Value     Threshold  Converged?
Maximum Force            0.000006     0.000450     YES
RMS     Force            0.000003     0.000300     YES
Maximum Displacement     0.000013     0.001800     YES
RMS     Displacement     0.000007     0.001200     YES
Predicted change in Energy=-1.131315D-10
Optimization completed.
   -- Stationary point found.
GradGradGradGradGradGradGradGradGradGradGradGradGradGradGradGradGradGrad
Referring to the Log. file, the calculation has been completed as the force and displacement values have converged to their minimum values that are smaller than threshold values.
Low frequencies ---   -0.0130   -0.0028   -0.0019    7.0747    8.1044    8.1047
Low frequencies --- 1089.3849 1693.9369 1693.9369
The low frequencies have been shown above and they are in the range of ±15cm-1.
Population (MO) analysis
The information of calculation is summarized in the Table 11.
The HPC output Log. file could be check through DOI:10042/27786
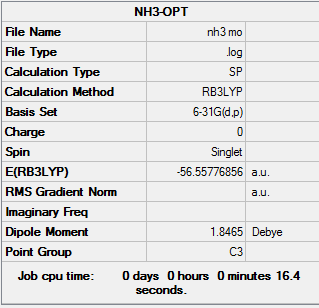
NBO Analysis
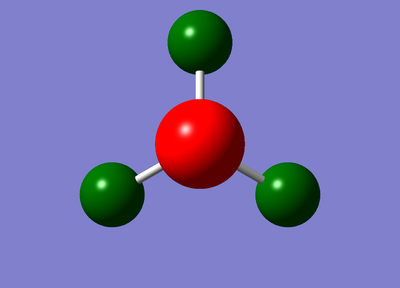
The diagram of charge distribution is shown on Figure 3.
The diagram of specific NBO charges for each atom is shown on Figure 4.
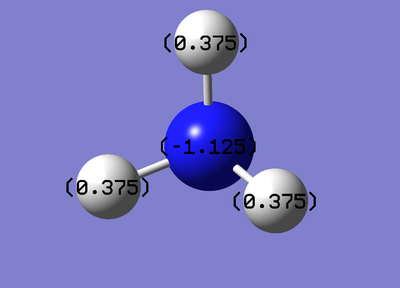
The nitrogen has a charge of -1.125 while hydrogen has a charge of 0.375.
Association energies: Ammonia-Borane
Optimisation of ammonia-borane (NH3BH3)
The HPC output Log. file could be check through DOI:10042/27687
The information of the optimisation is summarized in the Table 12.

The Log. file was checked if the calculation has been completed.
      Item               Value     Threshold  Converged?
Maximum Force            0.000139     0.000450     YES
RMS     Force            0.000063     0.000300     YES
Maximum Displacement     0.000771     0.001800     YES
RMS     Displacement     0.000338     0.001200     YES
Predicted change in Energy=-2.028054D-07
Optimization completed.
   -- Stationary point found.
Referring to the Log. file, the calculation has been completed as the force and displacement values have converged to their minimum values that are smaller than threshold values.
Frequency Analysis
The HPC output Log. file could be check through DOI:10042/27686
The information of calculation is summarized in the Table 13.

The Log. file was checked if the calculation has been completed.
    Item               Value     Threshold  Converged?
Maximum Force            0.000123     0.000450     YES
RMS     Force            0.000063     0.000300     YES
Maximum Displacement     0.000732     0.001800     YES
RMS     Displacement     0.000412     0.001200     YES
Predicted change in Energy=-2.067408D-07
Optimization completed.
   -- Stationary point found.
GradGradGradGradGradGradGradGradGradGradGradGradGradGradGradGradGradGrad
Referring to the Log. file, the calculation has been completed as the force and displacement values have converged to their minimum values that are smaller than threshold values.
Low frequencies ---   -0.0245   -0.0029    0.0011   17.6808   17.6833   37.1786
Low frequencies ---  265.6718  632.2168  639.3347
The low frequencies are close to zero and within the range of ±15 cm-1 .
Association Energy
To find the association energy of H3NBH3, the following table was constructed.
| Energy | |
| BH3 (a.u.) | -26.61532363 |
| NH3 (a.u.) | -56.55776872 |
| H3NBH3 (a.u.) | -83.22468907 |
| Dissociation Energy (a.u.) | -0.05159672 |
| Dissociation Energy (kJ/mol) | -135.47 |
According to Table 17, NH3BH3 is more stable than the individual NH3 and BH3, because of a new dative bond formed from the donation of lone pair electrons from the sp3 orbital of nitrogen atom to the vacant p orbital of boron atom, lowering the total energy of the whole system. Therefore, the process is spontaneous.
Mini project (Week 2)
Geometry optimisation
The optimisation information has been shown in Table 14.
| Isomer | Isomer 1 | Isomer 2 | Isomer 3 | Isomer 4 | ||||||||||||
| Sturucture |
|
|
|
| ||||||||||||
| File Name | js-isomer a-clean-opt | js-isomer b-clean-opt | js-isomer c-clean-opt | js-isomer d-clean-opt | ||||||||||||
| File Type | .log | .log | .log | .log | ||||||||||||
| Calculation Type | FOPT | FOPT | FOPT | FOPT | ||||||||||||
| Calculation Method | RB3LYP | RB3LYP | RB3LYP | RB3LYP | ||||||||||||
| Basis Set | Gen | Gen | Gen | Gen | ||||||||||||
| Charge | 0 | 0 | 0 | 0 | ||||||||||||
| Spin | Singlet | Singlet | Singlet | Singlet | ||||||||||||
| E(RB3LYP) | -2352.40630798 a.u | -2352.41109946 a.u | -2352.41631610 a.u | -2352.41626680 a.u | ||||||||||||
| RMS Gradient Norm | 0.00000182 a.u | 0.00000701 a.u | 0.00001373 a.u | 0.00001283 a.u | ||||||||||||
| Imaginary Frequency | ||||||||||||||||
| Dipole Moment | 0.0002 Debye | 0.1393 Debye | 0.0013 Debye | 0.1661 Debye | ||||||||||||
| Point Group | C1 | C1 | Cs | C2v | ||||||||||||
| Link to D-Space | DOI:10042/27791 | DOI:10042/27789 | DOI:10042/27788 | DOI:10042/27792 | ||||||||||||
| Real point Group | D2h | C1 | C2h | C2v |
The Log. files were checked if the calculations have been completed.
isomer 1
       Item               Value     Threshold  Converged?
Maximum Force            0.000142     0.000450     YES
RMS     Force            0.000073     0.000300     YES
Maximum Displacement     0.000881     0.001800     YES
RMS     Displacement     0.000486     0.001200     YES
Predicted change in Energy=-2.549175D-07
Optimization completed.
   -- Stationary point found.
isomer 2
       Item               Value     Threshold  Converged?
Maximum Force            0.000160     0.000450     YES
RMS     Force            0.000076     0.000300     YES
Maximum Displacement     0.001790     0.001800     YES
RMS     Displacement     0.000815     0.001200     YES
Predicted change in Energy=-5.669497D-07
Optimization completed.
   -- Stationary point found.
isomer 3
        Item               Value     Threshold  Converged?
Maximum Force            0.000005     0.000450     YES
RMS     Force            0.000003     0.000300     YES
Maximum Displacement     0.000066     0.001800     YES
RMS     Displacement     0.000029     0.001200     YES
Predicted change in Energy=-8.697724D-10
Optimization completed.
   -- Stationary point found.
isomer 4
             Item               Value     Threshold  Converged?
Maximum Force            0.000133     0.000450     YES
RMS     Force            0.000047     0.000300     YES
Maximum Displacement     0.000130     0.001800     YES
RMS     Displacement     0.000060     0.001200     YES
Predicted change in Energy=-1.697961D-08
Optimization completed.
   -- Stationary point found.
Referring to the Log. files, the calculations have all been completed as the force and displacement values have converged to their minimum values that are smaller than threshold values.
A summary of four isomers and their energies have been reported in Table 15 in a increasing order.
| Isomer No. | Energy i(a.u.) | Energy (kJ/mol) | Relative energy to the most stable isomer (kJ/mol) |
|---|---|---|---|
| Isomer 3 | -2352.41631610 | -6176268.14 | 0 |
| Isomer 4 | -2352.41626680 | -6176268.01 | 0.13 |
| Isomer 2 | -2352.41109945 | -6176254.45 | 13.70 |
| Isomer 1 | -2352.40630792 | -6176241.87 | 26.28 |
The Isomer 3 is the most stable isomer which has two terminal bromine atom aligning trans to each other. The isomer 4, is the second most stable isomer due to two large terminal bromine atoms aligning cis to each other considered to be having unfavourable flagpole interaction in between. There is a relatively larger rise in energy for Isomer 2 as well as for the least stable isomer 1. These two isomers have bridging bromine atom rather than bridging chlorine atom, which significantly raise the energy.The aluminum and chlorine atoms are in the same period that their orbital overlap is 3p-3p which is better than that of aluminum and bromine atom (3p-4p). Therefore the bridging bromide is unfavourable than bridging chloride, which forms a weaker bond ,in return, raising the energy of the structure. The isomer 1 has two bridging bromides, which is expected to have a higher energy than isomer 2 that has one.
The corresponding monomer AlBrCl2 has also been optimised in order to find the dissociation energy of the most stable dimer. The basis set 6-31G(d,p) was applied on Al and Cl, pseudo potential LANL2DZdp was used to optimised Br.
File:Moner_optim.mol |
The HPC output Log. file could be check through DOI:10042/27793
The information of the calculation is shown in Table 16
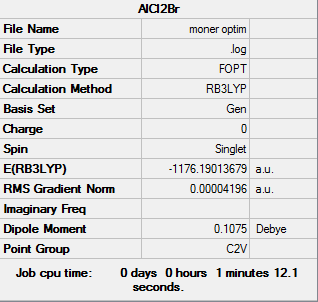
The Log. file was checked if the calculations have been completed.
         Item               Value     Threshold  Converged?
Maximum Force            0.000136     0.000450     YES
RMS     Force            0.000073     0.000300     YES
Maximum Displacement     0.000681     0.001800     YES
RMS     Displacement     0.000497     0.001200     YES
Predicted change in Energy=-7.984436D-08
Optimization completed.
   -- Stationary point found.
Referring to the Log. file, the calculations has been completed as the force and displacement values have converged to their minimum values that are smaller than threshold values.
For Frequency analysis
The HPC output Log. file could be check through DOI:10042/27858
The Log. file was checked if the calculations have been completed.
        Item               Value     Threshold  Converged?
Maximum Force            0.000081     0.000450     YES
RMS     Force            0.000042     0.000300     YES
Maximum Displacement     0.001588     0.001800     YES
RMS     Displacement     0.000974     0.001200     YES
Predicted change in Energy=-1.810813D-07
Optimization completed.
   -- Stationary point found.
Referring to the Log. file, the calculations has been completed as the force and displacement values have converged to their minimum values that are smaller than threshold values.
Low frequencies information:
Low frequencies ---   -0.0057   -0.0054   -0.0044    1.3568    3.6367    4.2604
Low frequencies ---  120.5042  133.9178  185.8950
Therefore, the minimal structure was found.
The association energy of the most stable isomer is calculated by :
ΔEassociation=E(Isomer 3)-2*E(monomer)= -2352.41631610-2*(-1176.19013679)= -0.03604252 a.u.
The corresponding association energy is -0.03604252 a.u. which is -95 kJ/mol. A negative association energy indicates that the dissociation process is endothermic, so that the dimer is more stable than the monomer. The aluminum has 6 valence electrons which is electron-deficient, however, by accepting an lone pair of electrons from bromine of another monomer that forms a dative bond, the electron deficiency could then be relieved. Therefore, dimer form of the AlBrCl2 is more stable.
The frequency analysis of four isomers
Isomer 1
The HPC output Log. file could be check through DOI:10042/27794
The Log. file was checked if the calculations have been completed.
    Item                   Value     Threshold  Converged?
Maximum Force            0.000008     0.000450     YES
RMS     Force            0.000004     0.000300     YES
Maximum Displacement     0.000293     0.001800     YES
RMS     Displacement     0.000143     0.001200     YES
Predicted change in Energy=-4.006395D-09
Optimization completed.
   -- Stationary point found.
Referring to the Log. file, the calculations has been completed as the force and displacement values have converged to their minimum values that are smaller than threshold values.
Low frequencies --- -5.1277 -4.9552 -3.1726 -0.0055 -0.0055 -0.0053 Low frequencies --- 14.8534 63.2885 86.0886
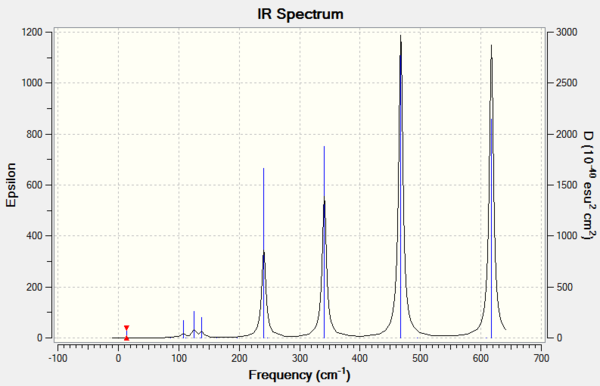
Isomer 2
The HPC output Log. file could be check through the link DOI:10042/27795
The Log. file was checked if the calculations have been completed.
    Item                   Value     Threshold  Converged?
Maximum Force            0.000034     0.000450     YES
RMS     Force            0.000011     0.000300     YES
Maximum Displacement     0.000897     0.001800     YES
RMS     Displacement     0.000373     0.001200     YES
Predicted change in Energy=-2.934869D-08
Optimization completed.
   -- Stationary point found.
Referring to the Log. file, the calculations has been completed as the force and displacement values have converged to their minimum values that are smaller than threshold values.
Low frequencies ---   -2.2705   -0.0013   -0.0008    0.0009    1.2791    3.3179
Low frequencies ---   17.1478   55.9562   80.0556
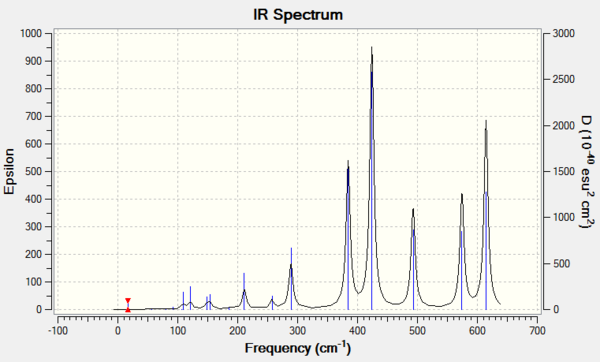
Isomer 3
The HPC output Log. file could be check through DOI:10042/27797
The Log. file was checked if the calculations have been completed.
       Item               Value       Threshold  Converged?
Maximum Force            0.000149     0.000450     YES
RMS     Force            0.000048     0.000300     YES
Maximum Displacement     0.001443     0.001800     YES
RMS     Displacement     0.000493     0.001200     YES
Predicted change in Energy=-2.272991D-07
Optimization completed.
   -- Stationary point found.
Referring to the Log. file, the calculations has been completed as the force and displacement values have converged to their minimum values that are smaller than threshold values.
Low frequencies ---   -3.7454   -1.6438   -0.1927    0.0029    0.0032    0.0036
Low frequencies ---   17.6893   48.9677   72.9414
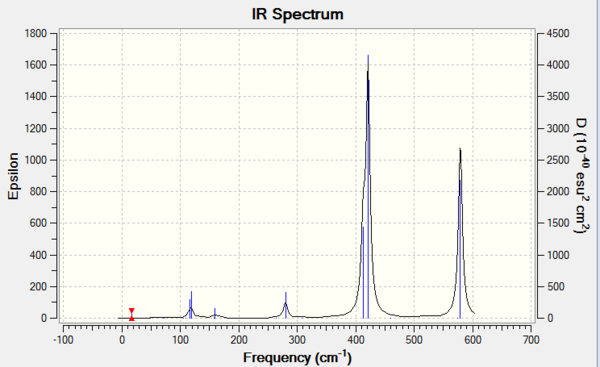
Isomer 4
The HPC output Log. file could be check through DOI:10042/27796
The Log. file was checked if the calculations have been completed.
    Item                   Value     Threshold  Converged?
Maximum Force            0.000032     0.000450     YES
RMS     Force            0.000013     0.000300     YES
Maximum Displacement     0.000421     0.001800     YES
RMS     Displacement     0.000153     0.001200     YES
Predicted change in Energy=-1.221637D-08
Optimization completed.
   -- Stationary point found.
Referring to the Log. file, the calculations has been completed as the force and displacement values have converged to their minimum values that are smaller than threshold values.
Low frequencies ---   -3.8138   -1.7954   -1.7806    0.0032    0.0033    0.0036
Low frequencies ---   17.7004   50.8811   72.1676
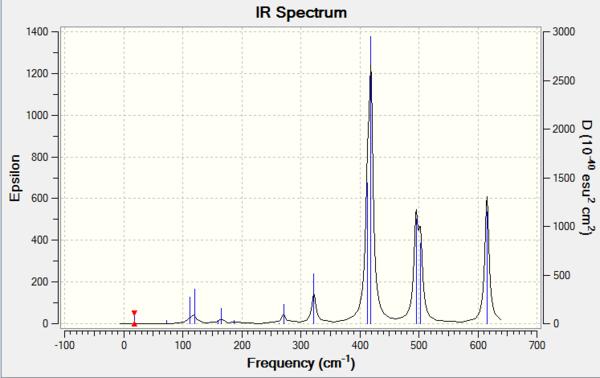
The result of frequency is shown in the below table.
| 1(D2h) | 2(C1) | 3(C2h) | 4(C2v) | |||||
| Mode | Frequency(cm-1) | Infrared | Frequency(cm-1) | Infrared | Frequency(cm-1) | Infrared | Frequency(cm-1) | Infrared |
| 1 | 15 | 0 | 17 | 0 | 18 | 0 | 17 | 0 |
| 2 | 63 | 0 | 56 | 0 | 49 | 0 | 51 | 0 |
| 3 | 86 | 0 | 80 | 0 | 73 | 0 | 79 | 0 |
| 4 | 87 | 0 | 92 | 1 | 105 | 0 | 99 | 0 |
| 5 | 108 | 5 | 107 | 0 | 110 | 0 | 103 | 3 |
| 6 | 111 | 0 | 110 | 5 | 117 | 9 | 121 | 13 |
| 7 | 126 | 8 | 121 | 8 | 120 | 13 | 123 | 6 |
| 8 | 135 | 0 | 149 | 5 | 157 | 0 | 157 | 0 |
| 9 | 138 | 7 | 154 | 6 | 160 | 6 | 158 | 5 |
| 10 | 163 | 0 | 186 | 1 | 192 | 0 | 194 | 2 |
| 11 | 197 | 0 | 211 | 21 | 263 | 0 | 264 | 0 |
| 12 | 241 | 100 | 257 | 10 | 280 | 29 | 279 | 25 |
| 13 | 247 | 0 | 289 | 48 | 308 | 0 | 309 | 2 |
| 14 | 341 | 161 | 384 | 154 | 413 | 149 | 413 | 149 |
| 15 | 467 | 347 | 424 | 274 | 421 | 438 | 420 | 411 |
| 16 | 494 | 0 | 493 | 107 | 459 | 0 | 461 | 35 |
| 17 | 608 | 0 | 574 | 122 | 574 | 0 | 570 | 32 |
| 18 | 616 | 332 | 614 | 197 | 579 | 316 | 582 | 278 |
| Total Number of Inactive Mode: | 11 | 4 | 11 | 6 | ||||
Due to the rule of 3N-6, where N is the number of atoms, the number of vibration modes of four isomer are all 18. However, not all the modes are IR-active. Only those vibrations with changes in overall dipole moment are active in IR spectrum. The more symmetric of the molecule structure, the easier that dipole moments could cancel out during the vibration. If the overall dipole moment is zero, the mode is then considered to be IR inactive that could not be shown on the IR spectrum. The table above has indicated that isomer 1 and isomer 3 are the molecules which owns the most number of inactive modes. Therefore, it could be deducted that isomer 1 and isomer 3 present less peaks on the IR spectra than the others due to the highly symmetric structures.
Some comparisons between vibration frequencies of different isomers at similar mode
| Mode | Isomer 1 | Isomer 2 |
| 11 | 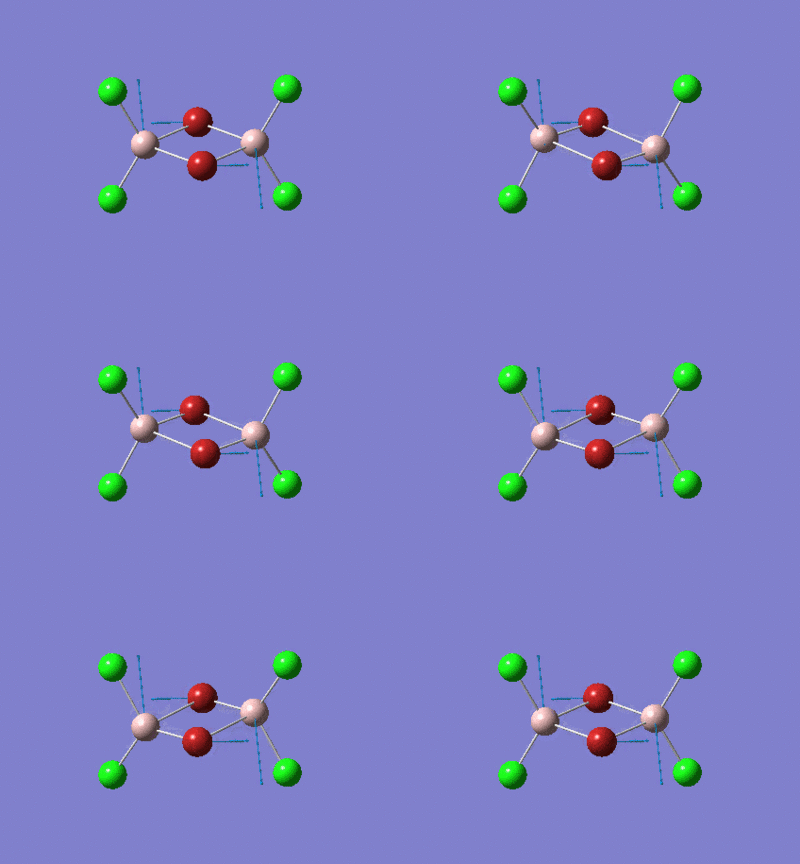 |
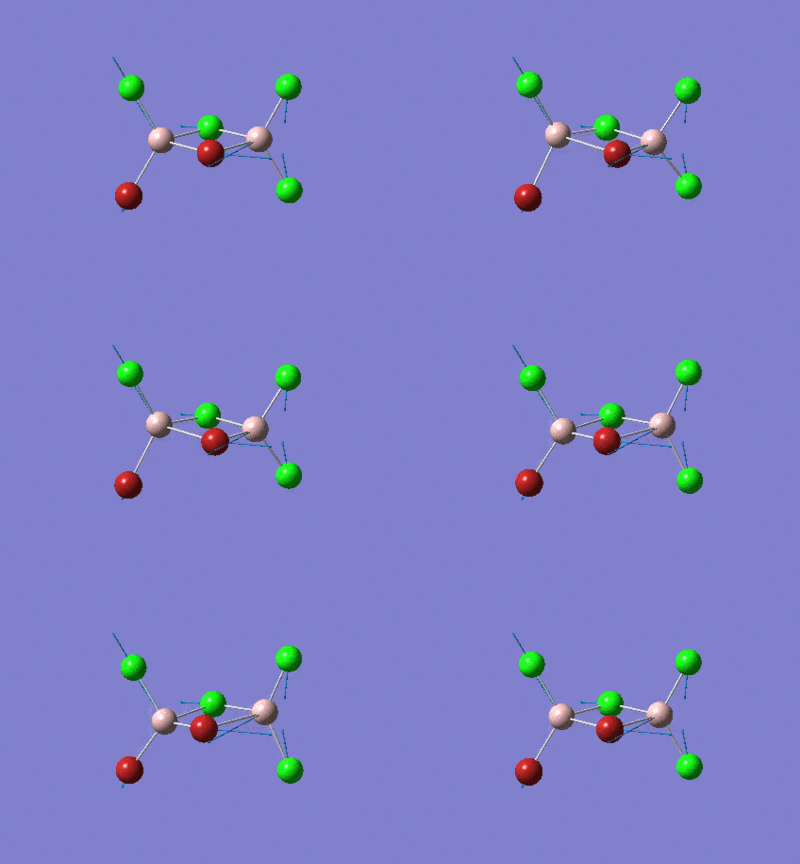
|
| Frequency | 197 | 263 |
| Intensity | 0 | 0 |
In this set of modes, two bridging bromides stretching mode has a lower frequency than one bridging bromide and one bridging chloride mode. Because the Al-Br has a lower vibration frequency than Al-Cl, which is due to weaker bond property, therefore, the isomer with four Al-Br stretchings (two bridging bromides) should have a lower vibration frequency than two Al-Br and two Al-Cl stretchings.
| Mode | Isomer 2 | Isomer 4 |
| 13,12 | 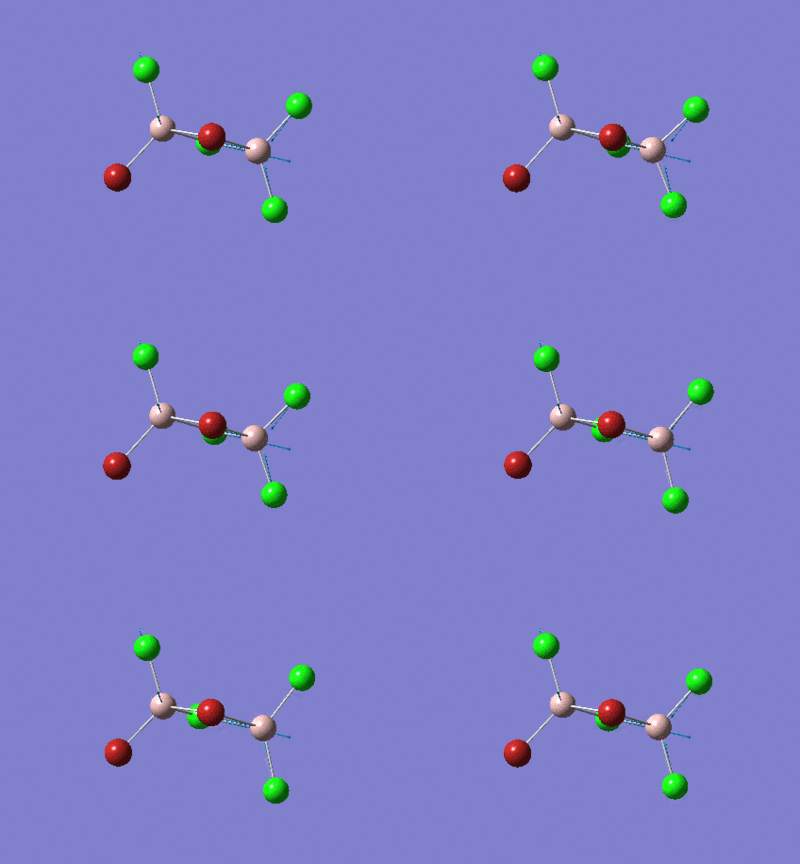 |

|
| Frequency | 257 | 309 |
| Intensity | 10 | 2 |
In this set of modes, the comparison is made between an isomer with two bridging chloride and one bridging chloride with one bridging bromide. The observation is that the less bridging bromide in the isomer, the larger the vibration frequency which indicates an overall stronger bond.
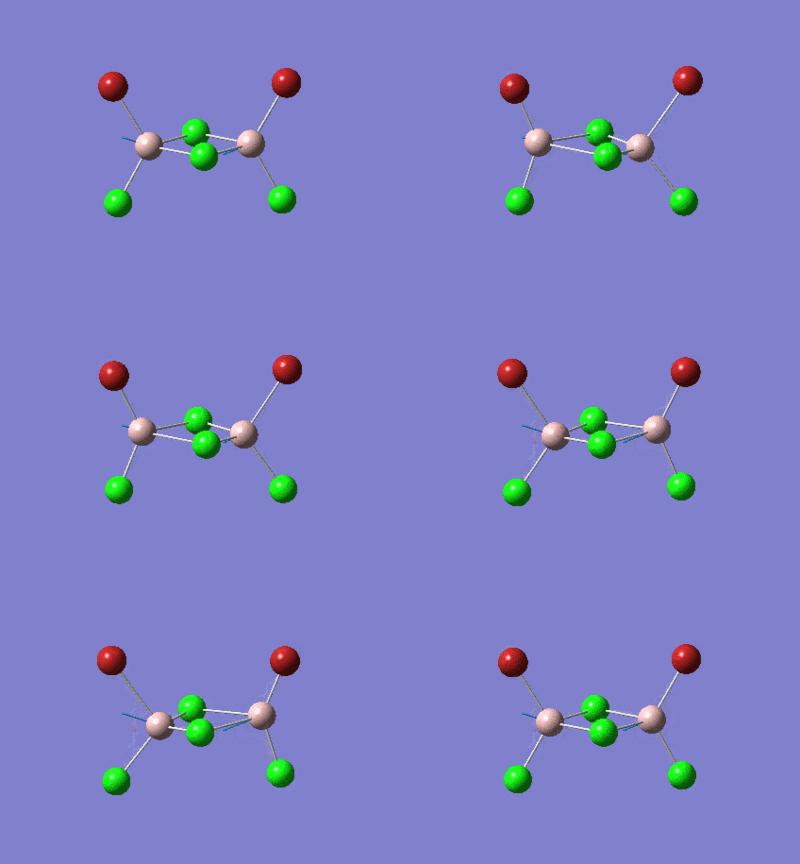
| Mode | Isomer 3 | Isomer 4 |
| 15 | 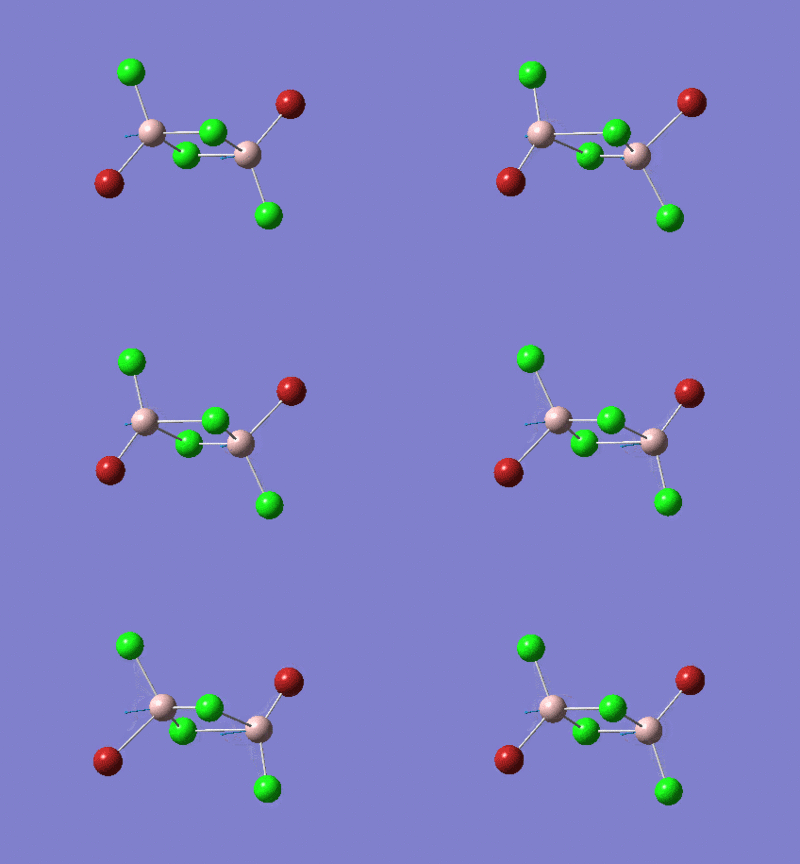 |
|
| Frequency | 421 | 438 |
| Intensity | 420 | 411 |
In this set of modes, both isomers have the same number of bridging chlorine atoms. The difference is that two terminal bromine atoms are placed in a tran or cis manner. The two bromine sits in cis position has a slightly higher frequency than trans. Frequency is directly proportional to the bond strength. It indicates that the Al-Br bond strength are very similar.
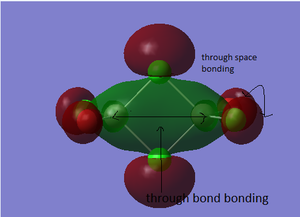
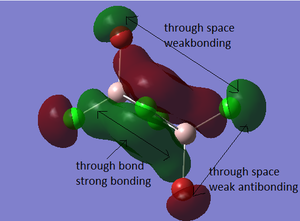
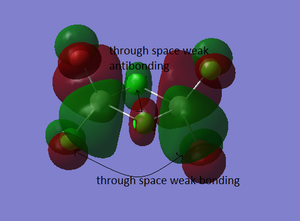
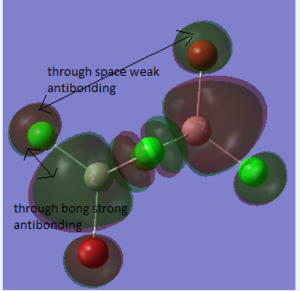
MO analysis of the most stable Isomer
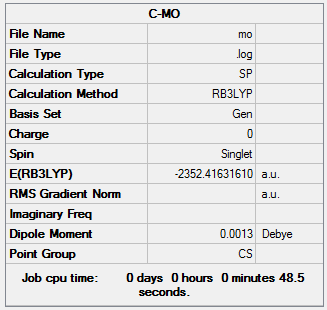
The HPC output Log. file could be check through DOI:10042/27798
The information of calculation is summarized in the Table 17.
Reference
- ↑ "Physical Constants of Organic Compounds", in CRC Handbook of Chemistry and Physics, Internet Version 2005, David R. Lide, ed., <http://www.hbcpnetbase.com>, CRC Press, Boca Raton, FL, 2005.
- ↑ 2.0 2.1 2.2 W. M. Haynes, D. R. Lide and T. J. Bruno, CRC handbook of chemistry and physics : a ready-reference book of chemical and physical data, 2012, 93, 9–23.
- ↑ Carl R. Nave (2005). HyperPhysics http://hyperphysics.phy-astr.gsu.edu/hbase/chemical/bond.html Retrieved May 18, 2005.


