Rep:Mod:inorganic DY2917
Calculating the association energy of Ammonia-Borane
BH3 section
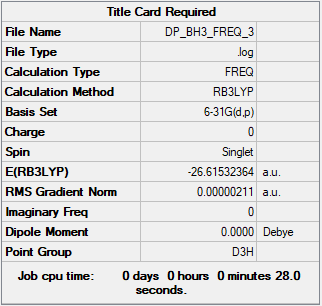
Summary Table
Method used: B3LYP
Basis set used: 6-31G(d,p)
Frequency and Optimisation Table
Frequency table
 Low frequencies ---  -11.6892  -11.6814   -6.5475    0.0009    0.0280    0.4290
 Low frequencies ---   1162.9746  1213.1390  1213.1392
Optimisation table
         Item               Value     Threshold  Converged?
 Maximum Force            0.000004     0.000450     YES
 RMS     Force            0.000003     0.000300     YES
 Maximum Displacement     0.000017     0.001800     YES
 RMS     Displacement     0.000011     0.001200     YES
Optimisation link
Frequency file: BH3_frequency.log
J-mol (BH3)
BH3molecule |
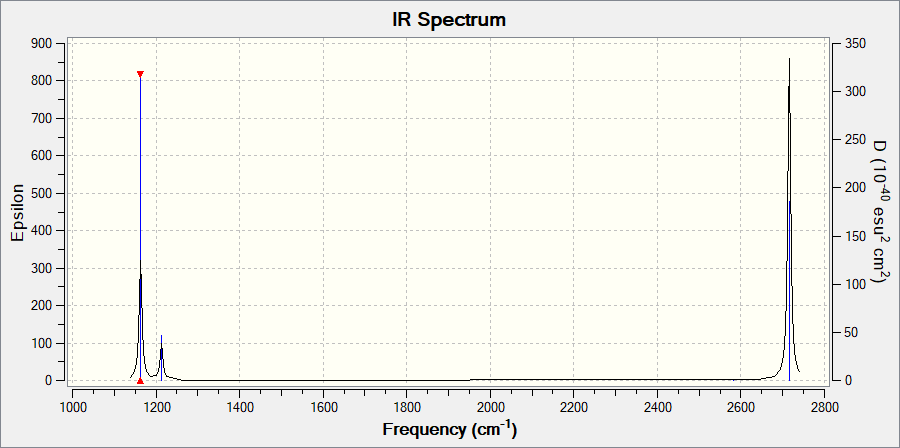
Vibrational spectrum
| wavenumber (cm-1 | Intensity (arbitrary units) | symmetry | IR active? | type |
| 1163 | 93 | A2 | yes | out-of-plane bend |
| 1213 | 14 | E | very slight | bend |
| 1213 | 14 | E | very slight | bend |
| 2583 | 0 | A1 | no | symmetric stretch |
| 2716 | 126 | E | yes | asymmetric stretch |
| 2716 | 126 | E | yes | asymmetric stretch |
There are 6 vibrational modes, however, only 3 are shown on the spectrum. Mode 2,3 and 5,6 are degenerate in energy, therefore, 4 peaks should be observed, (2,3) shown as one peak, (5,6) shown as another. Since mode 4 is symmetric stretch, it would have a net dipolar moment of 0, hence, will not be observed on the spectrum.
Molecular orbital
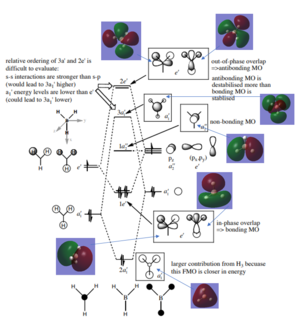
The molecular orbital predicted from LCAO is pretty similar to the real MOs calculated. However, for 3a', the real MO shows a cylinder shaped orbital at the centre while LCAO predicted it to be a sphere.
It suggest the highly accuracy of MO theory, despite from some little differences like stated above, it is still a really useful method to predict the Molecular orbitals. Good inclusion of the calculated MOs on to the diagram. Your evaluation of the usefulness of the LCAO approach is ok and you have used a good example in the 3a1' orbital to highlight differences between the calculated and LCAO MOs. However, the discussion is very brief and not very technical, talking about the differences in the relative contributions would have been better for example. Smf115 (talk) 13:52, 2 June 2019 (BST)
NH3 section
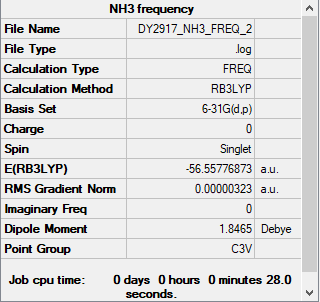
Summary Table
Method used: B3LYP
Basis set used: 6-31G(d,p)
Frequency and Optimisation Table
Frequency table
 Low frequencies ---   -0.0129   -0.0018   -0.0016    7.0724    8.1020    8.1023
 Low frequencies ---    1089.3849  1693.9369  1693.9369
Optimisation table
         Item               Value     Threshold  Converged?
 Maximum Force            0.000006     0.000450     YES
 RMS     Force            0.000003     0.000300     YES
 Maximum Displacement     0.000013     0.001800     YES
 RMS     Displacement     0.000007     0.001200     YES
Optimisation link
Frequency file: NH3_frequency.log
J-mol (NH3)
NH3molecule |
NH3BH3 Section
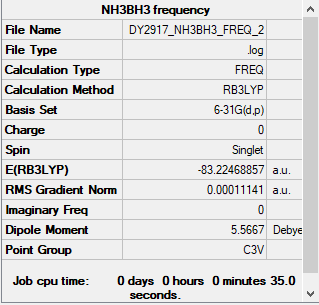
Summary Table
Method used: B3LYP
Basis set used: 6-31G(d,p)
Frequency and Optimisation Table
Frequency table
 Low frequencies ---   -0.0277   -0.0068   -0.0052   10.0740   10.1217   37.8835
 Low frequencies ---    265.3010   634.4256   639.2067
Optimisation table
         Item               Value     Threshold  Converged?
 Maximum Force            0.000349     0.000450     YES
 RMS     Force            0.000111     0.000300     YES
 Maximum Displacement     0.001345     0.001800     YES
 RMS     Displacement     0.000449     0.001200     YES
Optimisation link
Frequency file: NH3BH3_frequency.log
J-mol (NH3BH3)
NH3BH3molecule |
Energy
 ΔE=E(NH3BH3)-[E(NH3)+E(BH3)]
   =[-83.22469-(-56.55777-26.61532)]a.u.
   =-0.0516 a.u.
   =-135 kJ/mol
The dissociation energy of the B-N dative bond is -135 KJ/mol
Bond energies[2]
C-C single bond 348 KJ/mol
B-B single bond 293 KJ/mol
C-N single bond 305 KJ/mol
BY comparison, it indicates that the B-N dative bond is a relatively weak bond.
Correct calculation, good consideration of the accuracy for the final reported energy value and well-referenced comparisons used, good! Smf115 (talk) 13:55, 2 June 2019 (BST)
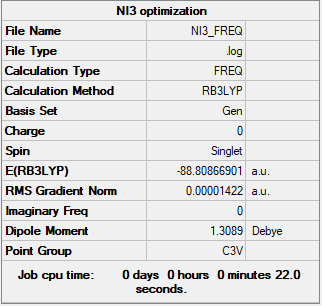
PPs and basis-sets of NI3
Summary Table
Method used: B3LYP
Basis set used: GEN [6-31G(d,p) for N, LanL2DZ for I]
The optimised distance for NI3 is 2.184 Å.
Frequency and Optimisation Table
Frequency table
 Low frequencies ---   -0.0576   -0.0292   -0.0031    1.9682    2.0035    2.2189
 Low frequencies ---   101.3080  101.3087  148.3159
Optimisation table
         Item               Value     Threshold  Converged?
 Maximum Force            0.000028     0.000450     YES
 RMS     Force            0.000014     0.000300     YES
 Maximum Displacement     0.000242     0.001800     YES
 RMS     Displacement     0.000122     0.001200     YES
Optimisation link
Frequency file: NI3_frequency.log
J-mol (NI3)
NI3molecule |
Mini Project: Ionic Liquid
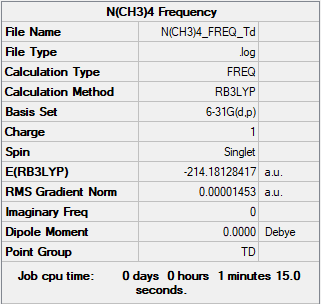
[N(CH3)4]+ section
Summary Table
Method used: B3LYP
Basis set used: 6-31G(d,p)
Frequency and Optimisation Table
Frequency table
 Low frequencies ---   -0.0011    0.0008    0.0009   22.8070   22.8070   22.8070
 Low frequencies ---   189.0756   292.9198  292.9198
Optimisation table
         Item               Value     Threshold  Converged?
 Maximum Force            0.000036     0.000450     YES
 RMS     Force            0.000015     0.000300     YES
 Maximum Displacement     0.000264     0.001800     YES
 RMS     Displacement     0.000146     0.001200     YES
Optimisation link
Frequency file: [N(CH3)4]+_frequency.log
J-mol ([N(CH3)4]+)
[N(CH)]molecule |
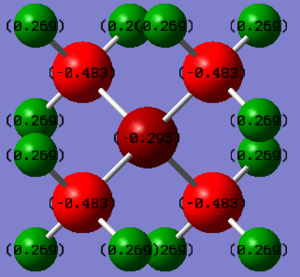
NBO Charge Distribution
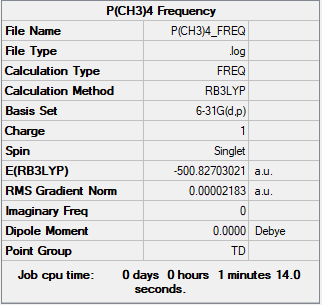
[P(CH3)4]+ section
Summary Table
Method used: B3LYP
Basis set used: 6-31G(d,p)
Frequency and Optimisation Table
Frequency table
 Low frequencies ---    0.0005    0.0012    0.0012   26.3157   26.3157   26.3157
 Low frequencies ---    160.9744  195.4740  195.4740
Optimisation table
         Item               Value     Threshold  Converged?
 Maximum Force            0.000027     0.000450     YES
 RMS     Force            0.000022     0.000300     YES
 Maximum Displacement     0.000436     0.001800     YES
 RMS     Displacement     0.000388     0.001200     YES
Optimisation link
Frequency file: [P(CH3)4]+_frequency.log
J-mol ([P(CH3)4]+)
[P(CH)]molecule |
NBO Charge Distribution
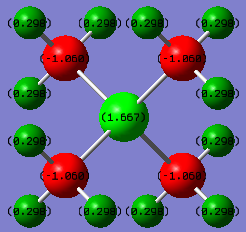
Charge Distribution Section
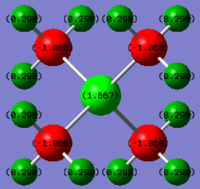
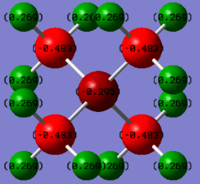
Comparison of the charge distribution of [P(CH3)4]+ with [N(CH3)4]+
 |
 |
Therefore:
in the [P(CH3)4]+ ion, P has a large positive charge of +1.667, C has a negative value of -1.060 and H being +0.298; in the [N(CH3)4]+ ion, N has a small negative charge of -0.295, C has a large negative value of -0.483 and H being +0.269.
Great, clear justification of the charge distributions using referenced electronegativity values! To improve though it would have been good to consider other factors, such as symmetry, the diffuse nature of the P orbitals and to compare the two ILs more. Also note, good use of a uniform distribution across both ILs, however, it would have been better to use a larger range of values to highlight the differences in the charges more. Smf115 (talk) 20:16, 4 June 2019 (BST)
Charge Distribution of [NR4]+(R=alkyl)
Q: What does the "formal" positive charge on the N represent in the traditional picture?
The electronic configuration of the nitrogen is 1s22s22p3. 5 valence electrons in total. 3 of these electrons are used for the covalant-bond between R groups. This leaves another 2 electron (lone pair) which is forming a dative bond with the 4th R group. The 2 electrons from the Nitrogen is then shared between N atom and R, which leads to an electron deficient on the Nitrogen atom and thereby positively charged. However, due to the interactions of Nitrogen with the attached groups, the +1 charge would be distributed among the atoms according to their electronegativity.
Q:On what atoms is the positive charge actually located for this cation?
Due to the electronegativity of atoms as shown above, hydrogen, which has the lowest electronegativity, would be where the +1 charge is spread out and located.
Clear identification of where the positive charge actually sits. However, the explanation of how the +1 formal charge arises should have considered formal electron counting. Smf115 (talk) 20:31, 4 June 2019 (BST)
MO section
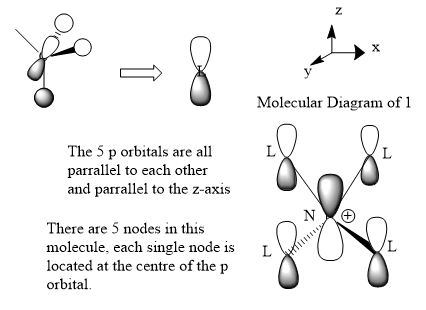
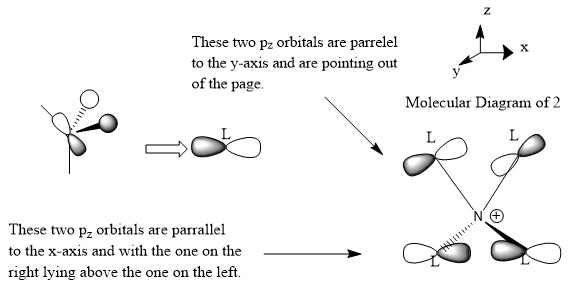
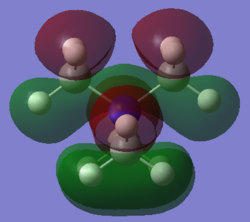
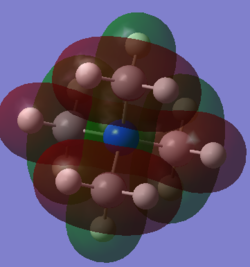
Molecular orbital 1
This belong to the No.21 MO(HOMO) from GaussView.
All interactions in this MO are bonding interactions.
 |
 |
 |
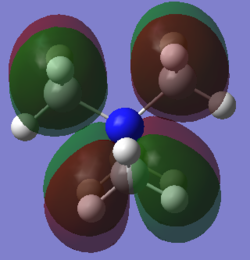
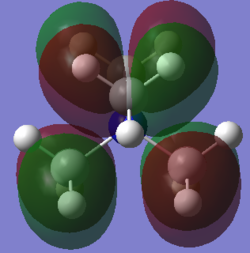
Molecular orbital 2
This belong to the No.16 MO from GaussView.
As can be easily seen from the z-axis projectory, there is antibonding character between the frontier p-orbital at the top and the one below. No bonding character can be seen in this MO.
 |
 |
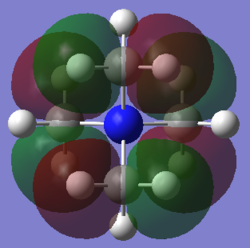 |
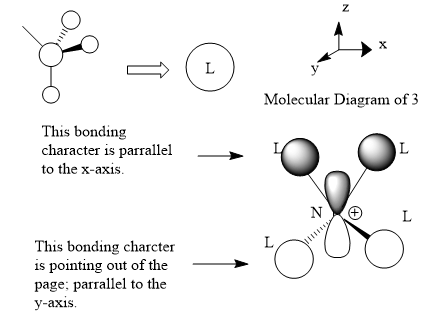
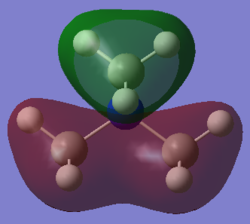
Molecular orbital 3
This belong to the No.16 MO from GaussView. This MO only shows bonding character, no anti-bonding character is presented here.
 |
 |
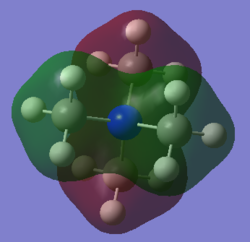 |
A good range of MOs have been selected (although the last one is incorrectly labelled as 16 again) and your FOs and LCAOs are correct. You have made an attempt at evaluating the character of the MOs but have made a few errors and should consider other details e.g. the non-bonding contribution from the N in MO16; the weak anti-bonding interaction through space in the final MO, to improve your analysis. Smf115 (talk) 20:43, 4 June 2019 (BST)
Overall a good report with really nice structure information and calculations throughout. Smf115 (talk) 20:43, 4 June 2019 (BST)
Reference
1.Prof. Patricia Hunt,'Figure 5' on Lecture_4_Tut_MO_diagram_BH3.
2.Yu-Ran Luo and Jin-Pei Cheng "Bond Dissociation Energies" in CRC Handbook of Chemistry and Physics, 96th Edition.
3.A.M. James and M.P. Lord in Macmillan's Chemical and Physical Data, Macmillan, London, UK, 1992.

