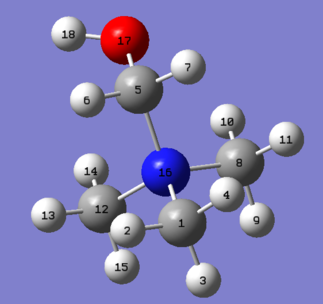
Rep:Mod:inorg1411 2
INTRODUCTION: IONIC LIQUIDS
| Ionic liquids are most commonly defined as salts which melt at or below 100°C. They generally possess moderate conductivities, low vapour pressures, high thermal stabilities and low dielectric constants,[1] and are of great interest as solvents; in fact, as millions of simple ionic liquids exist and it is therefore possible to design an ionic liquid that is specific to a particular reaction, they have been referred to as 'designer solvents' in literature.[2] The low vapour pressures and high thermal stabilities of ionic liquids have also led to them being termed 'green solvents' as they often lead to a reduction in pollution when used instead of conventional solvents;[2] however, as ionic liquids can be toxic and non-biodegradable, this term must be used with care. In this project, the properties of several related cations have been investigated. |
PART 1: COMPARISON OF SELECTED 'ONIUM' CATIONS
OPTIMISATION
[N(CH3)4]+ Optimisation
| Molecule | 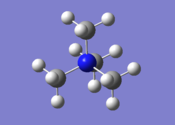
|
|---|---|
| File (.log) | Output Files |
| Calculation Type | FOPT |
| Calculation Method | RB3LYP |
| Basis Set | 6-31G(d,p) |
| Final Energy (au) | -214.18127374 |
| Gradient (au) | 0.00000030 |
| Dipole Moment (Debye) | 2.97 |
| Point Group | C1 |
| Calculation Time (secs) | 270 |
| The cation [N(CH3)4]+ was optimised using the 6-31G(d,p) basis set, using the additional keywords int=ultrafine scf=conver=9 nosymm. The int=ultrafine scf=conver=9 keywords specify a tighter grid for numerical integration which should lead to more accurate results, whilst the nosymm keyword destroys symmetry, allowing the cation to move to its lowest energy structure during the optimisation calculation. This is useful as the point group of the cation is unknown. The log file for this calculation, along with other details, can be found in the table to the left.
|
         Item               Value     Threshold  Converged?
 Maximum Force            0.000001     0.000015     YES
 RMS     Force            0.000000     0.000010     YES
 Maximum Displacement     0.000011     0.000060     YES
 RMS     Displacement     0.000003     0.000040     YES
 Predicted change in Energy=-2.916258D-12
 Optimization completed.

    -- Stationary point found.
|
| C-N Bond Distance | 1.509 Å |
|---|---|
| C-H Bond Distance | 1.090 Å |
| C-N-C Bond Angle | 109.47° |
| The C-N bond distance of the tetramethylammonium cation [with dimethyl(phenylsulfonylamido)phosphate as the anion] has been reported in literature to be 1.457-1.492 Å.[3], showing good agreement with the value calculated. The C-H bond distance was calculated to be 1.090 Å, a distance that is typical of C-H bonds; in fact, the C-H bond in the related molecule trimethylamine, N(CH3)3, has been reported in literature to be 1.090 Å.[4] The C-N-C bond angle was found to be 109.47°, as expected for a tetrahedral geometry. |
[P(CH3)4]+ Optimisation
| Molecule | 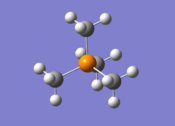
|
|---|---|
| File (.log) | Output Files |
| Calculation Type | FOPT |
| Calculation Method | RB3LYP |
| Basis Set | 6-31G(d,p) |
| Final Energy (au) | -500.82701102 |
| Gradient (au) | 0.00000112 |
| Dipole Moment (Debye) | 2.97 |
| Point Group | C1 |
| Calculation Time (secs) | 452 |
| The cation [P(CH3)4]+ was optimised using the 6-31G(d,p) basis set, using the additional keywords int=ultrafine scf=conver=9 nosymm. These keywords are the same as those used above to allow comparison and the reasons for using them have been explained above. The log file for this calculation, along with other details, can be found in the table to the left.
|
         Item               Value     Threshold  Converged?
 Maximum Force            0.000003     0.000015     YES
 RMS     Force            0.000001     0.000010     YES
 Maximum Displacement     0.000056     0.000060     YES
 RMS     Displacement     0.000020     0.000040     YES
 Predicted change in Energy=-2.809009D-10
 Optimization completed.

    -- Stationary point found.
|
| C-P Bond Distance | 1.816 Å |
|---|---|
| C-H Bond Distance | 1.093 Å |
| C-P-C Bond Angle | 109.47° |
| The C-P bond distance of the related molecule trimethylphosphine, P(CH3)3 has been reported to be 1.830 Å in literature,[5] showing good agreement of the value obtained. In addition to this, as mentioned above, a bond distance of 1.090 Å is typical of C-H bonds and for a tetrahedral geometry, a bond angle of 109.5° is expected. The values calculated for the C-H bond distance and C-P-C bond angle of [P(CH3)4]+ therefore agree well with previous works. |
[S(CH3)3]+ Optimisation
| Molecule | 
|
|---|---|
| File (.log) | Output Files |
| Calculation Type | FOPT |
| Calculation Method | RB3LYP |
| Basis Set | 6-31G(d,p) |
| Final Energy (au) | -517.68327361 |
| Gradient (au) | 0.00000018 |
| Dipole Moment (Debye) | 4.35 |
| Point Group | C1 |
| Calculation Time (secs) | 80 |
| The cation [S(CH3)3]+ was optimised using the 6-31G(d,p) basis set, using the additional keywords int=ultrafine scf=conver=9 nosymm. These keywords are the same as those used above to allow comparison and the reasons for using them have been explained above. The log file for this calculation, along with other details, can be found in the table to the left.
|
         Item               Value     Threshold  Converged?
 Maximum Force            0.000000     0.000015     YES
 RMS     Force            0.000000     0.000010     YES
 Maximum Displacement     0.000045     0.000060     YES
 RMS     Displacement     0.000018     0.000040     YES
 Predicted change in Energy=-1.006384D-11
 Optimization completed.

    -- Stationary point found.
|
| C-S Bond Distance | 1.823 Å |
|---|---|
| C-H Bond Distance | 1.092 Å |
| C-S-C Bond Angle | 102.75° |
| The C-S bond distance of the related molecule dimethylsulphide, S(CH3)2, has been reported in literature to be 1.802 Å.[6], showing good agreement with the value calculated. As mentioned above, a bond distance of 1.090 Å is typical of C-H bonds; the value calculated for the C-H bond distance of [S(CH3)3]+ therefore agrees well with previous works. The geometry of the cation is trigonal pyramidal so a bond angle of 107.00° is expected; however, a smaller bond angle of 102.75° was obtained. This observation is explained below. |
Comparison of the Bond Distances and Angles
| The exact same basis set, method and additional keywords were used in the optimisation of [N(CH3)4]+, [P(CH3)4]+ and [S(CH3)3]+, in order to allow comparison of the results. As described above, the bond lengths and angles obtained agree well with literature values and have been tabulated below [where X = N, P or S]: |
| C-X Bond Distance | C-X-C Angle | |
|---|---|---|
| [N(CH3)4]+ | 1.509 Å | 109.47° |
| [P(CH3)4]+ | 1.816 Å | 109.47° |
| [S(CH3)3]+ | 1.823 Å | 102.75° |
| In general, bond lengths are inversely related to bond strength;[7] in other words, the stronger the bond and the greater the overlap between the atomic orbitals, the shorter the bond length. From examining the table of bond distances above, it can be seen that the C-N bond distance in [N(CH3)4]+ is shorter than the C-P bond distance in [P(CH3)4]+, despite both of them containing the same number of methyl groups and possessing the same net charge. The reason for this difference can be rationalised by looking at the sizes of the atoms involved; nitrogen and carbon are both in row 2 of the periodic table and their orbitals are therefore similar in size, leading to good overlap and a strong bond. On the other hand, phosphorus is in row 3 of the periodic table and is larger than the carbon atom, giving poorer orbital overlap and a weaker, longer bond.
       (Occupancy)   Bond orbital/ Coefficients/ Hybrids
 ---------------------------------------------------------------------------------
     1. (1.98631) BD ( 1) S   1 - C   2
                ( 51.33%)   0.7164* S   1 s( 16.95%)p 4.86( 82.42%)d 0.04(  0.63%)
                ( 48.67%)   0.6976* C   2 s( 19.71%)p 4.07( 80.16%)d 0.01(  0.14%)
If the sulphur atom underwent sp3 hybridisation, the contributions from the s and p orbitals would be expected to be s(25.00%), p(75.00%). Instead, s(16.95%), p(82.42%) is seen, implying that the orbitals involved in the S-C bond are more p-like. As p-orbitals are arranged orthogonal to each other, this leads to a smaller bond angle than predicted. |
FREQUENCY ANALYSIS
| A frequency analysis for all three cations was carried out to ensure that the optimised structure calculated was in its most stable ground state, rather than in the transition state. This is done by calculating the second derivative of the potential energy surface and examining the frequencies obtained; if all the frequencies are positive then a minima has been found, corresponding to the ground state, but if one of the frequencies is negative, a maximum has been found, corresponding to the transition state. |
[N(CH3)4]+ Frequency Analysis
| Molecule | 
|
|---|---|
| File (.log) | Output Files |
| Calculation Type | FREQ |
| Calculation Method | RB3LYP |
| Basis Set | 6-31G(d,p) |
| Final Energy (au) | -214.18127374 |
| Gradient (au) | 0.00000043 |
| Dipole Moment (Debye) | 2.97 |
| Point Group | C1 |
| Calculation Time (secs) | 147 |
| A frequency analysis was carried out on the optimised [N(CH3)4]+ cation using the 6-31G(d,p) basis set. The log file for this calculation, along with other details, can be found in the table to the left. |
         Item               Value     Threshold  Converged?
 Maximum Force            0.000001     0.000450     YES
 RMS     Force            0.000000     0.000300     YES
 Maximum Displacement     0.000020     0.001800     YES
 RMS     Displacement     0.000007     0.001200     YES
 Predicted change in Energy=-5.405535D-12
 Optimization completed.

    -- Stationary point found.
|
Low frequencies --- -5.5775 0.0010 0.0011 0.0011 2.6757 7.8594 Low frequencies --- 182.1994 288.1737 288.8958 |
| The low frequencies are all close to zero and within the range of +/- 15cm-1. In adddition to this, all the frequencies are positive, indicating that the minimum energy structure has been found. |
[P(CH3)4]+ Frequency Analysis
| Molecule | 
|
|---|---|
| File (.log) | Output Files |
| Calculation Type | FREQ |
| Calculation Method | RB3LYP |
| Basis Set | 6-31G(d,p) |
| Final Energy (au) | -500.82701102 |
| Gradient (au) | 0.00000111 |
| Dipole Moment (Debye) | 2.97 |
| Point Group | C1 |
| Calculation Time (secs) | 139 |
| A frequency analysis was carried out on the optimised [P(CH3)4]+cation. The log file for this calculation, along with other details, can be found in the table to the left. |
         Item               Value     Threshold  Converged?
 Maximum Force            0.000003     0.000450     YES
 RMS     Force            0.000001     0.000300     YES
 Maximum Displacement     0.000791     0.001800     YES
 RMS     Displacement     0.000318     0.001200     YES
 Predicted change in Energy=-4.224681D-09
 Optimization completed.

    -- Stationary point found.
|
Low frequencies --- -8.2826 0.0009 0.0023 0.0025 3.3157 5.1756 Low frequencies --- 155.9975 191.4692 191.8969 |
| The low frequencies are all close to zero and within the range of +/- 15cm-1. In addition to this, all the frequencies are positive, indicating that the minimum energy structure has been found. |
[S(CH3)3]+ Frequency Analysis
| Molecule | 
|
|---|---|
| File (.log) | Output Files |
| Calculation Type | FREQ |
| Calculation Method | RB3LYP |
| Basis Set | 6-31G(d,p) |
| Final Energy (au) | -517.68327361 |
| Gradient (au) | 0.00000027 |
| Dipole Moment (Debye) | 4.35 |
| Point Group | C1 |
| Calculation Time (secs) | 70 |
| A frequency analysis was carried out on the optimised [S(CH3)3]+cation using the 6-31G(d,p) basis set. The log file for this calculation, along with other details, can be found in the table to the left. |
         Item               Value     Threshold  Converged?
 Maximum Force            0.000001     0.000450     YES
 RMS     Force            0.000000     0.000300     YES
 Maximum Displacement     0.000071     0.001800     YES
 RMS     Displacement     0.000028     0.001200     YES
 Predicted change in Energy=-1.560029D-11
 Optimization completed.

    -- Stationary point found.
|
Low frequencies --- -9.3836 -3.3204 0.0036 0.0038 0.0039 3.9062 Low frequencies --- 162.1127 199.5854 199.7483 |
| The low frequencies are all close to zero and within the range of +/- 15cm-1. In addition to this, all the frequencies are positive, indicating that the minimum energy structure has been found. |
POPULATION ANALYSIS
| A population analysis was carried out on the [N(CH3)4]+, [P(CH3)4]+ and [S(CH3)3]+ cations. The output files for these calculations, along with other details, can be found below. |
| [N(CH3)4]+ | [P(CH3)4]+ | [S(CH3)3]+ | |||||
|---|---|---|---|---|---|---|---|
| File (.chk) | Output Files | File (.chk) | Output Files | File (.chk) | Output Files | ||
| Calculation Type | SP | Calculation Type | SP | Calculation Type | SP | ||
| Calculation Method | RB3LYP | Calculation Method | RB3LYP | Calculation Method | RB3LYP | ||
| Basis Set | 6-31G(d,p) | Basis Set | 6-31G(d,p) | Basis Set | 6-31G(d,p) | ||
| Final Energy (au) | -214.18127374 | Final Energy (au) | -500.82701102 | Final Energy (au) | -517.68327361 | ||
| Gradient (au) | - | Gradient (au) | - | Gradient (au) | - | ||
| Dipole Moment (Debye) | 2.97 | Dipole Moment (Debye) | 2.97 | Dipole Moment (Debye) | 4.35 | ||
| Point Group | C1 | Point Group | C1 | Point Group | C1 | ||
| Calculation Time (secs) | 17 | Calculation Time (secs) | 16 | Calculation Time (secs) | 12 | ||
Molecular Orbitals of [N(CH3)4]+
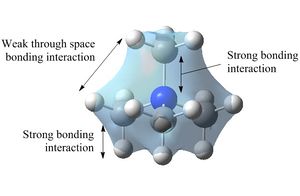
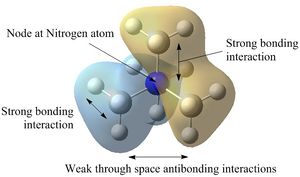
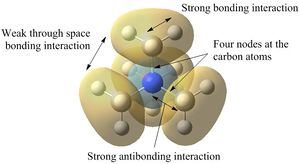
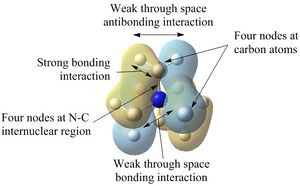
| Five occupied non-core orbitals were analysed below by looking at the interactions present. In general, bonding/antibonding interactions are stronger than through-space interactions and nodes in the internuclear region are more significant than those located on atoms. |
NATURAL BOND ORDER CHARGE & POPULATION ANALYSIS
| A natural bond orbital analysis was carried out on all three cations using the log file from the population analysis calculations carried out above so that the charge distribution could be analysed. The charge range used in all the images below is -1.000 to 1.000 to allow comparison. From the NBO charge analysis, it can be seen that the three cations have different charge distributions. This can be rationalised by considering the electronegativities of the atoms: |
| Pauling Electronegativites[8] | ||||||||
|---|---|---|---|---|---|---|---|---|
| N | S | C | P | H | ||||
| 3.04 | 2.58 | 2.55 | 2.19 | 2.20 | ||||
NBO Charge Analysis of [N(CH3)4]+
| [N(CH3)4]+ | |
|---|---|
 | |
| Nitrogen | -0.295 |
| Carbon | -0.483 |
| Hydrogen | 0.269 |
| In forming the [N(CH3)4]+ cation, the nitrogen has donated its lone pair to form the fourth N-C bond, leaving the nitrogen electron deficient. However, from the NBO charge analysis on the left, it can be seen that the nitrogen atom is actually negatively charged instead of positively charged as expected. As seen from the table of electronegativities, nitrogen is more electronegative than carbon and is therefore able to pull away significant electron density from carbon, thanks to good orbital overlap [carbon and nitrogen are similar in size]. This inductive effect can be seen from the NBO population analysis below and gives the nitrogen a slightly negative charge: |
       (Occupancy)   Bond orbital/ Coefficients/ Hybrids
 ---------------------------------------------------------------------------------
      4. (1.98452) BD ( 1) C   1 - N  17
                ( 33.65%)   0.5801* C   1 s( 20.78%)p 3.81( 79.06%)d 0.01(  0.16%)

                ( 66.35%)   0.8146* N  17 s( 25.00%)p 3.00( 74.97%)d 0.00(  0.03%)
|
| In an 'ideal' covalent bond, both atoms would be expected to contribute 50% to the bond. However, as seen above, the nitrogen contributes 66.35% to the C-N bond, supporting the rationale above; the nitrogen is more electronegative than the carbon so is able to pull the electron density of the C-N bond towards itself, giving it a negative charge. |
From the NBO charge distribution, it can also be seen that the carbon atoms in the [N(CH3)4]+ cation carry the most negative charge, despite the nitrogen in the C-N bond pulling electron density away from it. This is because carbon is more electronegative than hydrogen so each carbon is pulling electron density away from three hydrogen atoms. Once again, this can be seen from the results of the NBO analysis: |
       (Occupancy)   Bond orbital/ Coefficients/ Hybrids
 ---------------------------------------------------------------------------------
     1. (1.99118) BD ( 1) C   1 - H   2
                ( 63.47%)   0.7967* C   1 s( 26.42%)p 2.78( 73.53%)d 0.00(  0.05%)
                ( 36.53%)   0.6044* H   2 s( 99.95%)p 0.00(  0.05%)

     2. (1.99118) BD ( 1) C   1 - H   3
                ( 63.47%)   0.7967* C   1 s( 26.42%)p 2.78( 73.53%)d 0.00(  0.05%)
                ( 36.53%)   0.6044* H   3 s( 99.95%)p 0.00(  0.05%)

     3. (1.99118) BD ( 1) C   1 - H   4
                ( 63.47%)   0.7967* C   1 s( 26.42%)p 2.78( 73.53%)d 0.00(  0.05%)
                ( 36.53%)   0.6044* H   4 s( 99.95%)p 0.00(  0.05%)
|
| In each C-H bond of the methyl groups, the carbon is contributing 63.47% to the bond, making the carbons negatively charged but the hydrogens positively charged. However, as mentioned above, the nitrogen and carbon atomic orbitals are similar in size and show good orbital overlap, leading to the nitrogen pulling electron density away via the inductive effect; this results in the difference of charge between the carbons and heteroatom being much smaller than in the phosphorus and sulphur cations where the orbital overlap is less good due to more diffuse orbitals.
|
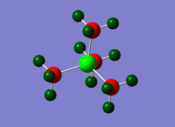
NBO Charge Analysis of [P(CH3)4]+
| [P(CH3)4]+ | |
|---|---|
 | |
| Phosphorus | 1.667 |
| Carbon | -1.060 |
| Hydrogen | 0.298 |
| In a similar way to the [N(CH3)4]+ cation, in forming the [P(CH3)4]+ cation, the phosphorus has donated its lone pair to form a fourth P-C bond, rendering it electron deficient. From the charge analysis, it can be seen that the phosphorus is very positively charged as expected. Another factor that contributes to the phosphorus being positively charged is the fact that it is electropositive with respect to carbon; this leads to the carbons pulling electron density away from the phosphorus in the P-C bonds. This observation is supported from the results of the NBO population analysis: |
       (Occupancy)   Bond orbital/ Coefficients/ Hybrids
 ---------------------------------------------------------------------------------
     4. (1.98031) BD ( 1) C   1 - P  17
                ( 59.57%)   0.7718* C   1 s( 25.24%)p 2.96( 74.67%)d 0.00(  0.08%)
                ( 40.43%)   0.6358* P  17 s( 25.00%)p 2.97( 74.15%)d 0.03(  0.85%)
|
| The phosphorus contributes 40.43% to the P-C bond as it is less electronegative than carbon, leading to it having a positive charge. However, this effect is not as significant as it is for the nitrogen cation; this is because phosphorus is in row 3 of the periodic table and is larger than the carbon atom, leading to more diffuse atomic orbitals and poorer orbital overlap with carbon. The difference in charge between the phosphorus and carbon atoms is therefore much greater than between the nitrogen and carbon atoms in the [N(CH3)4]+ cation discussed above.
|
NBO Charge Analysis of [S(CH3)3]+
| [S(CH3)3]+ | |
|---|---|
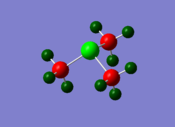 | |
| Sulphur | 0.917 |
| Carbon | -0.845 |
| Hydrogen | 0.297/0.279 |
| The results of the NBO charge analysis for [S(CH3)3]+ are similar to those for [P(CH3)4]+ and can be explained in the same way. The main difference between the two is that sulphur is slightly more electronegative than carbon [whereas phosphorus is electropositive with respect to carbon], leading to it pulling electron density away from the carbon in the C-S bond. This results in the sulphur atom being less positive than in [P(CH3)4]+. |
       (Occupancy)   Bond orbital/ Coefficients/ Hybrids
 ---------------------------------------------------------------------------------
     1. (1.98631) BD ( 1) S   1 - C   2
                ( 51.33%)   0.7164* S   1 s( 16.95%)p 4.86( 82.42%)d 0.04(  0.63%)
                ( 48.67%)   0.6976* C   2 s( 19.71%)p 4.07( 80.16%)d 0.01(  0.14%)
|
| From the NBO population analysis, the sulphur is shown to contribute 51.33% to the S-C bond. This is due to the fact that its electronegativity is very similar to that of carbon and means that the sulphur atom still remains relatively positive. Another interesting observation from the charge distribution of [S(CH3)3]+, is that though all the hydrogens are positively charged as expected [carbon is more electronegative than hydrogen, pulling electron density away], two of the hydrogens in each CH3 group are more positive than the third. This can be explained by looking at the NBO population analysis: |
                                                                              E(2)  E(j)-E(i) F(i,j)
         Donor NBO (i)                     Acceptor NBO (j)                 kcal/mol   a.u.    a.u.
 ===================================================================================================
  21. LP (   1) S   1                /103. BD*(   1) C   2 - H   5            2.32    1.02    0.043
  21. LP (   1) S   1                /106. BD*(   1) C   6 - H   9            2.32    1.02    0.043
  21. LP (   1) S   1                /109. BD*(   1) C  10 - H  13            2.32    1.02    0.043
|
| Hydrogens (5), (9) and (13) are those pointing furthest away from the sulphur atom and have the more negative charge of 0.279 compared to the other hydrogens. From the NBO analysis, it can be seen that the lone pair on sulphur donates into the antibonding orbital of the C-H bonds, where H = H(5), H(9), H(13). This leads to these hydrogens carrying a charge that is slightly more negative. |
PART 2: THE INFLUENCE OF FUNCTIONAL GROUPS
OPTIMISATION
[N(CH3)3(CH2OH)]+ Optimisation
| Molecule | 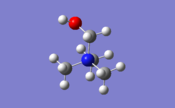
|
|---|---|
| File (.log) | Output Files |
| Calculation Type | FOPT |
| Calculation Method | RB3LYP |
| Basis Set | 6-31G(d,p) |
| Final Energy (au) | -289.39470869 |
| Gradient (au) | 0.00000093 |
| Dipole Moment (Debye) | 2.76 |
| Point Group | C1 |
| Calculation Time (secs) | 693 |
| The cation [N(CH3)3(CH2OH)]+ was optimised using the 6-31G(d,p) basis set, using the additional keywords int=ultrafine scf=conver=9 nosymm. These keywords are the same as those used above to allow comparison and the reasons for using them have been explained above. The log file for this calculation, along with other details, can be found in the table to the left.
|
         Item               Value     Threshold  Converged?
 Maximum Force            0.000002     0.000015     YES
 RMS     Force            0.000000     0.000010     YES
 Maximum Displacement     0.000056     0.000060     YES
 RMS     Displacement     0.000019     0.000040     YES
 Predicted change in Energy=-7.720330D-11
 Optimization completed.

    -- Stationary point found.
|
[N(CH3)3(CH2CN)]+ Optimisation
| Molecule | 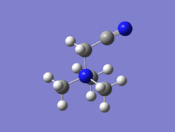
|
|---|---|
| File (.log) | Output Files |
| Calculation Type | FOPT |
| Calculation Method | RB3LYP |
| Basis Set | 6-31G(d,p) |
| Final Energy (au) | -306.39376153 |
| Gradient (au) | 0.00000088 |
| Dipole Moment (Debye) | 2.37 |
| Point Group | C1 |
| Calculation Time (secs) | 379 |
| The cation [N(CH3)3(CH2CN)]+ was optimised using the 6-31G(d,p) basis set, using the additional keywords int=ultrafine scf=conver=9 nosymm. These keywords are the same as those used above to allow comparison and the reasons for using them have been explained above. The log filefor this calculation, along with other details, can be found in the table to the left.
|
         Item               Value     Threshold  Converged?
 Maximum Force            0.000003     0.000015     YES
 RMS     Force            0.000001     0.000010     YES
 Maximum Displacement     0.000048     0.000060     YES
 RMS     Displacement     0.000012     0.000040     YES
 Predicted change in Energy=-8.297719D-11
 Optimization completed.

    -- Stationary point found.
|
FREQUENCY ANALYSIS
[N(CH3)3(CH2OH)]+ Frequency Analysis
| Molecule | 
|
|---|---|
| File (.log) | Output Files |
| Calculation Type | FREQ |
| Calculation Method | RB3LYP |
| Basis Set | 6-31G(d,p) |
| Final Energy (au) | -289.39470869 |
| Gradient (au) | 0.00000084 |
| Dipole Moment (Debye) | 2.76 |
| Point Group | C1 |
| Calculation Time (secs) | 200 |
| A frequency analysis was carried out on the optimised [N(CH3)3(CH2OH)]+ cation. |
         Item               Value     Threshold  Converged?
 Maximum Force            0.000003     0.000450     YES
 RMS     Force            0.000001     0.000300     YES
 Maximum Displacement     0.000085     0.001800     YES
 RMS     Displacement     0.000029     0.001200     YES
 Predicted change in Energy=-6.898737D-11
 Optimization completed.

    -- Stationary point found.
|
Low frequencies --- -6.3544 -0.0008 0.0005 0.0014 4.4357 8.1465 Low frequencies --- 131.0059 214.0755 255.9922 |
| The low frequencies are all close to zero and within the range of +/- 15cm-1. In addition to this, all the frequencies are positive, indicating that the minimum energy structure has been found. |
[N(CH3)3(CH2CN)]+ Frequency Analysis
| Molecule | 
|
|---|---|
| File (.log) | Output Files |
| Calculation Type | FREQ |
| Calculation Method | RB3LYP |
| Basis Set | 6-31G(d,p) |
| Final Energy (au) | -306.39376153 |
| Gradient (au) | 0.00000094 |
| Dipole Moment (Debye) | 2.37 |
| Point Group | C1 |
| Calculation Time (secs) | 204 |
| A frequency analysis was carried out on the optimised [N(CH3)3(CH2CN)]+ cation. |
         Item               Value     Threshold  Converged?
 Maximum Force            0.000003     0.000450     YES
 RMS     Force            0.000001     0.000300     YES
 Maximum Displacement     0.000133     0.001800     YES
 RMS     Displacement     0.000033     0.001200     YES
 Predicted change in Energy=-5.920970D-11
 Optimization completed.

    -- Stationary point found.
|
Low frequencies --- -5.2136 -2.3885 -0.0010 -0.0009 -0.0001 2.6590 Low frequencies --- 91.4716 153.9187 211.3643 |
| The low frequencies are all close to zero and within the range of +/- 15cm-1. In addition, all the frequencies are positive, indicating that the minimum energy structure has been found. |
POPULATION ANALYSIS
| A population analysis was carried out on the [N(CH3)3(CH2OH)]+ and [N(CH3)3(CH2CN)]+ cations using the optimisation files from above. The log files for these calculations, along with other details, can be found in the table below: |
| [N(CH3)3(CH2OH)]+ | [N(CH3)3(CH2CN)]+ | |||
|---|---|---|---|---|
| File (.chk) | Output Files | File(.chk) | Output Files | |
| Calculation Type | SP | Calculation Type | SP | |
| Calculation Method | RB3LYP | Calculation Method | RB3LYP | |
| Basis Set | 6-31G(d,p) | Basis Set | 6-31G(d,p) | |
| Final Energy (au) | -289.39470869 | Final Energy (au) | -306.39376153 | |
| Gradient (au) | - | Gradient (au) | - | |
| Dipole Moment (Debye) | 2.76 | Dipole Moment (Debye) | 2.37 | |
| Point Group | C1 | Point Group | C1 | |
| Calculation Time (secs) | 22 | Calculation Time (secs) | 25 | |
NATURAL BOND ORDER ANALYSIS
[N(CH3)3(CH2OH)]+ NBO Analysis
| A natural bond orbital analysis was carried out on the [N(CH3)3(CH2OH)]+ cation using the log file from the population analysis calculation carried out above. The charge range used in the images below is -1.000 to 1.000. |
 |
Electronegativities[8] | ||
|---|---|---|---|
| O | 3.44 | ||
| N | 3.04 | ||
| C | 2.55 | ||
| H | 2.20 | ||
| By replacing one of the hydrogens in a CH3 group of [N(CH3)4]+ for an electron donating OH group, the charge distribution has changed greatly. Firstly, the charge distribution shows that the oxygen atom is now the most negative. This is as expected as the oxygen is very electronegative and therefore draws electron density away from its neighbouring atoms, leaving carbon (5) and hydrogen (18) very positive relative to the other carbons and hydrogens. This effect can be seen from the NBO population analysis, where the oxygen is seen to contribute 66.10% to the C(5)-O bond and 76.26% to the H(18)-O bond: |
       (Occupancy)   Bond orbital/ Coefficients/ Hybrids
 ---------------------------------------------------------------------------------
     8. (1.99697) BD ( 1) C   5 - O  17
                ( 33.90%)   0.5822* C   5 s( 23.71%)p 3.21( 76.04%)d 0.01(  0.24%)
                ( 66.10%)   0.8130* O  17 s( 32.28%)p 2.10( 67.64%)d 0.00(  0.08%)


    17. (1.98889) BD ( 1) O  17 - H  18
                ( 76.26%)   0.8733* O  17 s( 22.10%)p 3.52( 77.83%)d 0.00(  0.07%)
                ( 23.74%)   0.4872* H  18 s( 99.77%)p 0.00(  0.23%)
|
| In a similar manner to that discussed for [N(CH3)4]+, the nitrogen has donated its lone pair to form a fourth C-N bond, rendering it electron deficient. However, from the charge distribution, it can be seen that the nitrogen is negatively charged. This is because the nitrogen is more electronegative than the surrounding carbon atoms and therefore pulls electron density away from them. As nitrogen and carbon are in the same row and are similar in size, this effect is expected to be significant as there is good orbital overlap. If the output files from the NBO population analysis are examined: |
       (Occupancy)   Bond orbital/ Coefficients/ Hybrids
 ---------------------------------------------------------------------------------
     4. (1.98455) BD ( 1) C   1 - N  16
                ( 34.07%)   0.5837* C   1 s( 20.99%)p 3.76( 78.85%)d 0.01(  0.16%)
                ( 65.93%)   0.8120* N  16 s( 25.64%)p 2.90( 74.33%)d 0.00(  0.03%)

     7. (1.98195) BD ( 1) C   5 - N  16
                ( 32.72%)   0.5720* C   5 s( 20.28%)p 3.92( 79.55%)d 0.01(  0.18%)
                ( 67.28%)   0.8202* N  16 s( 23.48%)p 3.26( 76.49%)d 0.00(  0.03%)

    12. (1.98442) BD ( 1) C   8 - N  16
                ( 33.59%)   0.5796* C   8 s( 20.43%)p 3.89( 79.40%)d 0.01(  0.16%)
                ( 66.41%)   0.8149* N  16 s( 25.41%)p 2.93( 74.56%)d 0.00(  0.03%)

    16. (1.98524) BD ( 1) C  12 - N  16
                ( 34.06%)   0.5836* C  12 s( 20.81%)p 3.80( 79.03%)d 0.01(  0.16%)
                ( 65.94%)   0.8120* N  16 s( 25.47%)p 2.92( 74.50%)d 0.00(  0.03%)
|
| The nitrogen contributes ~66.00% to each C-N bond as expected; the deviations in the exact contribution of the nitrogen explains why carbon (1), (8) and (12) have slightly differing charges. Though carbons (1), (8) and (12) contribute less to the C-N bond, their overall charges are all more negative than the nitrogen atom. This is because the carbons are more electronegative than the hydrogens and so, each carbon pulls away electron density away from three hydrogens, leaving the hydrogens positively charged and the carbons negatively charged. This can also be seen from the NBO population analysis.
|
                                                                              E(2)  E(j)-E(i) F(i,j)
         Donor NBO (i)                     Acceptor NBO (j)                 kcal/mol   a.u.    a.u.
 ===================================================================================================
  24. LP (   1) O  17                /138. BD*(   1) C   5 - H   6            3.97    1.02    0.057
  24. LP (   1) O  17                /139. BD*(   1) C   5 - H   7            1.21    1.04    0.032
  25. LP (   2) O  17                /137. BD*(   1) C   1 - N  16            0.58    0.56    0.016
  25. LP (   2) O  17                /138. BD*(   1) C   5 - H   6            0.83    0.75    0.023
  25. LP (   2) O  17                /139. BD*(   1) C   5 - H   7            2.97    0.77    0.043
  25. LP (   2) O  17                /140. BD*(   1) C   5 - N  16           18.96    0.51    0.088
|
| This shows that the lone pairs on oxygen interact weakly with the antibonding orbital of the C-H(6), C-H(7) and C-N bonds, making them more negative than expected. The combined energy of these interactions is higher for C-H(6) than for C-H(7), explaining why H(6) is more negative than H(7). In addition to this, it can be seen that there is a higher energy interaction between one of the lone pairs on oxygen and the antibonding orbital of the C-N bond. This indicates that there is significant delocalisation of the lone pairs in the structure, as expected if the OH group is acting as an electron donating group, and also explains why the nitrogen is more negative than in the [N(CH3)4]+ cation analysed above. |
[N(CH3)3(CH2CN)]+ NBO Analysis
| A natural bond orbital analysis was carried out on the [N(CH3)3(CH2CN)]+ cation using the log file from the population analysis calculation carried out above. The charge range used in the images below is -1.000 to 1.000. |
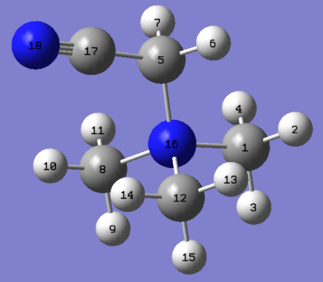 |
Nitrogen | Carbon | Hydrogen | |||
|---|---|---|---|---|---|---|
| (16) | -0.289 | (1) | -0.485 | (2,4) | 0.271 | |
| (18) | -0.186 | (5) | -0.358 | (3) | 0.277 | |
| (8,12) | -0.489 | (6,7) | 0.309 | |||
| (17) | 0.209 | (9,15) | 0.274 | |||
| (10,14) | 0.282 | |||||
| (11,13) | 0.269 | |||||
 |
Electronegativities[8] | ||
|---|---|---|---|
| N | 3.04 | ||
| C | 2.55 | ||
| H | 2.20 | ||
| The reasons why nitrogen (16) is negative despite being electron deficient are exactly the same as discussed above for the [N(CH3)3(CH2OH)]+ cation. However, the introduction of an electron-withdrawing CN group instead of the electron-donating OH group has altered the charge distribution. Nitrogen (18) is more electronegative than carbon (17) so it pulls the electron density in the C≡N bond towards itself, leaving carbon (17) positively charged and nitrogen (18) negatively charged. This can be seen if the results of the NBO population analysis are examined: |
       (Occupancy)   Bond orbital/ Coefficients/ Hybrids
 ---------------------------------------------------------------------------------
    17. (1.99595) BD ( 1) C  17 - N  18
                ( 42.68%)   0.6533* C  17 s( 47.95%)p 1.09( 52.03%)d 0.00(  0.02%)
                ( 57.32%)   0.7571* N  18 s( 45.15%)p 1.21( 54.49%)d 0.01(  0.36%)
|
| The nitrogen is contributing 57.32% to the C-N σ bond in the nitrile group as it is more electronegative - this is an example of the inductive effect. However, carbon (17) and nitrogen (18) are not as positive/negative as one might expect; this is due to the delocalisation of the lone pair on nitrogen. Examination of the results from the NBO population analysis show that the lone pair on nitrogen interacts with the antibonding orbital of the C(5)-C(17) bond, making the nitrogen less negative than expected and the carbons more negative: |
Donor NBO (i) Acceptor NBO (j) kcal/mol a.u. a.u. =================================================================================================== 27. LP ( 1) N 18 /149. BD*( 1) C 5 - C 17 12.71 0.94 0.098 |
| Carbon (5) is more positive than carbon (1), (8) and (12) as it is not only bonded to nitrogen (16) but it is in close proximity to nitrogen (18). Nitrogen (16) pulls electron density away from carbon (5) via the inductive effect due to its greater electronegativity. This leads to it having a greater contribution to the N(16)-C(5) bond: |
       (Occupancy)   Bond orbital/ Coefficients/ Hybrids
 ---------------------------------------------------------------------------------
     7. (1.97747) BD ( 1) C   5 - N  16
                ( 35.48%)   0.5956* C   5 s( 20.81%)p 3.80( 79.05%)d 0.01(  0.14%)
                ( 64.52%)   0.8033* N  16 s( 24.08%)p 3.15( 75.88%)d 0.00(  0.04%)
|
| Nitrogen (18) also pulls some electron density away from C(5) but this effect is not as significant as for N(16). In addition to this, carbon (5) is only attached to two hydrogens whilst carbons (8) and (12) are attached to three. As the carbons are more electronegative than the hydrogens, they pull electron density away from them, leaving the hydrogens positively charged and the carbons negatively charged. Carbon (5) is therefore expected to be more positive than carbons (8) and (12). However, there is not much difference between the charge of carbon (5) and carbons (8)/(12). This is because as mentioned above, the lone pair on the nitrogen interacts with the antibonding orbital of the C(5)-C(17). |
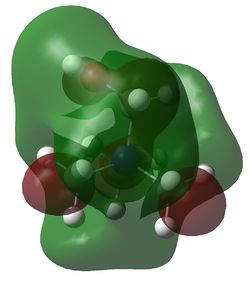
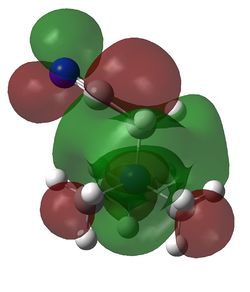
HOMO and LUMO for [N(CH3)4]+, [N(CH3)3(CH2OH)]+ and [N(CH3)3(CH2CN)]+
| [N(CH3)4]+ | [N(CH3)3(CH2OH)]+ | [N(CH3)3(CH2CN)]+ | |||
|---|---|---|---|---|---|
| LUMO | 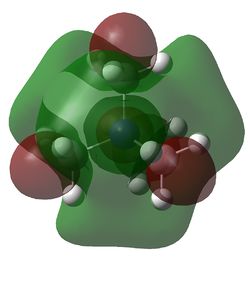
|
|
| ||
| Energy (au) | -0.13302 | -0.12460 | -0.18182 |
| HOMO | 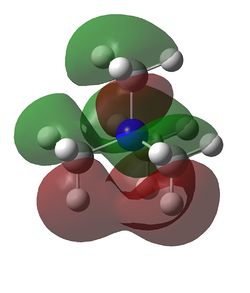
|

|
| ||
|---|---|---|---|---|---|
| Energy (au) | -0.57934 | -0.48764 | -0.50047 |
| HOMO-LUMO Gap (au) | 0.44632 | 0.36304 | 0.31865 |
|---|
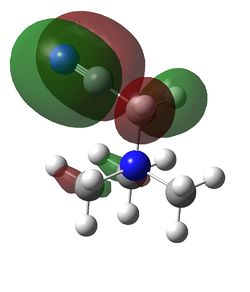
| Examination of the HOMOs of the three cations shows that the HOMO of the [N(CH3)4]+ cation is most stable, followed by the HOMO of [N(CH3)3(CH2CN)]+ and then the HOMO of [N(CH3)3(CH2OH)]+. The HOMO of the [N(CH3)4]+ is overall bonding as despite there being four nodes at the carbon atoms, there are strong bonding interactions between the C-H and C-N atoms. By replacing one of the hydrogens in one of the methyl groups for an electron-donating OH group, the HOMO becomes more antibonding. Not only are there fewer bonding interactions between the hydrogen atoms on the methyl group but there is a large antibonding interaction between the lone pair of oxygen and the CH2 fragment; in fact, this molecular orbital appears to be overall antibonding, explaining why it is higher in energy than the HOMO of [N(CH3)4]+. On the other hand, the addition of an electron-withdrawing CN group was found to give a HOMO with an energy between that of [N(CH3)4]+ and [N(CH3)3(CH2OH)]+. The electron density in the HOMO of [N(CH3)3(CH2CN)]+ is localised in the top half of the molecule as expected from the addition of an electron-withdrawing group; the CH3 groups and the nitrogen appear to be mostly non-bonding. Though there is an antibonding interaction between the C≡N π bond and the CH2 fragment, there is a stronger bonding interaction between the p orbitals of carbon and nitrogen. This means that this HOMO is likely to be weakly bonding, explaining why its energy is between the other two cations.
|
REFERENCES
|

