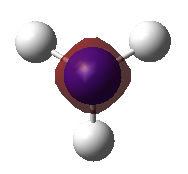
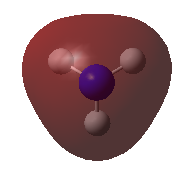
A trigonal planar BH3 molecule was created and all the B-H bonds were set to 1.500 Å. The molecule was then optimised using the B3LYP method and 3-21G basis set. The 3-21G basis set is a low level basis set, leading to short calculation times but a low accuracy. The log file for this optimisation, along with other details, can be found in the table to the left.
The RMS gradient was found to be close to zero [0.00020672 au], indicating that the optimisation had been completed; however, to double-check this, the output file was examined in order to make sure that the forces and displacements had converged:
         Item               Value     Threshold  Converged?
 Maximum Force            0.000413     0.000450     YES
 RMS     Force            0.000271     0.000300     YES
 Maximum Displacement     0.001610     0.001800     YES
 RMS     Displacement     0.001054     0.001200     YES
 Predicted change in Energy=-1.071764D-06
 Optimization completed.

-- Stationary point found.
The total energy curve and root mean square gradient graphs were obtained. From the total energy curve, it can be seen that the program is moving through the potential energy surface of the BH3 until it eventually finds the structure of minimum energy. The first derivative of the potential energy surface is zero at the minimum/maximum point; therefore, from the root mean square graph, the gradient should go to zero as a minimum/maximum structure is reached. To check that the structure is indeed the minimum [rather than the high energy transition state], a frequency analysis must be carried out [see below].
Higher Level Basis Set
As the initial optimisation of BH3 was done using a low level basis set which only provides a rough approximation of the structure, the molecule was re-optimised using the higher level 6-31G(d,p) basis set. Though the optimisation completed successfully, as seen from the fact that the forces and displacements had converged, when a frequency analysis was carried out, the range of the low frequencies was extremely high. The full log files can be found here: optimisation, frequency analysis
         Item               Value     Threshold  Converged?
 Maximum Force            0.000433     0.000450     YES
 RMS     Force            0.000284     0.000300     YES
 Maximum Displacement     0.001702     0.001800     YES
 RMS     Displacement     0.001114     0.001200     YES
 Predicted change in Energy=-1.189019D-06
 Optimization completed.

    -- Stationary point found.
Every molecule possesses 3N-6 vibrational frequencies and the 'low frequencies' represent the '-6'; generally, these low frequencies should be in the range of +/- 15cm-1. As three of the low frequencies were very negative, the initial optimisation and all subsequent calculations, including those of other molecules to allow comparison, were rerun with the additional keywords int=ultrafine scf=conver=9. These keywords specify a tighter grid for numerical integration, leading to more accurate results; this is because the method used, Density Functional Theory, adds an integration to each key step of a Hartree-Fock calculation so the accuracy of DFT calculations is related to the number of points used in the integration. [1]
The log file for the optimisation using a tighter integration grid, along with other details, can be found in the table to the left. As before, though the low RMS gradient of 0.00000162 au indicated that the optimisation had been completed, the final forces and displacements were checked to ensure that they had converged:
         Item               Value     Threshold  Converged?
 Maximum Force            0.000003     0.000015     YES
 RMS     Force            0.000002     0.000010     YES
 Maximum Displacement     0.000013     0.000060     YES
 RMS     Displacement     0.000008     0.000040     YES
 Predicted change in Energy=-6.153662D-11
 Optimization completed.

    -- Stationary point found.
Bond Distances and Angles of BH3
3-21G
6-31G(d,p)
B-H Bond Distance
1.193 Å
1.192 Å
H-B-H Bond Angle
120°
120°
The calculated B-H bond distance and H-B-H bond angle for the optimised BH3 molecule are shown in the table to the left. The experimentally found B-H bond length of BH3 has been reported to be 1.190 Å in literature,[2] showing very good agreement with the bond distances calculated from both basis sets. The H-B-H bond angle was found to be 120° as expected from a trigonal planar molecule such as BH3.
GaBr3 Optimisation
Heavier atoms exhibit significant relativistic effects that cannot always be recovered from the Schrodinger equation. Therefore, when studying molecules containing heavy atoms, a pseudo potential should be applied; this helps to recover some of the relativistic effects as well as making the calculations easier so they run quicker.
A trigonal planar GaBr3 molecule was created and the symmetry was restricted to the point group D3h. The molecule was then optimised using the LanL2DZ basis set, a medium level basis set which uses pseudo-potentials on the heavier elements; in this case, the pseudo-potentials are applied on both the Ga and Br atoms. The log file for this optimisation, along with other details, can be found in the table to the left.
As above, though the RMS gradient was close to zero [0.00000021 au], indicating that the optimisation had completed, the output file was examined to ensure that the forces and displacements had converged:
         Item               Value     Threshold  Converged?
 Maximum Force            0.000000     0.000015     YES
 RMS     Force            0.000000     0.000010     YES
 Maximum Displacement     0.000003     0.000060     YES
 RMS     Displacement     0.000002     0.000040     YES
 Predicted change in Energy=-2.078362D-12
 Optimization completed.

    -- Stationary point found.
Bond Distances and Angles
Ga-Br Bond Distance
2.350 Å
Br-Ga-Br Bond Angle
120.0°
The calculated Ga-Br bond distance and Br-Ga-Br bond angle are shown in the table to the left. The Ga-Br bond distance for gaseous GaBr3 has been reported to be 2.239 Å at 357 K;[3] this is similar to the value obtained in this calculation. The Br-Ga-Br bond angle was found to be 120° as expected for a trigonal planar molecule.
A BBr3 molecule was created using the log file from the optimisation of BH3 with the 6-31G(d,p) basis set. The molecule was optimised using the Gen basis set and the 6-31G(d,p) basis set was specified for the B atom whilst the LanL2DZ basis set was specified for the Br atoms; this was done because the Br atoms are heavy and require pseudo-potentials whilst the B atom is lighter and should be treated with a full basis set. The log file for this optimisation, along with other details, can be found in the table to the left.
Though the RMS gradient was found to be close to zero [0.00000382 au], the output file was examined to ensure that the forces and displacements had converged:
         Item               Value     Threshold  Converged?
 Maximum Force            0.000006     0.000450     YES
 RMS     Force            0.000004     0.000300     YES
 Maximum Displacement     0.000036     0.001800     YES
 RMS     Displacement     0.000023     0.001200     YES
 Predicted change in Energy=-3.166128D-10
 Optimization completed.

    -- Stationary point found.
Bond Distances and Angles
B-Br Bond Distance
1.934 Å
Br-B-Br Bond Angle
120.0°
The calculated B-Br bond distance and Br-B-Br bond angle are shown in the table to the left. The B-Br bond distance of gaseous BBr3 has been reported in literature as 1.896 Å;[4] this is similar to the value obtained in this optimisation. The Br-B-Br bond angle was found to be 120° as expected for a trigonal planar molecule.
Comparison of Bond Distances
Approximate bond lengths can be obtained from the sum of the individual covalent radii,[5] leading to an expected bond length of 1.150 Å for the B-H bond, 2.040 Å for the B-Br bond and 2.420 Å for the Ga-Br bond. These values have been included the table below, along with the bond distances obtained from the optimisation calculations described above:
Bond Distances of BH3, BBr3 and GaBr3
Calculated
Predicted
B-H (BH3)
1.191 Å
1.150 Å
B-Br (BBr3)
1.934 Å
2.040 Å
Ga-Br (GaBr3)
2.350 Å
2.420 Å
In general, bond lengths are inversely related to bond strength;[5] in other words, the greater the overlap between the atomic orbitals [and therefore, the stronger the bond], the shorter the bond length. By comparing the bond distances for BH3 and BBr3, it can be seen that changing the ligand from hydrogen to bromine leads to a longer bond distance. The hydrogen and bromine ligands are similar in that they are both X-type ligands and donate one electron to the central boron, forming a sigma bond, but their sizes differ greatly; this affects bond length as good orbital overlap occurs when the orbitals are similar in size and energy. Boron and hydrogen are both small atoms and show good orbital overlap whilst bromine is much larger, leading to its atomic orbitals being more diffuse, poorer orbital overlap with boron and a longer bond length. However, it should be noted that the electronegativity of the bromine ligand leads to the covalent B-Br bond having a degree of ionic character; this strengthens the bond and leads to a shorter bond length than would be expected from purely covalent interactions. This is why the calculated B-Br bond length is shorter than predicted from the sum of the covalent radii.
If the bond distance for BBr3 is compared to that of GaBr3, it can be seen that changing the central atom from boron to gallium leads to an increase in the bond length. Though boron and gallium are both in Group 13, gallium is in row 4 of the periodic table whilst boron is in row 2. Gallium and bromine are similar in size and should therefore be expected to show better orbital overlap however their larger size leads to their orbitals being more diffuse. This means that the orbital overlap is in fact weaker than that between boron and bromine, leading to a weaker bond and a longer bond length. In addition to this, as gallium is less electropositive than boron, the electronegativity difference between the gallium and bromine is smaller; this means that there is less ionic contribution to the covalent bond so the difference between the calculated bond distance and predicted bond distance for GaBr3 is smaller.
What is a Bond?
In general, a covalent bond is formed when there is an accumulation of electron density in areas where the atomic orbitals overlap and interfere constructively, most commonly in the internuclear region. This leads to a lowering of the energy of the molecule, making bonding a favourable process, because despite the potential energy of the electron rising as it moves into the internuclear region and away from the nucleus, the atomic orbitals contract as this happens, increasing the attraction between the electron and nucleus and resulting in a net lowering of potential energy.[6]
Gaussview does not always draw bonds where they are expected as it determines where bonds should be using a distance criteria; in other words, if the bond distance is larger than the pre-defined value used by Gaussview, a bond will not be drawn.
FREQUENCY ANALYSIS OF BH3 AND GaBr3
A frequency analysis is carried out to ensure that the optimised structure calculated is in its most stable ground state, rather than in the transition state. This is done by calculating the second derivative of the potential energy surface and examining the frequencies obtained; if all the frequencies are positive then a minima has been found, corresponding to the ground state, but if one of the frequencies is negative, a maximum has been found, corresponding to the transition state. It is important to use the same basis set and method for the optimisation and frequency analysis as the method chosen determines the approximations used to solve the Schrodinger equation during optimisation whilst the basis set determines the accuracy of the calculation. Changing these parameters can therefore lead to large differences in the energy obtained which can cause problems, especially for frequency analyses where the second-derivative of the potential energy surface is being calculated.
As mentioned above, every molecule possesses 3N-6 vibrational frequencies. The 'low frequencies' found in the log file of frequency analysis calculations correspond to the '-6' and represent the motions of the center of mass of the molecule. These low frequencies are generally very small, in the range of +/- 15 cm-1
A frequency analysis was carried out on the optimised BH3 molecule. As explained above, the calculation was performed with the additional keywords int=ultrafine scf=conver=9 in order to specify a tighter grid for the integration involved. The log file for this calculation, along with other details, can be found in the table to the left.
         Item               Value     Threshold  Converged?
 Maximum Force            0.000003     0.000450     YES
 RMS     Force            0.000002     0.000300     YES
 Maximum Displacement     0.000013     0.001800     YES
 RMS     Displacement     0.000007     0.001200     YES
 Predicted change in Energy=-6.803489D-11
 Optimization completed.

    -- Stationary point found.
The low frequencies are all close to zero and within the range of +/- 15cm-1
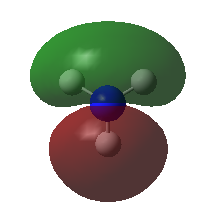
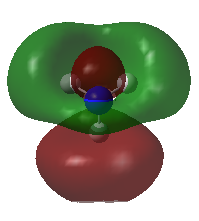
The form, frequency and intensity of the vibrations for BH3 have been tabulated below. All the frequencies are positive, indicating that the minimum energy structure has been found.
No.
Form of the Vibration
Frequency (cm-1)
Intensity
Symmetry (D3h)
1
All the hydrogen atoms are oscillating in a concerted fashion perpendicular to the plane of the molecule whilst the boron atom shows oscillation of a lower magnitude in the opposite direction.
1163
93
A2"
2
All the hydrogen atoms are oscillating in the plane of the molecule; however, one is oscillating in the opposite direction to the others and with greater magnitude. The boron atom is also oscillating slightly in the plane of the molecule.
1213
14
E'
3
Two of the hydrogen atoms are oscillating towards each other in the plane of the molecule. This causes the third hydrogen and boron atom to oscillate slightly in the opposite direction.
1213
14
E'
4
All the hydrogen atoms oscillate towards and away from the boron atom in a concerted fashion - symmetric stretching. The boron atom remains completely stationary as this occurs.
2582
0
A1'
5
Two of the hydrogen atoms show asymmetric stretching whilst the third hydrogen atom remains completely stationary. The boron atom oscillates slightly in the plane of the molecule as this occurs.
2716
126
E'
6
Two of the hydrogen atoms show symmetric stretching in the plane of the molecule whilst the third hydrogen atom oscillates in the opposite direction. The boron atom oscillates slightly in the plane of the molecule as this occurs.
2716
126
E'
The infrared spectrum calculated for BH3 is as follows:
Though there are six vibrations, only three peaks are seen in the infrared spectrum - this can be explained by examining the table of vibrations above in greater detail.
As there are two sets of degenerate vibrations - one at 1213 cm-1 and one at 2715 cm-1 - which possess the same intensity, they overlap on the infrared spectrum. This means that only one peak is seen for vibrations 2 and 3, and another for vibrations 5 and 6. Vibration 4 is also not seen as it is totally symmetric; for a vibration to be infrared active, it must involve a change in dipole moment.
A frequency analysis was carried out on the GaBr3 molecule, using the optimised file linked above. The same basis set and method were used, including the additional keywords int=ultrafine scf=conver=9 - the reasons for doing this have been explained at the beginning of this section.
         Item               Value     Threshold  Converged?
 Maximum Force            0.000000     0.000450     YES
 RMS     Force            0.000000     0.000300     YES
 Maximum Displacement     0.000004     0.001800     YES
 RMS     Displacement     0.000002     0.001200     YES
 Predicted change in Energy=-2.186303D-12
 Optimization completed.

    -- Stationary point found.
All the low frequencies are close to zero and in the range +/- 15 cm-1.
The form, frequency and intensity of the vibrations for GaBr3 have been tabulated below. All the frequencies are positive, indicating that the minimum energy structure has been found.
No.
Form of the Vibration
Frequency (cm-1)
Intensity
Symmetry (D3h)
1
Two of the bromine atoms are oscillating towards each other in the plane of the molecule. This causes the third bromine and gallium atom to oscillate in the opposite direction.
76
3
E'
2
All the bromine atoms are oscillating in the plane of the molecule; however, one is oscillating in the opposite direction to the others. The gallium atom is also oscillating slightly in the plane of the molecule.
76
3
E'
3
The gallium atom is oscillating perpendicular to the plane of the molecule whilst the bromine atoms are oscillating in the opposite direction and with lower magnitude.
100
9
A2"
4
All the bromine atoms oscillate towards and away from the gallium atom in a concerted fashion - symmetric stretching. The gallium atom remains completely stationary as this occurs.
197
0
A1'
5
One of the bromine atom oscillates away and towards the gallium atom whilst the gallium atom oscillates in the opposite direction. The remaining two bromine atoms oscillate slightly in the same direction as the other bromine atom.
316
57
E'
6
Two of the bromine atoms show asymmetric stretching whilst the third bromine atom remains completely stationary. The boron atom oscillates left to right in the plane of the molecule as this occurs.
316
57
E'
The infrared spectrum calculated for GaBr3 is as follows:
The lowest real normal mode is found at 76.39 cm-1. Similar to the spectrum for BH3, only three peaks are found. This is again due to the fact that there are two degenerate sets of vibrations and a totally symmetric A1" vibration which is not IR active.
Comparison of BH3 and GaBr3
The vibrational frequencies of BH3 and GaBr3 are listed in the table below:
Vibrational Frequencies of BH3 and GaBr3
No.
Frequency [BH3]
Symmetry [BH3]
Frequency [GaBr3]
Symmetry [GaBr3]
1
1163
A2"
76
E'
2
1213
E'
76
E'
3
1213
E'
100
A2"
4
2582
A1'
197
A1'
5
2716
E'
316
E'
6
2716
E'
316
E'
The two infrared spectra are similar in that they both show the same number of peaks; this is due to the fact that they both have two sets of degenerate E' modes and one totally symmetric A1' mode. Another similarity is that the A2" and E' modes lie fairly close together for both molecules whilst the A1' and E' modes also lie close together but at a much higher energy. This is because the vibrational modes at higher energies correspond to bond stretching whilst the vibrational modes at lower energies correspond to bond bending; in general, bending motions require less energy than stretching motions.[7]
The main difference between the two spectra is that the frequencies of the vibrational modes for BH3 are much higher than those of GaBr3. The frequency of the vibrational mode is given by
where is the frequency, is the force constant and is the reduced mass. BH3 has a lower reduced mass than GaBr3 and is also expected to have a higher force constant as the B-H bond is stronger than the Ga-Br bond. This is because boron and hydrogen are small atoms and show good orbital overlap, leading to strong bonds, whilst gallium and bromine are much larger and have more diffuse atomic orbitals, resulting in a weaker bond. The combination of a lower reduced mass and a higher force constant means that the vibrational frequencies of BH3 should be significantly higher than those of GaBr3 as observed.
From the table of vibrational frequencies above, it can also be seen that there has been a reordering of vibrational modes; in BH3, the A2" vibrational mode occurs at a lower frequency than the first degenerate E' modes whilst for GaBr3, the opposite occurs.
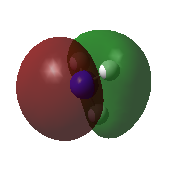
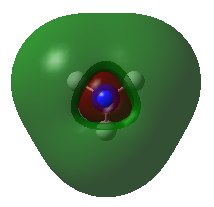
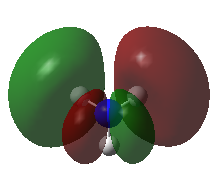
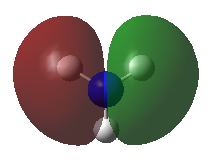
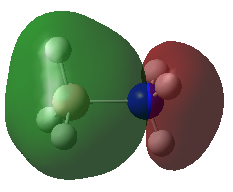
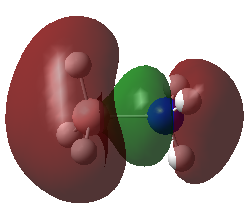
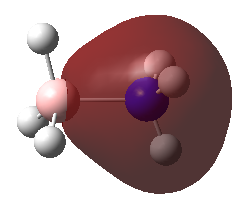
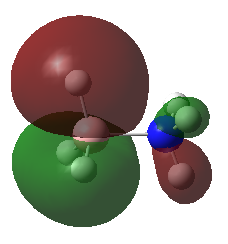
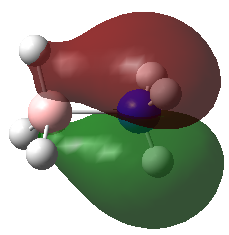
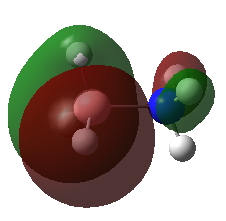
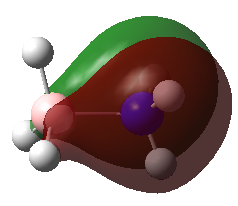
A population analysis was carried out on the BH3 molecule by running an energy calculation wih the additional keywords pop=full. The computed molecular orbitals were visualised using GaussView and compared to the molecular orbitals predicted by the MO diagram of BH3. The log files for this calculation, along with other details, can be found in the table to the left.
The MO diagram of BH3, along with the computed MOs, have been shown in the diagram below. The 'real' molecular orbitals seem to agree well with the 'LCAO' molecular orbitals, though the agreement is better for the occupied orbitals than for the unoccupied orbitals. However, as the agreement is generally good, predicting the form of the molecular orbitals via quantitative means such as drawing a MO diagram is useful.
NH3 was optimised using the 6-31G(d,p) basis set with the additional keyword nosymm. This destroys the symmetry and allows the molecule to find its lowest energy structure - useful if the point group of the molecule is unknown. The log file was checked to ensure that the forces and displacements had converged.
         Item               Value     Threshold  Converged?
 Maximum Force            0.000002     0.000015     YES
 RMS     Force            0.000001     0.000010     YES
 Maximum Displacement     0.000005     0.000060     YES
 RMS     Displacement     0.000003     0.000040     YES
 Predicted change in Energy=-9.687969D-12
 Optimization completed.

    -- Stationary point found.
Optimised N-H Bond Distance
1.018 Å
Optimised H-N-H Bond Angle
105.745°
The N-H bond distance of ammonia has been reported in literature to be 1.040 Å,[8] showing good agreement with the calculated value.
A frequency analysis was carried out on the NH3 molecule to ensure that a minimum had been found. To allow easier assignment of the symmetry of each vibration, the point group of the molecule was constrained to C3v, the known point group of ammonia. The log file for this calculation, along with other details, can be found in the table to the left.
All the low frequencies are close to zero and in the range +/- 15 cm-1.
The form, frequency and intensity of the vibrations for NH3 have been tabulated below. All the frequencies are positive, indicating that the minimum energy structure has been found.
No.
Form of the Vibration
Frequency (cm-1)
Intensity
Symmetry (C3v)
1
All three hydrogen atoms are oscillating up and down in a concerted fashion whilst the nitrogen atom oscillates slightly in the opposite direction.
1089
145
A1
2
Two of the hydrogen atoms are oscillating left and right in a concerted fashion whilst the other oscillates in the opposite direction. The nitrogen atom remains almost stationary as this occurs.
1694
14
E
3
Two of the hydrogen atoms are oscillating towards and away from each other in a scissoring motion whilst the other hydrogen atom oscillates in the opposite direction. The nitrogen atom remains almost stationary as this occurs.
1694
14
E
4
All the hydrogen atoms are oscillating towards and away from the nitrogen atom - symmetric stretching. The nitrogen atom remains completely stationary as this occurs.
3461
1
A1
5
Two of the hydrogen atoms show asymmetric stretching whilst the other remains completely stationary. This causes the nitrogen atom to oscillate slightly.
3590
0
E
6
Two of the hydrogen atoms show symmetric stretching whilst the third hydrogen oscillates in the opposite direction. The nitrogen atom oscillates slightly due to this motion.
3590
0
E
The infrared spectrum calculated for NH3 is as follows:
Two peaks were seen on the infrared spectrum even though there are six vibrations. Vibrations 4, 5 and 6 are of very low intensity so cannot be seen in the spectrum whilst vibrations 2 and 3 are degenerate and so overlap. This leaves two peaks on the spectrum - one representing vibration 1 and one representing the degenerate 2 and 3 vibrational modes.
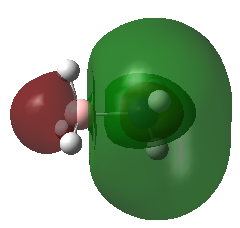
A population analysis was carried out on the NH3 molecule. The resulting MOs are similar to those calculated for BH3 and can be found in the table below:
A natural bond orbital analysis was carried out on the NH3 molecule using the log file from the population analysis calculation carried out above.
Charge Distribution
Nitrogen
-1.125
Hydrogen
0.375
From the charge distribution, it can be seen that the nitrogen is negatively charged whilst the hydrogens are positively charged. This makes sense as nitrogen is more electronegative than hydrogen and therefore pulls electron density away from the hydrogen atoms. This is supported by the results of the NBO population analysis:
       (Occupancy)   Bond orbital/ Coefficients/ Hybrids
 ---------------------------------------------------------------------------------
     4. (1.98452) BD ( 1) C   1 - N  17
                ( 33.65%)   0.5801* C   1 s( 20.78%)p 3.81( 79.06%)d 0.01(  0.16%)
                ( 66.35%)   0.8146* N  17 s( 25.00%)p 3.00( 74.97%)d 0.00(  0.03%)
In an 'ideal' covalent bond, both of the atoms would be expected to contribute 50%; however, as seen above, the nitrogen is shown to contribute 66.35% to the C-N bond, indicating that it is pulling electron density away.
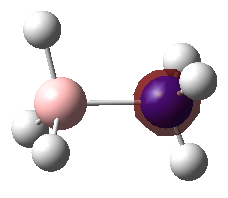
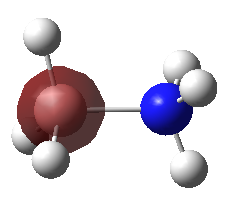
ASSOCIATION ENERGY OF NH3BH3
In order to find the association energy of ammonia borane, the energy of the reactants and products are needed. The energy of BH3 and NH3 have already been calculated above.
The molecule NH3BH3 was optimised using the 6-31G(d,p) basis set and DFT method; this method and basis set are the same as those used to optimise the NH3 and BH3 molecules above. The additional keywords int=ultrafine scf=conver=9 were also used to keep the calculation set-up the same as those used previously.
As before, the log file was checked to ensure that the forces and displacements had converged. This file, along with other details about the optimisation, can be found in the table to the left:
         Item               Value     Threshold  Converged?
 Maximum Force            0.000002     0.000015     YES
 RMS     Force            0.000001     0.000010     YES
 Maximum Displacement     0.000026     0.000060     YES
 RMS     Displacement     0.000009     0.000040     YES
 Predicted change in Energy=-8.956486D-11
 Optimization completed.

    -- Stationary point found.
A frequency analysis was carried out on the NH3BH3 molecule to ensure that a minimum structure had been found. The log file for this calculation, along with other details, can be found in the table to the left.
All the low frequencies are close to zero and in the range +/- 15 cm-1. In addition to this, all the frequencies are positive, indicating that a minimum energy structure has been found.
The energy of BH3, NH3 and NH3BH3 have been tabulated below:
Energy of Optimised BH3, NH3 and NH3BH3 (au)
NH3
BH3
NH3BH3
-26.61532364
-56.55776872
-83.22468906
The association energy is calculated by . If this calculation is done using the values above, an association energy of 0.0515967 au or 135.48 kJ/mol is obtained. This is a reasonable result as most bond energies are of the same order of magnitude.
↑K. Kawaguchi, "Fourier transform infrared spectroscopy of the BH3 v3 band", J. Chem. Phys., 1992, 96, 3411-3415.DOI:10.1063/1.461942
↑B. Réffy, M. Kolonits, M. Hargittai, "Gallium tribromide: molecular geometry of monomer and dimer from gas-phase electron diffraction", Journal of Molecular Structure, 1998, 445 (1-3), 139-148.DOI:10.1016/S0022-2860(97)00420-1
↑K-G Martinsen, N. Vogt, H. V. Volden, V. S. Lyutsarev, J. Vogt, "Molecular structure and force field of boron tribromide as determined from combined analysis of gas electron diffraction and spectroscopic data and supported by quantum-chemical density-functional calculations", Journal of Molecular Structure, 1996, 385 (3), 159-165.DOI:10.1016/S0022-2860(96)09435-5
↑ 5.05.1P. Atkins, T. Overton, J. Rourke, M. Weller, F. Armstrong, "Inorganic Chemistry", 5th Edition, 2010, Oxford University Press.
↑P. Atkins, J. de Paula, "Atkins' Physical Chemistry", 9th Edition, 2010, Oxford University Press.
↑R. V. Hoffmann, "Organic Chemistry: An Intermediate Text", 2nd Edition, 2004, John Wiley & Sons.
↑J. F. Stanton, N. S. Kadagathur, "On the equilibrium bond length of ammonia in the first excited singlet state",J. Chem. Phys., 1995, 102(2), 1096.


