Rep:Mod:inorg-pks1927project
Mini Project

Molecules of group 15 elements are Lewis bases (electron donors) due to the presence of a lone pair of electrons. The ability of R3M (where R is a ligand and M is a group 15 element) to donate its electrons depends on three things:
- The electronegativity of R
- The steric effects of R
- The group 15 element.
It is thought that as you go down the group the molecule becomes less basic. In addition, if the ligands bound to the group 15 element are highly electronegative (electron withdrawing) then the molecule becomes less basic. Finally, if the ligands surrounding the element in the molecule are very bulky they hinder the ability of the molecule to donate electrons and hence make the molecule less basic.
During this investigation, I will look at the basicity of molecules of three group 15 elements (N, P and Bi). The ligands that I will be using are H, Me, tertiary Butyl and F. Therefore I will see how steric and electronic effects affect the basicity of group 15 molecules and thus see if the above trends are in fact valid.
Method
Firstly, an optimisation was carried out on the 12 molecules that are being investigated. This was done by drawing the molecules in Gaussview and then sending an input file to the scan facility. The method and basis set used was DFT/B3LYP, LANL2DZ. The ground state geometry of some of the molecules were known, such as, ammonia adopts a trigonal pyramidal structure with C3v symmetry). However, it was unclear of how to draw some molecules, such as, the molecules containing bismuth and therefore an additional key word that was added before the calculation was run was 'nosymm'. This key word allowed the structures of the molecules to be drawn with any symmetry (trigonal planar or pyramidal) and the calculation would optimise the molecule by changing the symmetry and hence obtain the lowest possible conformer. Other additional key words were also used: ‘int=ultrafine scf=conver=9.
Once the optimisation was completed and the .log file was checked to see if the calculations did in actual fact converge, then a frequency calculation for each molecule was sent off to scan. This was done by opening the .log file obtained from the optimisation and changing the job type to frequency. The same method, basis set and additional key words were used.
Once the frequency calculations had completed, an NBO and MO calculation was run as these are the actual calculations needed to determine the basicity of the molecules. Before carrying out these calculations, the frequency calculation file was first opened in Gaussview and the vibrations were analysed before sending an input file for the NBO and MO calculation to scan. This is because if the frequencies were negative, this conveys that the molecules were not optimised and hence the optimisation had to be run again. Fortunately for all the molecules the vibrational frequencies were positive and hence there was no need to re-optimise. The NBO and MO input file was generated by opening the optimised .chk file in Gaussview and changing the job type to energy and adding the key words pop=full and clicking on the full NBO tab. Again the same method and basis set were used.
The same procedures above were also run on the adducts of the group 15 molecules (see below). The group 15 molecules were drawn with a Lewis acid (BCl3). Calculations on these adducts will convey if the basicity values of the molecules change when present in an adduct and if the geometry of the molecules change. The same Lewis acid was used to form adducts with all the Lewis bases. If this was not done then the comparisons between adducts would not be accurate. The analysis of the adducts was also carried out to find the relative energies of the Lewis bases. Overall 72 calculations were carried during this investigation.
Geometry and Symmetry
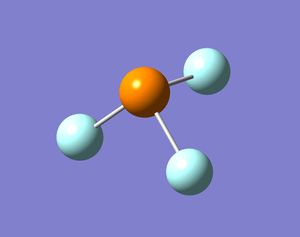
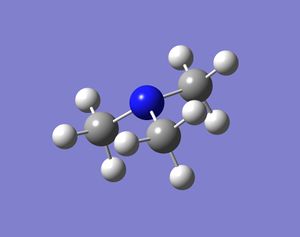
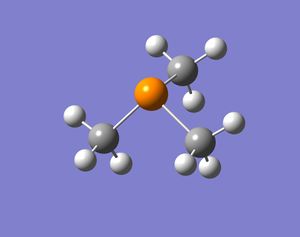
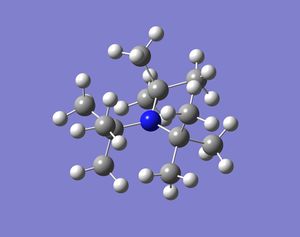
In these base molecules the central atom has four pairs of valence electrons, but only three pairs are used in bonding and hence there is a lone pair in the structure. Normally when four groups bind to the central atom in a molecule the shape of the molecule is tetrahedral and if there are three groups bound to the central atom the molecule will form a trigonal planar shape. However, in these group 15 bases, the molecules have three bonds binding to three ligands and a lone pair. The resulting structure is in between tetrahedral and trigonal planar, because the central atom is surrounded by four pairs of valence electrons, but one electron pairs is not bonded. The resulting shape should be trigonal pyramidal and the bond angles should be smaller than 109.5o (tetrahedral bond angle). This is because the lone pair occupies a larger space around the central atom compared to a bond and hence pushes the three bonds closes together. When the molecules were optimised the resulting structures were all pyramidal (bent) in shape. Some molecules were more bent than others, but the structures produced confirmed what was expected.
As stated above, all the structures were found to be bent, but it is expected that the molecules will be less bent with bulkier ligands and hence have a less acute bond angle. The bond lengths should increase as the central atom of the molecule changes and the R groups remain the same. This is because when going down group 15, the atomic radius of the element becomes bigger. In addition, the bond lengths should also be longer when bulkier ligands are used. This is because they will not be able to be as close to the central atom as smaller ligands due to steric effects.
It is also thought that molecules with the same ligand but different group 15 elements will change shape. When going down the group the molecules will become more bent. This is because the lone pair will push the bonds around the central atom as much as possible, but the bonds will resist if they become too close to one and other (sterics). Bismuth is much bigger than nitrogen and hence the bonds can be pushed much more by the lone pair in bismuth and the bonds will be fairly close together. The results are shown below:
| Bond Length/Å | Bond Angle/o | |
|---|---|---|
| NH3 | 1.01 | 117.1 |
| PH3 | 1.44 | 94.0 |
| BiH3 | 1.78 | 90.3 |
| Bond Length/Å | Bond Angle/o | |
|---|---|---|
| NF3 | 1.45 | 101.7 |
| PF3 | 1.71 | 96.3 |
| BiF3 | 1.99 | 96.3 |
| Bond Length/Å | Bond Angle/o | |
|---|---|---|
| NtBu3 | 1.54 | 118.8 |
| PtBu3 | 2.00 | 107.0 |
| BitBu3 | 2.33 | 102.6 |
| Bond Length/Å | Bond Angle/o | |
|---|---|---|
| NMe3 | 1.47 | 112.9 |
| PMe3 | 1.91 | 98.6 |
| BiMe3 | 2.25 | 93.96 |
 |
 |
 |
 |
 |
|---|
 |
 |
 |
 |
 |
|---|
 |
 |
|---|
The bond length values show the trend that was expected. The bond length increased when the central atom was changed from nitrogen to phosphorous and then to bismuth. This trend was seen with all four R groups used.
The bond length also increased as the R groups became bulkier, which is expected because the bigger the R group the further away it is from the central atom of the molecule and hence the bond is longer.
The bond angles recorded did show the expected trend, which is that as the R groups become bigger the molecule becomes less bent and hence the bond angle increases. The angles recorded also show that as the central atom of the molecule increases in size, the bond angle decreases. However, there were a few anomalies in the bond angles that were recorded. Firstly, the bond angle in BiF3 is supposed to be smaller than the bond angle in BiMe3, but it is not. In addition, the bond angle in NH3 is supposed to be smaller than the bond angle in NF3 and again this is not shown in the results. The reason for these anomalies could be due to second order Jahn Teller distortions, or due to the fact that the basis set used is very poor. This basis set had to be used in order to analyse the Bi molecules, but it has a pseudo basis set, which may make the results recorded for the nitrogen and phosphorous molecules slightly inaccurate as these elements do not need be analysed with a pseudo potential (their core electrons should be included in the calculations).
MO Analysis
| Molecule | Energy of HOMO/eV | Energy og LUMO/eV |
|---|---|---|
| NH3 | -0.22766 | 0.09804 |
| PH3 | -026962 | 0.03942 |
| BiH3 | -0.27462 | 0.00066 |
| NF3 | -0.39432 | -0.09983 |
| PF3 | -0.37923 | -0.07673 |
| BiF3 | -0.36038 | -0.07841 |
| NMe3 | -0.19402 | 0.10226 |
| PMe3 | -0.22230 | 0.6190 |
| BiMe3 | -0.22713 | 0.01114 |
| NtBu3 | -017315 | 0.09402 |
| PtBu3 | -0.20007 | 0.06311 |
| BitBu3 | -0.20131 | 0.01939 |
MO analysis is one of the key aspects to identify the basicity trends within the molecules being analysed. This is because the molecules have a lone pair of electrons which are located in the HOMO of the molecule. If the HOMO is high in energy then it will overlap better with the LUMO of any incoming Lewis acid. The LUMO of the Lewis acid will be high in energy and so if the HOMO of the Lewis bases being studied is high then these bases will be able to donate their lone pair to the acid easily as the HOMO-LUMO gap will be small. The interaction between the HOMO of the base with the LUMO of the acid will be very stronG, if the MOs are similar in energy.
As discussed above, the basicity of the molecules should decrease when going down group 15, which means that when the central atom of a molecule is changed from nitrogen to phosphorous to bismuth the basicity will decrease. Therefore the HOMO of bismuth molecules should be lower in energy than the HOMO of nitrogen and phosphorous molecules (note the molecules have to have the same R groups in order for the comparison to be accurate).
In addition, molecules with varying ligands but the same central atom must change in basicity. The bulkier the group the more hindered the base and hence the energy of the HOMO of the molecule will be low. The more electronegative a group the less basic the molecule will be and hence the HOMO will be low in energy. Therefore it is expected that the HOMO of the molecules with R=H to have high energy HOMOs compared to the HOMOs of the molecules with R=Me, tBu and F.
The results show some of the trends expected, but also show trends which are opposite to the trends expected. The results show that when changing the central atom for molecules with the R group being H, Me and tBu, the energy of the HOMO decreases. However, the opposite trend is shown for the molecules with F as the R group. The latter could be true, but considering that three out of the four different types of R groups used show that when the central atom is changed from N to P to Bi the basicity of the molecule decreases (energy of HOMO decreases) then it is more likely that this trend is true.
The results convey that molecules with F as the R group have lower energy HOMOs compared to the HOMOs of the molecules with the R group being H and hence this proves that the more electronegative the R group is the less basic the molecule becomes.
Unfortunately, the results obtained show the opposite trend for how steric effects affect the basicity of group 15 molecules. It was expected that the molecules with tBu ligands will have a lower energy HOMO than the molecules with Me ligands and that these molecules would have a lower energy HOMO compared to the molecules with H ligands. However, the opposite has happened and it shows that the bulkier the ligand, the higher the energy of the HOMO and thus the molecule is more basic.
This trend could be true and our thinking could be false, but the likely chances are that the results are incorrect. This does not mean that the molecules were not optimised properly or that the calculations carried out are wrong, as care was taken to make the input files and the frequency analysis of all molecules gave positive values and hence optimisation occurred successfully. The reason for these strange results is due to the fact that a poor basis set was used, which has a low accuracy. This basis set had to be used in order to able to analyse bismuth molecules. A better basis set could have been used, but only N and P would have been analysed and hence looking at the trends going down group 15 would not have been possible.
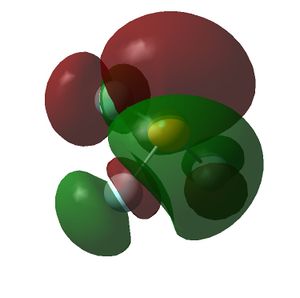
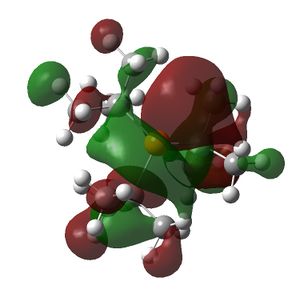
As an aside, these molecules can be Lewis acids (excluding nitrogen) because they have low lying d orbitals which can be seen on the MO diagrams (see LUMOs). For the molecule to be acidic it has to be able to accept electrons into its LUMO and hence the lower the energy of the LUMO the better the Lewis acid it is. The energies of the LUMOs for the P and Bi molecules with H and F as R groups show that as you go down group 15 the molecule becomes more acidic because the LUMOs decrease in energy. This trend is not clearly shown in the molecules with Me and tBu as the R groups.
The results also show that the LUMO increases in energy as the R group becomes bulkier, thus showing that as the ligand gets bigger the molecule will be less likely to accept electrons and hence it is less acidic. Finally, it is also conveyed that the more electronegative the R group the lower the energy of the LUMO of the molecule and hence the more acidic molecule is. All these trends are expected and hence computational analysis works very well when looking at the acidic nature of molecules.
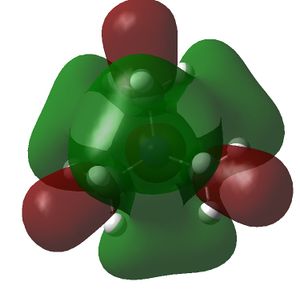
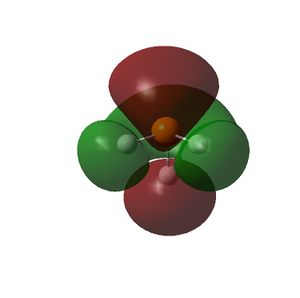
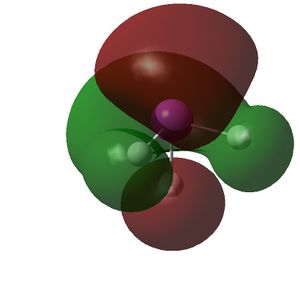
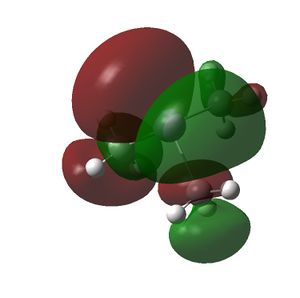
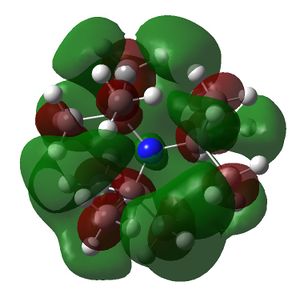
The HOMO and LUMOs of all the molecules are shown below and it can be seen that the HOMOs have a lot of electron density around the central atom, which is expected as the molecule has a lone pair of electrons, which are donated to a Lewis acid.
| Molecule | HOMO | LUMO | Molecule | HOMO | LUMO |
|---|---|---|---|---|---|
| NH3 | 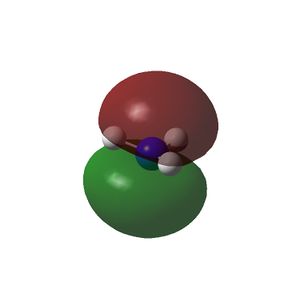 |
 |
NMe3 | 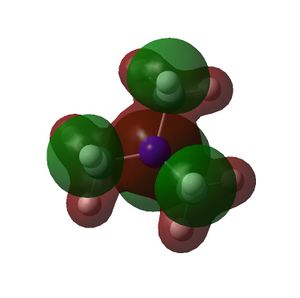 |
 |
| PH3 | 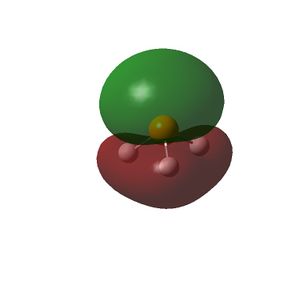 |
 |
PMe3 |  |
 |
| BiH3 | 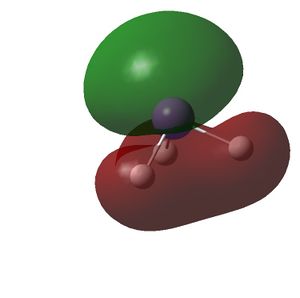 |
 |
BiMe3 | 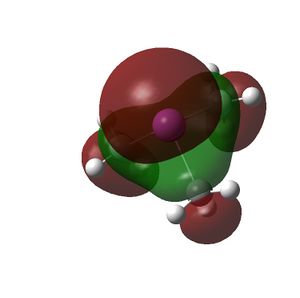 |
 |
| NF3 | 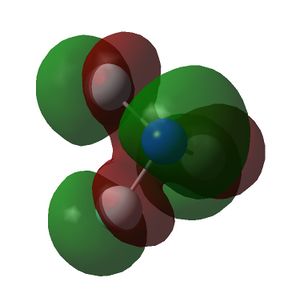 |
 |
NtBu3 | 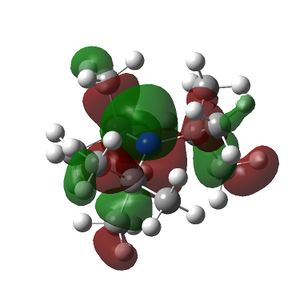 |
 |
| PF3 | 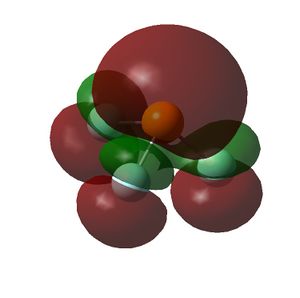 |
 |
PtBu3 | 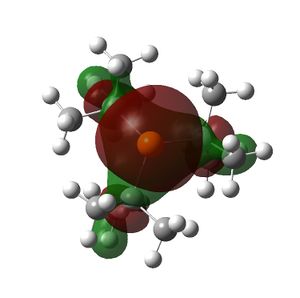 |
 |
| BiF3 | 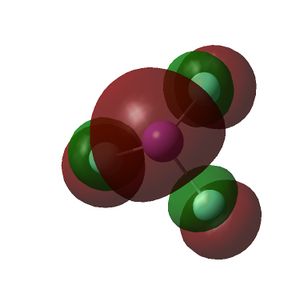 |
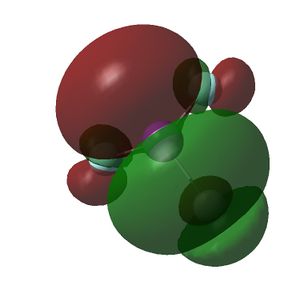 |
BitBu3 | 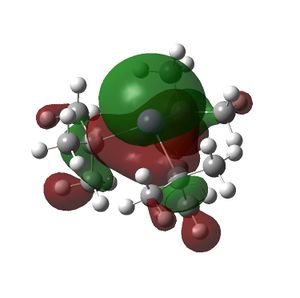 |
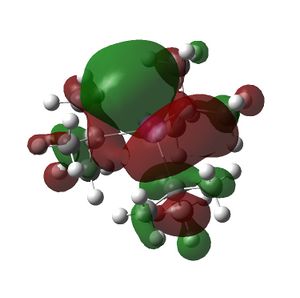 |
NBO Analysis
| Molecule | Charge on Central Atom |
|---|---|
| NH3 | -1.168 |
| PH3 | 0.044 |
| BiH3 | 0.283 |
| NF3 | 0.648 |
| PF3 | 1.708 |
| BiF3 | 2.029 |
| NMe3 | -0.519 |
| PMe3 | 0.738 |
| BiMe3 | 1.212 |
| NtBu3 | -0.665 |
| PtBu3 | 0.703 |
| BitBu3 | 1.232 |

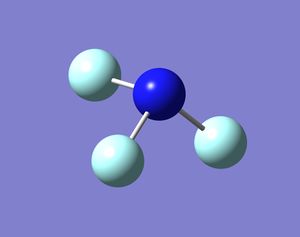
NBO analysis is another useful technique to see how basicity changes in molecules. This analysis produces the charge values of the atoms in a molecule and colours the atoms according to charge (green is for positive charge and red is for negative charge). See table for results.
The bigger and more positive the charge number on the central atom, the less basic the molecule is because the electron density around the central atom is poor and more delocalised. It can be seen that as the central atom is changed from a small group 15 element to a large group 15 element, the value of the charge increases and becomes positive, which indicates that molecules made from elements further down group 15 are less basic. The values also increase when a bulkier ligand is present in the molecule. In addition, when the R groups become more electronegative the central atom charge becomes more positive (see values for molecules with F as R group). These results prove the trends stated at the beginning of the project and hence NBO analysis is successful in dertermining how basicity changes within molecules, even with a poor basis set.
The only strange part of the results is that the charge on the central atoms of each molecule are very rarely negative. If the central atom has a lone pair to donate to an acid, surely the central atom should have a negative charge and hence the trends would be that the charge on the central atom becomes less negative, as the molecule becomes less basic. The reason for positive charges to be present on the central atom is because relative to the other atoms in the molecule, the central atom may be more positive than them. For example, the central atom in the molecules with F as the R group all have positive charges, and the F atoms have negative charges. This is because the F atoms are highly electronegative and thus will have a negative charge. The central atoms have a positive charge because they are less negative than the F atoms, but the positive charge does not mean that they do not have any electrons to donate. The charges on the atoms in the molecule can be added together and the value obtained is zero, which is expected as the molecules are neutral.
The NBO analysis also conveys other useful information such as the which atom contribute the most to a bond, for example, in PH3 49.28% of the bond is formed from the P orbitals and 50.72% is formed from the H orbitals. The hybridisation of the orbitals can also be found, for example in PH3, the P orbitals that contribute to the bond are sp3 hybridised. Finally, the occupancy of orbitals can be found, for example, the Pz valence orbital of P in PH3 has an occupancy of 0.932. However, the most important imformation for this investigation is the charge of the atoms in the molecule.
Part 2-Adducts
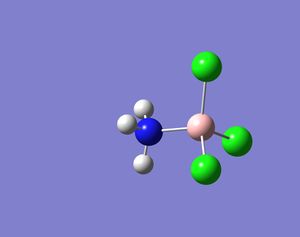
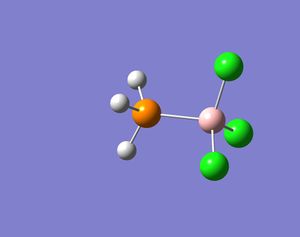
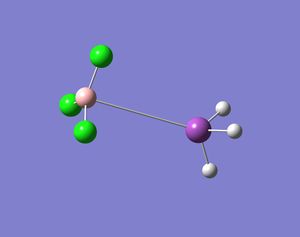
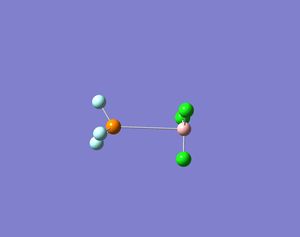
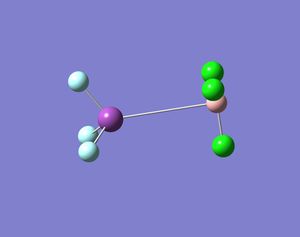
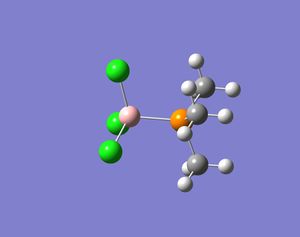
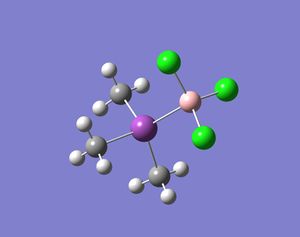
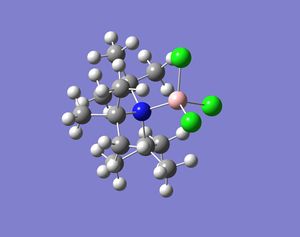
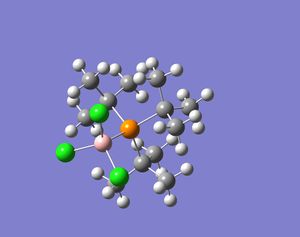
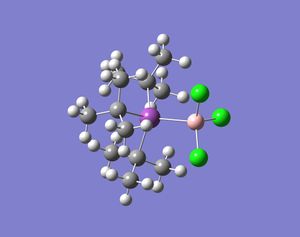
These molecules under investigation are Lewis bases and hence will donate the lone pair of electrons to a Lewis acid and thus form an adduct. In this part of the investigation the molecules were drawn as part of an adduct with BCl3 (Lewis acid) and the same calculations were carried out as above on these adducts. In addition, the same method and basis set were used in order to work out relative energies (see below). BCl3 was also drawn on its own and optimised and frequncy, NBO and MO calculations were carried out on it. The optimised BCl3 structure had a B-Cl bond length of 1.78Å, the Cl-B-Cl bond angle was found to be 120o and the molecule was trigonal planar in structure. In part one of this module the bond angle and length was found for BCl3 using a different basis set (LanL2MB) and the angle matches the one generated here but the bond length obtained here is smaller by 0.9Å. This just proves that using different basis sets gives different answers to the same problem and thus values should never be compared if different basis sets are used. The literature value for the B-Cl bond length is 1.72Å and hence as the value obtained here in this investigation is a better match than the value obtained in the previous part and thus the basis set being used here is not totally inaccurate.[1]
The following results were obtained:
| Molecule Bound to BCl3 | Lewis Base Bond Angle/o | Lewis Base Bond Length/Å | Bond Length of Adduct/Å | Cl-B-Cl Bond Angle/o | B-Cl Bond Length/Å |
|---|---|---|---|---|---|
| NH3 | 109.9 | 1.03 | 1.63 | 113.4 | 1.89 |
| PH3 | 103.6 | 1.42 | 2.08 | 113.6 | 1.88 |
| BiH3 | 90.7 | 1.78 | 4.74 | 120.0 | 1.79 |
| NF3 | 101.8 | 1.45 | 3.46 | 120.0 | 1.79 |
| PF3 | 96.3 | 1.71 | 4.17 | 120.0 | 1.79 |
| BiF3 | 96.4 | 1.99 | 4.28 | 120.0 | 1.79 |
| NMe3 | 108.3 | 1.52 | 1.65 | 110.7 | 1.90 |
| PMe3 | 107.5 | 1.86 | 2.02 | 112.4 | 1.90 |
| BiMe3 | 102.4 | 2.21 | 2.43 | 113.6 | 1.89 |
| NtBu3 | 110.1 | 1.72 | 1.75 | 103.4 | 1.94 |
| PtBu3 | 109.5 | 2.00 | 2.10 | 108.9 | 1.91 |
| BitBu3 | 108.2 | 2.31 | 2.41 | 111.5 | 1.91 |
As shown by the results the Lewis bases are still bent in these adduct structures, but it was thought that as the lone pair is used to bind to the Lewis acid, the bond angle of the Lewis bases in these adducts would increase and hence the base would beome less bent. This is because lone pairs occupy more space around the central atom compared to the electrons in a bond and hence the R groups would not be pushed together as much in the adduct compared to the R groups in the base not bond to an acid. This was seen in the bond angle values obtained for the Lewis bases that had P and Bi as the central atom. The bond angles increased for these molecules when they formed an adduct compared to the angles otained form the bases unbound (see table in previous section).
However, another idea is that the bond angles within the lewis base of the adduct could be smaller than the bond angles of the base not bound to an acid. This is because the acid bound to the base is a bigger entity than a lone pair and hence will push the R groups in the molecule closer together. This is conveyed by the bond angles of the molecules containg N as the central atom. The results obtained support both theories and hence the results do not help to identify which idea is correct and actually occurs. The theory that is most probable is the first one. This is because the basis set used includes a pseudo potential which reduces the accuracy of the data obtained for nitrogen containing molecules, as the pseudo potential is not a good approximation to use for N.
The bond lengths of the Lewis base stay roughly the same when bound to the acid compared to the bond lengths in an unbound molecule. The bond connecting the base and the acid together in the adduct varies with differnt bases. It is expected that as the base becomes more hindered and less basic, the bond length increases as the interaction between the acid and base will weaken. Looking at the data it shows that the bond length increases when the central atom of the base in the adduct is changed from nitrogen to phosphorous and then to bismuth (R groups are kept the same). This shows that the basicity decreases as you go down group 15.
Looking at the adducts formed with bases with Me and tBu as the R groups show that the bond length between the acid and base increases as the R groups gets bulkier and hence the basicity of the molecules reduces as the ligand gets bigger. But this is contradicted by the values obtained for the adducts with the base molecules having H as the R group. The bond lengths obtained for these adducts are larger than the values obtained for the adducts with the base having Me as the R group. Again this is due to the basis set being used is not very accurate. However, the anomaly could be due to the fact that the Me groups are electron donating ligands and hence donate electrons to the central atom and thus the electron donating ability of the Me groups has out weighed the steric effects of the groups and this may have caused these molecules to be more basic and hence the bond length decreases between the acid and the base in the adduct.
The results also show that as the electronegativity of the R groups on the base increases, the basicity of the base decreases and hence the bond connecting the acid and base increases. This is because the interaction between the base and acid is weak. This is seen by looking at the molecules with F and H as the R group.
Finally, the bond angle and bond length of the BCl3 molecule in the adduct varies from the optimised values (stated above). This is because the closer the base is to the acid the more steric hindrance it will experience and thus adjust its bond lengths and bond angles to reduce the steric hindrance. The results show that the closer the base is to the acid in the adduct the longer the B-Cl bonds become and the smaller the Cl-B-Cl angle becomes (BCl3 becomes more bent). This is expected because the Cl atoms are trying to move away from the base in order to reduce steric clash. The results also show that the bulkier the ligands the more the B-Cl bond length increases and the Cl-B-Cl bond angle decreases, which is again due to steric hindrance.
Energy
The energies of the unbound bases, the adducts and unbound BCl3 were obtained from the optimisation of each molecule, but these values cannot be compared to one and other. Therefore the relative energies for the association of the acid base pairs were found and these relative energies can be compared.
To find the energy of association of an acid base pair, the energy of the base unbound plus the energy of the acid unbound were subtracted from the energy of the adduct. Here are the results below:
| Base | Energy of Adduct (Base-BCl3)/a.u. | Energy of Unbound Base Plus Unbound BCl3/a.u. | Energy Difference/a.u. | Energy Difference/kJmol-1 |
|---|---|---|---|---|
| NH3 | -126.3855 | -126.3278 | -0.0577 | -151.49 |
| PH3 | -78.0610 | -78.0493 | -0.0117 | -30.72 |
| BiH3 | -76.9902 | -76.9902 | 0 | 0 |
| NF3 | -423.8843 | -423.8838 | -0.0005 | -1.31 |
| PF3 | -375.8635 | -375.8636 | 0.0001 | 0.26 |
| BiF3 | -374.8842 | -374.8846 | 0.0004 | 1.05 |
| NMe3 | -244.2830 | -244.2218 | -0.0612 | -160.68 |
| PMe3 | -196.0424 | -196.0011 | -0.0413 | -108.43 |
| BiMe3 | -194.9503 | -194.9438 | -0.0045 | -11.81 |
| NtBu3 | -597.9084 | -597.9161 | 0.0077 | -20.22 |
| PtBu3 | -549.7578 | -549.7212 | -0.0366 | -96.09 |
| BitBu3 | -548.6736 | -548.6915 | -0.0179 | -47.00 |
The results show that for the bases with R being H, Me and F, the formation of the adduct becomes harder when the central atom is changed from N to Bi. This is because the association energy of forming the acid base pair becomes less negative and in some cases positive. The more negative the association energy, the more stable the adduct is compared to the energy sum of the unbound molecules and hence the more likely it is that the adduct will form. Therefore this proves that going down group 15 the basicity of the molecules decreases. This trend is contradicted by the adducts formed from bases with tBu as the R group.
The results also convey that when a more electronegative R group is present in the base molecule, the formation of the adduct becomes harder because the energy difference values become less negative (see results for the molecules with R=F). The data also portrays that as the R group of the base becomes bulkier, the easier it is to form the acid-base adduct, which is oposite to what is expected.
The anomalies in the results could be true, but it is likely that the results obtained are incorrect. The reason for such poor results, is that the error on the energy values is 10 kJmol-1, which is approximately 0.004 a.u., which is bigger than some of the association energy values. Thus the energy difference values could have been distorted by this huge error value and hence strange results may have been produced.
 |
 |
 |
 |
 |
|---|
 |
 |
 |
 |
 |
|---|
 |
 |
|---|
NBO Analysis of Adducts
| Adduct | Charge on Group 15 Atom | Charge on B atom |
|---|---|---|
| NH3-BCl3 | -1.039 | 0.497 |
| PH3-BCl3 | 0.390 | 0.181 |
| BiH3-BCl3 | 0.512 | 0.456 |
| NF3-BCl3 | 0.635 | 0.421 |
| PF3-BCl3 | 1.708 | 0.428 |
| BiF3-BCl3 | 2.030 | 0.395 |
| NMe3-BCl3 | -0.604 | 0.564 |
| PMe3-BCl3 | 1.116 | 0.165 |
| BiMe3-BCl3 | 1.730 | 0.033 |
| NtBu3-BCl3 | -0.713 | 0.623 |
| PtBu3-BCl3 | 1.007 | 0.198 |
| BitBu3-BCl3 | 1.784 | 0.003 |
Again NBO analysis was used to see how the basicity of the group 15 molecules changed as the ligands and central atoms are changed. The following table of results on the left was generated.
The results show the expected trends (stated at the beginning of the project). As the charge on the group 15 atom becomes more positive the less basic it becomes. The only strange part of the results is that for adducts which contained bases that did not contain N, showed that the group 15 atom in the base molecule had a bigger positive charge than the charge on the boron atom of the acid part of the adduct. This is alarming because it suggests that the boron is more basic than the central atoms in the base part of the adduct. This could be true as we already have seen that as you go down group 15, the elements become less basic and have the ability to act as acids due to thier low lying d orbitals. Therefore, the molecules in the adducts of lower group 15 elements could have swapped roles with BCl3 and become the acid part of the adduct. However, the BCl3 does not have electrons to donate and thus cannot suddenly become a base, thus the inaccuracy of the basis set has caused these strange results to occur.
The charge on the group 15 atoms in the adducts have changed from the results obtained for the charge on the group 15 atoms in the unbound bases (see above). The change has no particular trend as some values have increased, some have stayed same and some have decreased.
Frequency Analysis
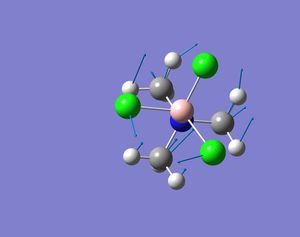
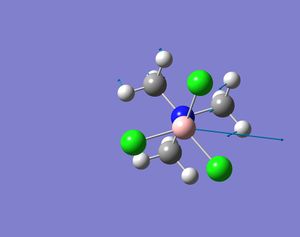
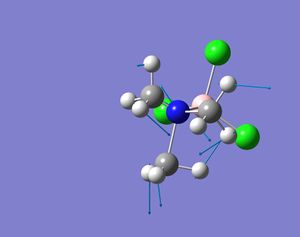
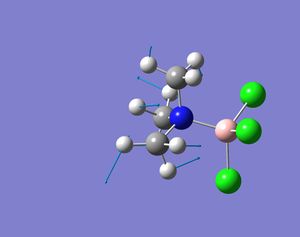
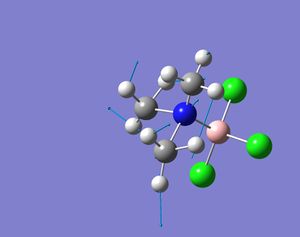
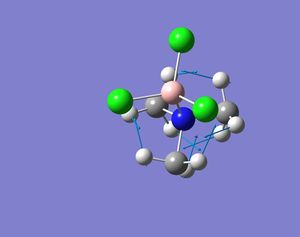
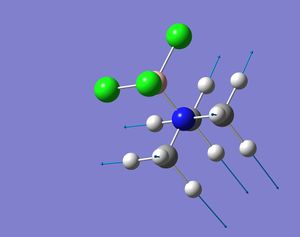
Frequency calculations were carried out on the adducts and unbound Lewis bases, but the data obtained from these calculations cannot explain the basicity of the molecules under consideration. The major point of carrying out the frequency calculations was to see if the optimisation calculations worked. As no negative frequencies were obtained for any of the molecules being studies, it is safe to say that all the structures obtained were in the lowest energy configuration. The frequency calculations also enables to see what vibrations that occur in the molecules and how the IR spectrum of the molecules would look. Here is an IR spectrum obtained (NMe3-BCl3), with analysis of the vibrations within the molecule:
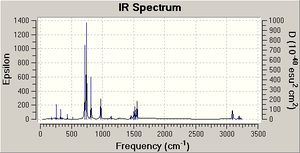
The B-Cl vibrations of this adduct all have lower frequencies than the B-Cl vibrational frequencies in unbound BCl3 (see literature for values or section one of module[2]). The reason for this is because when BCl3 binds to NMe3 the B-Cl bond length increases (see above for bond length values), thus the bonds are weaker and hence vibrate at a lower frequency. These lower frequency vibrations were seen in all the adducts which caused the B-Cl bonds to increase in length. Again, the B-Cl bond lengthened when bound to a base because the Cl atoms wanted to reduced the steric hindrance experienced. The adducts that show this lengthening of the B-Cl bond and thus the lower frequencies are the ones which contain bases which have bulky ligands and big group 15 elements (see above results). Finally, it has to be noted that in each frequency analysis of each molecule, the characteristic frequencies of that molecule were present, for example, the molecules with Me and tBu groups had C-H stretch frequencis present in the frequency analysis and NH3 had the expected N-H stretch frequency present in the frequency analysis data. Therefore, it can be stated that the frequency calculations were carried out correctly and on the correct molecule. The frequencies for these characteristic vibrations did not change when the adduct was formed because as shown above the bond lengths of the base did not change when bound to an acid.
Full MO Analysis

MO analysis was carried out on every molecule, but the HOMO and LUMO of each unbound base molecule was of more interest than the other MOs. This is because these MOs, especially the HOMO determine the basicity of the molecule (see above for discussion). However, for completeness the MO diagram for PH3 has been drawn and the LCAOs are also present in the diagram. Along side the LCAOs are the computationally generated MOs. The MOs and LCAOs look very similar and hence MO theory is fairly accurate at predicting what MOs look like. The position of the 4a1' and 2e levels was uncertain, but the MOs generated computationally cleared up this problem as the highest energy MO was not degenerate.
In addition, some of the HOMOs generated for the adducts looked different to the HOMOs of their unbound base counterparts. This is expected as the MOs of the adducts are now made from the MOs of the base and BCl3. The HOMOs of the adducts generally had a lot of electron density around the Cl atoms of the acid. Some HOMOs of the adducts had a lot of electron density around the group 15 element, which is just like the HOMOs of the unbound bases.
Conclusion
Overall this investigation was a success because all the trends were seen in various data recorded. Unfortunately some contradictions to the purposed theory did appear and this is due to the low accuracy of the basis set used. This basis set had to be used in order to analyse Bi atoms, but the basis set includes pseudo potentials which causes the analysis of N and P atoms to be inaccurate. A better basis set could be used, such as, G-311 + G(d,p), but Bi would not be able to be analysed and hence seeing how basicity changes down group 15 would not be possible.
Unfortunately, due to time constraints the new basis set could not be used on the N and P molecules being analysed, which would have been interesting to do because it could have been seen if the values obtained for bond angles and lengths change significantly by using this better basis set. In addition, by using the new basis set a deduction could have been made about which basis set is in actual fact the better one by comparing the results generated with literature values.
Improvements to this investigation would be to include dAO functions into the input files for the P and Bi molecules as these atoms have low lying dAOs which are not considered by the minimal basis set used. Furthermore, the elements As and Sb could be added to the investigation as they are also part of group 15 and hence to get a comprehensive idea about the basicity of group 15 molecules they need to be included. Finally, different R groups can be investigated, such as, Cl, Br, I and longer and bulkier organic groups, which will enable us to see in more depth how steric and electronic effects affect the basicity of group 15 elements. Again due to time constraints this was not carried out.
Moreover, I feel that the NBO analysis conclusively proved the statements at the beginning of the projects, whether adducts or unbound molecules were being considered. MO analysis was not as helpful, but overall most of the theories were backed with this analysis. The geometry and energy data was a little off for certain molecules, but again this was probably due to the basis set used and the errors in the calculations being significantly large.
References
- ↑ O. Brieux de Mandirola, Spectrochimica Acta, 1967, 23A, 4, 767. DOI:10.1016/0584-8539(67)80004-7
- ↑ O. Brieux de Mandirola, Spectrochimica Acta, 1967, 23A, 4, 767. DOI:10.1016/0584-8539(67)80004-7
Data Files
- BitBu3 opt-DOI:10042/to-3801
- NtBu3 opt-DOI:10042/to-3803
- NF3 opt-DOI:10042/to-3804
- PtBu3 opt-DOI:10042/to-3805
- PF3 opt-DOI:10042/to-3848
- BiF3 opt-DOI:10042/to-3849
- BiMe3 opt-DOI:10042/to-3850
- NMe3 opt-DOI:10042/to-3851
- PMe3 opt-DOI:10042/to-3852
- PH3 opt-DOI:10042/to-3853
- NH3 opt-DOI:10042/to-3854
- BiH3 opt-DOI:10042/to-3855
- NH3 freq-DOI:10042/to-3856
- PH3 freq-DOI:10042/to-3857
- BiH3 freq-DOI:10042/to-3858
- BitBu3 freq-DOI:10042/to-3859
- BiF3 freq-DOI:10042/to-3860
- BiMe3 freq-DOI:10042/to-3861
- NtBu3 freq-DOI:10042/to-3862
- NF3 freq-DOI:10042/to-3863
- NMe3 freq-DOI:10042/to-3864
- PtBu3 freq-DOI:10042/to-3865
- PF3 freq-DOI:10042/to-3866
- PMe3 freq-DOI:10042/to-3867
- BitBu3 pop-DOI:10042/to-3868
- BiF3 pop-DOI:10042/to-3869
- BiH3 pop-DOI:10042/to-3870
- BiMe3 pop-DOI:10042/to-3871
- NtBu3 pop-DOI:10042/to-3872
- NF3 pop-DOI:10042/to-38673
- NH3 pop-DOI:10042/to-3874
- NMe3 pop-DOI:10042/to-3875
- PtBu3 pop-DOI:10042/to-3877
- PF3 pop-DOI:10042/to-3878
- PH3 pop-DOI:10042/to-38679
- PMe3 pop-DOI:10042/to-3880
- BitBu3-BCl3 opt-DOI:10042/to-3881
- NH3-BCl3 opt-DOI:10042/to-3883
- PtBu3-BCl3 opt-DOI:10042/to-3884
- BCl3 opt-DOI:10042/to-3885
- PH3-BCl3 opt-DOI:10042/to-3886
- PMe3-BCl3 opt-DOI:10042/to-3887
- NMe3-BCl3 opt-DOI:10042/to-3888
- NtBu3-BCl3 opt-DOI:10042/to-3889
- BitBu3-BCl3 freq-DOI:10042/to-3890
- NH3-BCl3 freq-DOI:10042/to-3892
- NMe3-BCl3 freq-DOI:10042/to-3893
- BCl3 freq-DOI:10042/to-3894
- PtBu3-BCl3 freq-DOI:10042/to-3895
- PH3-BCl3 freq-DOI:10042/to-3896
- PMe3-BCl3 freq-DOI:10042/to-3906
- BiF3-BCl3 opt-DOI:10042/to-3915
- NF3-BCl3 opt-DOI:10042/to-3899
- NF3-BCl3 freq-DOI:10042/to-3900
- BiH3-BCl3 opt-DOI:10042/to-3901
- BiH3-BCl3 freq-DOI:10042/to-3902
- BCl3 pop-DOI:10042/to-3903
- BitBu3-BCl3 pop-DOI:10042/to-3904
- BiH3-BCl3 pop-DOI:10042/to-3905
- NF3-BCl3 pop-DOI:10042/to-3907
- NtBu3-BCl3 pop=DOI:10042/to-3908
- NMe3-BCl3 pop-DOI:10042/to-3909
- NH3-BCl3 pop-DOI:10042/to-3910
- PtBu3-BCl3 pop-DOI:10042/to-3911
- PH3-BCl3 pop-DOI:10042/to-3912
- PMe3-BCl3 pop-DOI:10042/to-3913
- BiMe3-BCl3 opt-DOI:10042/to-3914
- BiMe3-BCl3 freq-DOI:10042/to-3916
- BiF3-BCl3 pop-DOI:10042/to-3917
- BiMe3-BCl3 pop-DOI:10042/to-3918
- PF3-BCl3 pop-DOI:10042/to-3919
- NtBu3-BCl3 freq-DOI:10042/to-3920

