Rep:Mod:inorg-pks1927
Module 2 - Computational Chemistry Lab
Introduction
Computational chemistry is very useful as it can help scientists understand the structure and bonding of compounds. Organic molecules are fairly straight forward and hence computational chemistry may not increase our understanding of the structures and bonding of organic molecules. However, inorganic complexes are very complex and hence computational chemistry is very useful and enhances our knowledge of their structures.
Transition states and activated complexes can be studied in depth by using computational chemistry. These molecules cannot be studied experimentally because they are very reactive, short lived and unstable and hence hard to isolate and cannot be characterised by spectroscopic methods. Computational chemistry also enables scientists to analyse the stability of isomers and determine the kinetics of a reaction, by determining the energy of the transition state (barrier height). Many pieces of information about reactants, products or even transition states can be obtained computationally, for example, NMR, IR, Ramen spectra, dipole moments and MO diagrams.
Understanding Optimisation
By using the Born-Oppenheimer approximation, the Schrodinger equation is solved to find energy of a molecule, which is dependent on the position of the nuclei in that molecule. When the positions of the nuclei are changed, the energy of the molecule will also change, as the attractive and repulsive forces within the molecule will change. If the nuclei are far apart then the attractive forces will decrease and the energy of the molecule increases and the molecule will dissociate. When the nuclei are close together then the energy increases due to repulsive forces. There is an equilibrium point where the nuclei are in such a position where there are no forces acting on the molecule and hence nothing will cause the nuclei to move from their position. This point is the ground state energy or stable point of the molecule.
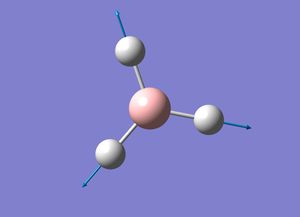
During the optimisation of the BH3 the computer solves the Schrodinger equation for the molecule, where the positions of the nuclei have been fixed. The energy of the molecule is found form this calculation. The positions of the nuclei are then moved and the energy is found again for the molecule by solving the Schrodinger equation again. If the new energy found is lower than the first energy value obtained then the computer will continually change the position of the nuclei in this direction until an energy minimum is obtained. This process will produce a potential energy surface for the BH3 molecule. A potential energy surface is known to have a minimum point and at this point the gradient or differential is zero.
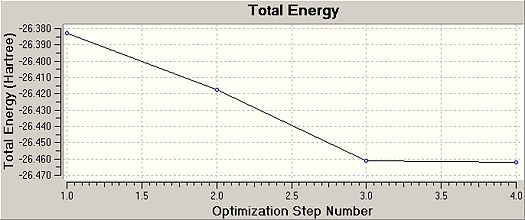
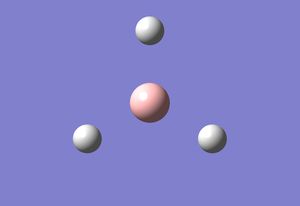
The graphs obtained from Gaussview after the optimisation of BH3 show how the total energy of the molecule changed during the optimisation process (see graph on the right). This graph shows that the energy of the BH3 was continually decreasing as the positions of the nuclei were changed until a minimum point was reached. During the optimisation of the BH3 molecule the positions of the nuclei were changed four times until the stable configuration was found. The graph on the left shows how the RMS (root mean square) gradient changed during the optimisation. The RMS gradient continually decreased until it reached to zero.

| First Optimised Structure | Second Optimised Structure | Third Optimised Structure | Final Optimised Structure |
|---|---|---|---|
 |
 |
 |
 |
BH3 Optimisation

| Bond Length/Å | 1.19 |
| Bond Angle/o | 120.0 |
| Charge | 0 |
| Spin | Singlet |
| Final Energy/a.u. | -26.4622 |
| RMS Gradient/a.u. | 0.0002 |
| Dipole Moment/D | 0.00 |
| Point Group | D3h |
A BH3 molecule was drawn in Gaussview and the initial BH bond length was 1.18Å and the H-B-H bond angle was 120.0o. However, the bond length was changed manually to 1.50Å and the bond angle remained unchanged before optimisation was carried out.
The optimisation of the modified BH3 was carried out by using the DFT/B3LYP method and the 3-21G basis set. The optimisation calculation is used to determine the optimum positions of nuclei in a molecule (see above for explanation). The method used sets the approximations needed to be made to solve the Schrodinger equation and the basis set determines the accuracy of the calculation. The bigger the basis set, the higher the accuracy, but the longer it takes for the calculation to be processed by the computer. The basis set used in this optimisation is small and hence has a low accuracy, but the calculations were able to be run on the lap top and there was no need for the calculations to be sent to scan. The optimisation took 10 seconds to run and produced the results in the table on the left.
The literature value for the bond length of BH3 is 1.189Å and the literature value for the H-B-H angle is 120.0o.[1] These literature values are very close to the values obtained for the optimised BH3 molecule and hence indicate that the optimisation has occurred successfully. The RMS gradient value also proves that the optimisation has taken place as the value is very small and near to zero, which is expected (see above for explanation). The .log file that was obtained from the optimisation also suggests that the calculations were completed correctly and thus an optimised structure of BH3 has been obtained. This is because a section of the file stated that the forces (gradient of the energy vs distance graph) and the displacements had converged. This means that for small changes in the positions of the nuclei in the BH3 molecule recorded, the energy does not change. The output .log file for the optimisation of the BH3 molecule can be found here: https://www.ch.ic.ac.uk/wiki/images/1/10/PRABHJOT_BH3_OPT.LOG
Molecular Orbitals of BH3
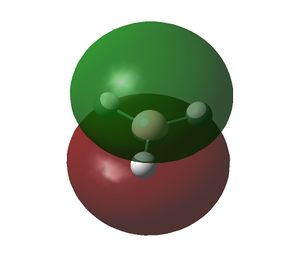
The optimised structure of BH3 was used to calculate the MOs of BH3. The .chk file obtained from the optimisation of the BH3 molecule was opened in Gaussview and the Job type was changed from optimisation to energy. The method and basis set were not changed (DFT/B3LYP, 3-21G), this is because using a different basis set will cause an 'excited' electron density to be obtained. Additionally, the words pop=full were entered into the ‘additional key words’ section, which is needed for the MO analysis of BH3 and a Full NBO was also selected. The calculation was again run on the lap top and only took a few seconds. The resulting .chk file was opened and the following MOs were obtained.
| HOMO-3 | HOMO-2 | HOMO-1 | HOMO |
|---|---|---|---|
 |
 |
 |
 |
| LUMO | LUMO+1 | LUMO+2 | LUMO+3 |
|---|---|---|---|
 |
 |
 |
 |
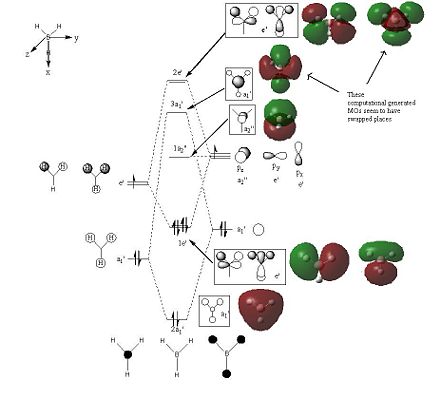

The initial MO diagram drawn for the BH3 molecule shows that the highest energy MO in the BH3 is the 2e' MO. The ordering between the 3a1' and 2e' MOs in the MO diagram is difficult to predict because s-s interactions are stronger than s-p interactions and hence this leads to the 3a1' MO being higher in energy. But the a1' energy levels are lower than the e' energy levels, which make up the 3a1' and 2e' MOs respectively and hence the 3a1' should be lower in energy. Due to this dilemma, the ordering of the MOs was drawn as shown in the initial MO diagram (see above) and hence assuming the 2e' MOs are higher in energy. When the quantitative MO analysis for BH3 was produced via computational methods, the MOs generated were placed on the initial MO diagram and compared with their respective LCAOs. It was found that the 3a1' LCAO and one of the 2e' LCAO did not match the computer generated MOs. However, by switching them around all the LCAOs on the MO diagram matched their respective computationally derived MOs.
Therefore the MO diagram was re-drawn with the 3a1' MO being higher in energy than the 2e' MO (see corrected MO diagram on the right). This change in ordering was not only based on the fact that the LCAOs did not match the computer generated MO diagrams, but also due to the fact that the LUMO+1 and LUMO+2 generated computationally were degenerate (they have the same energy) and the LUMO+3 was not degenerate and hence confirming that the non-degenerate 3a1' MO must be the highest energy MO in the MO diagram for BH3. For the energy values of the MOs generated computationally look at the diagrams above.
The 1s orbital was not included in the MO diagram and hence neither was the 1a1' MO, which is non-bonding. However, the MO is shown separately and both models (the LCAO and computationally derived MOs) match. Overall, the LCAOs and the quantitative MOs are very similar and hence MO theory is accurate and useful.
The MOs derived by the computer are more accurate and depict a better picture. The MOs generated help us visualise the MOs in 3D and help understand how the constituent AOs interact to form the MO shape. These computer generated MOs are also useful in solving problems that occur in MO theory, like the ordering of the MOs in an MO diagram. However, by using a different basis set and method, the ordering of the MOs may change as the difference between the 3a1' and 2e' MOs, which cause the ordering issues in the BH3 MO diagram, is very small only -0.00357 eV.
NBO Analysis of BH3
The .log file from the above MO analysis was opened in Gaussview and the following picture was obtained. The red colour represents negative charge and the green colour represents positive charge. As you can seen the boron atom is positive and the hydrogen atoms are negative.

Gaussview does not give an in depth NBO analysis of BH3 and so the .log file has to be analysed manually to understand and obtain data. To access the .log file obtained click here: https://www.ch.ic.ac.uk/wiki/images/e/ed/PRABHJOT_BH3_POP.LOG
Looking at the 'Summary of the Natural Population Analysis' it can be seen that the B atom has a natural charge of 0.33161 and the hydrogen atoms have a charge of -0.11054, which was also obtained from the Gaussview image produced. The overall charge of the molecule is zero, which is expected as BH3 is a neutral molecule. The hydrogen atoms have the same charge and hence are equivalent and thus the BH3 molecule belongs to the D3h point group.
From the 'Bond orbital/Coefficients/Hybrids' section of the .log file it can be seen that the boron orbitals contribute 44.48% to the BH bonds and have a hybridisation of 33%s and 66%p, whereas the H orbitals contribute 55.52% to the BH bonds and have 100% s character. This shows that the boron has formed 3sp2 hybrid orbitals. There is a forth orbital which is the core orbital (1s orbital of the boron).
The hybridisation of the boron orbitals indicates that there is one p orbital that is empty and perpendicular to the plane of the molecule. By looking at the 'Natural Bond Orbitals (summary)' in the .log file the natural bond orbital 8 has the lowest energy (-0.4532eV) and is unoccupied and hence must correspond to the empty p orbital of the boron. The negative energy of the natural bond orbital 8 indicates that it is acidic. In order to clarify that the natural bond orbital 8 is the empty p orbital the 'Natural Populations: Natural Atomic Orbital Occupancies' section of the .log file was consulted and the valence pz orbital had the same energy as NBO 8.
Vibrational Analysis
The Vibrational analysis of a molecule not only provides IR data of the molecule under consideration, but also confirms if the optimised geometry is in fact the optimum. This is because vibrational analysis takes the second derivative of the potential energy surface and if the frequencies obtained are positive then the structure of the molecule has the lowest energy. If one negative frequency is obtained then the structure of the molecule is a transition state structure. If there are many negative frequencies obtained then the optimisation has failed.
In order to obtain vibrational data, the optimisation output .log file was opened in Gaussview and the method remained unchanged (DFT/B3LYP, 3-21G), but the job type was changed to frequency and the words pop=(full,nbo) were added to the additional key words section. This new .log file was submitted to Gaussian and another .log file was obtained after 9 seconds.
Before any analysis was carried out, the results summary was consulted. If the energy of the molecule had changed then the structure of the BH3 molecule had changed and hence the vibrational analysis would be incorrect, but the value was still -26.4622 a.u. and hence the vibrational analysis seemed to have worked. In order to be doubly sure if the vibrational analysis worked the .log file was opened up and the low frequencies were analysed. If the low frequency values were lower than the actual vibrational frequencies of the molecule than the calculations worked. This was the case as the low frequency values were around -66 and 0. The reason why these low frequencies should be very small is because these frequencies represent the motion of the centre of mass of the molecule. Here is the .log file obtained for the vibrational analysis: https://www.ch.ic.ac.uk/wiki/images/c/c9/PRABHJOT_BH3_FREQ.LOG

The IR spectrum generated for BH3 only has three peaks even though it has 6 vibrational modes (see table). This is because two pairs of vibrational modes have the same frequency (2 and 3, 5 and 6). These vibrational modes are degenerate and have the same vibrational frequency. Due to this only one peak will appear at each pair of vibrations because the peaks overlap. In addition, the vibrational mode 4 does not appear on the IR spectrum because it is not IR active. The vibration is symmetric and hence there is no change in the dipole moment of the molecule and hence the vibration cannot be detected.
BCl3 Optimisation
| Bond Length/Å | 1.87 |
| Bond Angle/o | 120.0 |
| Charge | 0 |
| Spin | Singlet |
| Final Energy/a.u. | -69.4393 |
| RMS Gradient/a.u. | 0.00006 |
| Dipole Moment/D | 0.00 |
| Point Group | D3h |

Basis sets and pseudo potentials were used when BCl3 was being investigated. As stated above the bigger the basis set the more accurate the results obtained will be. This is because a bigger basis set means that more functions are used to describe the function under consideration. However, making the basis set bigger improves accuracy but causes the computer processing time to be longer. Pseudo potentials are also used in this part of the investigation because Cl is now being considered which has many electrons and hence will make the quantum mechanical equations very complex. Therefore using pseudo potentials makes the calculations easier because only the valence electrons will be considered and the pseudo potential will model the core electrons.
A molecule of BCl3 was generated in Gaussview and the symmetry of the molecule was constrained to D3h with the tolerance of 0.0001 (very tight). Then a calculation was run on this molecule. The job type was set as an optimisation, the method used was DFT/B3LYP and the basis set was LanL2MB. The calculation finished in 7 seconds and the .log file generated can be found here: https://www.ch.ic.ac.uk/wiki/images/e/e1/PRABHJOT_BCL3_OPT.LOG
The literature values for the B-Cl bond length in boron trichloride is 1.72 Å and the literature value for the Cl-B-Cl bond angle is 119.9o.[2] The literature values are similar to the values obtained computationally, but the bond angles matched more closely than the bond lengths. The slight discrepancies between the values obtained and the literature values may be due to the method and the basis set used. As assumptions have to made in computational analysis these assumptions can cause room for error. In addition, if the basis is small than the accuracy of the calculation may not be good and hence cause the values obtained to deviate from the literature values.
Due to the literature values being similar to the computationally generated values the BCl3 molecule must have been optimised. The RMS gradient value is close to zero and hence this indicates that the optimisation must have occurred. This is because the RMS gradient is the derivative of the potential energy surface of BCl3 and if the equilibrium structure has been produced by the optimisation, the derivative of this point on the potential energy surface diagram is zero.
The bond angle in BCl3is the same as the bond angle in BH3 but the bond length vary. The BCl3 bond length is longer than the bond length of BH3. This is expected because the atomic radius of a Cl atom is much larger than a hydrogen atom and hence Cl must form a longer bond with the boron as it cannot get as close to the boron atom like the H atom can.
A chemical bond can be ionic or covalent. An ionic bond is the electrostatic attraction between two oppositely charged species. A covalent bond is when two neutral atoms share a pair of electrons. A bond can also be thought of as electron density shared between two atoms. Gaussview does not show certain bonds even though they exist because in Gaussview there is a set parameter value for a bond length. If a bond is the same size or less than this threshold set in Gaussview then a bond is shown. However, if the bond is longer than the threshold value, the bond will not be shown, but we know that it exists.
BCl3 Vibrational Analysis
The .log file obtained from the optimisation of BCl3 was opened in Gaussview and a frequency analysis calculation was carried out. The method used was DFT/B3LYP and the LanL2MB basis set, with the additional key words pop=(full,nbo). This is the same basis set and method used in the optimisation of BCl3. It is essential to use the same method and basis set in both calculations as different basis sets and methods will yield different answers. In addition, if the method and basis set is changed the geometry of the molecule will change when undergoing a frequency analysis and hence the frequency analysis will not be produced for the optimised structure, which is what we want to know.
A frequency analysis was carried out on BCl3 because it provides IR data for the molecule, which is useful, but it also is a way to prove that the optimisation of the BCl3 molecule has occurred. This is because the frequency analysis involves taking the second derivative of the potential energy surface of BCl3. If all the frequencies obtained are positive then the minimum geometry has been obtained, but if negative frequencies have been recorded then the optimisation has failed. The calculation took 18 seconds and the .log file produced can be accessed here: https://www.ch.ic.ac.uk/wiki/images/f/ff/PRABHJOT_BCL3_FREQ.LOG
The frequency analysis did work as no negative values were obtained and the energy of the BCl3 was still -69.4393 a.u.
| Vibrational Number | Form of Vibration | Description of Vibration | Frequency/cm-1 | Literature Frequency Value[3]/cm-1 | Intensity | Symmetry D3h Point Group |
|---|---|---|---|---|---|---|
| 1 |  |
All atoms are moving side to side in the plane of the molecule (rocking) . | 214 | 249 | 4 | E' |
| 2 | 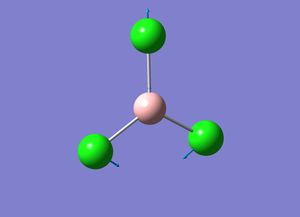 |
All Cl atoms are moving up and down in the plane of the molecule (scissoring) | 214 | 249 | 4 | E' |
| 3 | 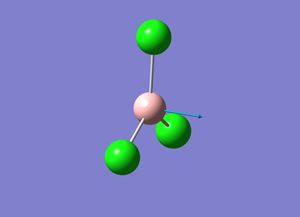 |
The boron atom is moving in and out of the plane. | 377 | 455 | 44 | A2" |
| 4 |  |
All the BCl bonds are stretching (symmetric stretch) | 417 | Not Found | 0 | A1' |
| 5 |  |
The boron atom is moving side to side in the plane of the molecule(asymmetric stretch) | 939 | 956 | 259 | E' |
| 6 |  |
The boron atom is moving up and down in the plane of the molecule(assymetric stretch) | 939 | 956 | 259 | E' |

The IR spectrum of BCl3 does not contain six peaks even though six vibrational modes are possible. This is because some of the vibrations have the same frequency value and hence overlap one and other. In addition, the symmetric stretch does not appear in the IR spectrum because it is IR inactive.
The ground state symmetry of BCl3 is D3h because the molecule is trigonal planar.
Isomers of Mo(CO)4L2
The metal complex Mo(CO)4L2 has two isomers cis and trans. This occurs because the two identical ligands (L) can be 90o (cis) or 180o (trans) to one and other in the octahedral complex. The cis isomer has a different symmetry to the trans isomer. The cis isomer belongs to the C2v point group and the trans isomer belongs to the D4h point group. Due to the isomers having different symmetry, the IR spectra produced will be different and hence IR spectroscopy is a good technique to distinguish between the two isomers.
The trans isomer has a centre of inversion and hence this causes some of the vibrations of the trans isomer to be IR inactive and hence the IR spectrum of the cis isomer has more carbonyl absorption bands. To be more precise the trans isomer produces an IR spectrum which has one carbonyl absorption band and the cis isomer produces an IR spectrum with four carbonyl absorption bands.
The reason why some of the vibrations of the trans isomer are not IR active and hence do not appear in the spectrum is because when these vibrations occur there is no change in the dipole moment of the molecule. In order for a vibration to be acive the incident radiation must cause a change in the dipole moment of the molecule.
During this part of the investigation the Mo(CO)4(PCl3)2 will be analysed. The stability of the two isomers will be found and vibrational analysis will be carried out on both the isomers. Ideally, we wanted to look at Mo(CO)4(PPh3)2 but the triphenylphosphine groups are too big and cause the calculations to run for a long time. The most stable isomer for this complex is the trans isomer, which is due to steric reasons. The triphenylphosphine groups are very bulky and hence will adopt the configuration which places these two ligands as far away from one and other in order to reduce steric clash. We will see below if the same is true for the Mo(CO)4(PCl3)2 complex. The trans and cis isomers can interconvert by the Baliar twist mechanism.
| Charge | 0 |
| Spin | Singlet |
| Final Energy/a.u. | -623.5760 |
| RMS Gradient/a.u. | 0.00004 |
| Dipole Moment/D | 0.30 |
| Point Group | C1 |
| Charge | 0 |
| Spin | Singlet |
| Final Energy/a.u. | -623.5771 |
| RMS Gradient/a.u. | 0.00002 |
| Dipole Moment/D | 1.31 |
| Point Group | C1 |
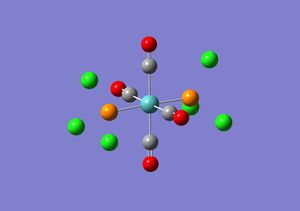
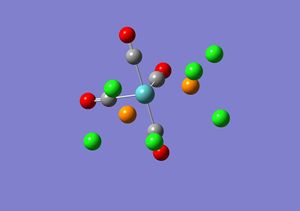
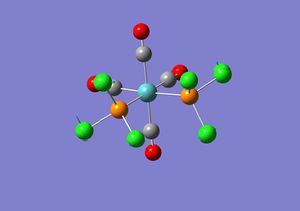
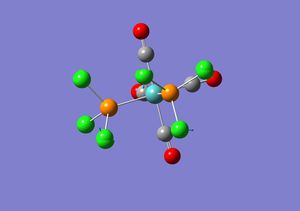
The isomers for Mo(CO)4(PCl3)2 were drawn in Gaussview and optimised using DFT/B3LYP, LanL2MB, opt=loose. The .log file obtained for the cis isomer DOI:10042/to-3776 and for the trans isomer DOI:10042/to-3755 were opened in Gaussview and re-submitted to be optimised again using DFT/B3LYP, LanL2DZ, int=ultrafine scf=conver=9. This is because the first optimisation is a low level calculation and does not give accurate values for the dihedral angles. Before the second optimisation was sent off to scan the PCl3 groups were adjusted in each isomer. In the cis isomer one of the Cl atoms in one of the PCl3 groups was made to point up and parallel with the axial bond and another Cl atom on the other PCl3 group was made to point down and again parallel with the axial bond. In the trans isomer the PCl3 were adjusted so that they were eclipsed and that one of the Cl atoms of each PCl3 group was parallel to the Mo-C bond. The .log files produced for the trans and cis isomers can be found here:DOI:10042/to-3777 and DOI:10042/to-37765 respectively. The first optimisation for the trans isomer took 9 minutes and 40 seconds and for the cis isomer it took 3 minutes 10 seconds. The second optimisation took 10 minutes 58 seconds for the trans isomer and for the cis isomer the calculation took 15 minutes 28 seconds.
The energy of the cis isomer is -1637202 kJmol-1 and the energy of the trans isomer is -1637199 kJmol-1 and therefore the cis isomer is approximately 3 kJmol-1 more stable than the trans isomer. This is surprising as the trans isomer should be lower in energy as it reduces the steric hindrance experienced by the complex due to the two bulky PCl3 ligands. N.B. the accuracy of energy values is 10 kJmol-1, which is more than the energy difference between the two isomers and hence the trans isomer could be lower in energy.
Further Optimisation of Mo(CO)4(PCl3)2 Optimisation
| Charge | 0 |
| Spin | Singlet |
| Final Energy/a.u. | -623.6942 |
| RMS Gradient/a.u. | 0.000007 |
| Dipole Moment/D | 0.23 |
| Point Group | C1 |
| Charge | 0 |
| Spin | Singlet |
| Final Energy/a.u. | -623.6929 |
| RMS Gradient/a.u. | 0.000009 |
| Dipole Moment/D | 0.07 |
| Point Group | C1 |
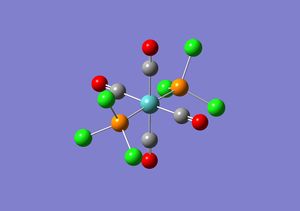
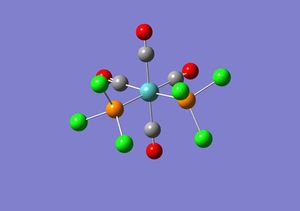
The second optimisation performed on the two isomers was fairly good as it uses a better basis set than the first optimisation, but the second optimisation still only uses a minimal basis set. This means that only valence s and p orbital functions are considered and thus the low lying d atomic orbitals of phosphorous are ignored. The .log file obtained for both the isomers from the second optimisation were opened in word pad and manually altered in order for the d atomic orbitals to be considered in the calculations. Extrabasis was added to the top line of the file and the following was added at the bottom of the file.
(blank line)
P 0
D  1  1.0
0.55  0.100D+01
****
(blank line)
Therefore the same method and basis set was used in the third optimisation as in the second optimisation (DFT, B3LYP, LanL2DZ) but an additional basis set is added to account for the d atomic orbitals of P.
The optimisation of the trans isomer took 11 minutes and 40 seconds and for the cis isomer the calculation took 18 minutes and 49 seconds. The log files can be viewed here: trans-DOI:10042/to-3778 and cis-DOI:10042/to-3774
The energy of the trans isomer is -1637509 kJmol-1 and the energy of the trans isomer is -1637506 kJmol-1 and hence the trans isomer is approximately 3 kJmol-1 more stable than the cis isomer. By using an extra basis set the energy of the trans isomer has now become lower than the cis isomer. The result which is more accurate is the one obtained from the third optimisation. This is because it uses a better basis set than the other optimisations and the result is in agreement with literature. It has been reported that when L is PPh3 in Mo(CO)4L2 the trans isomer is more stable as this isomer reduces the steric hindrance experienced between the two PPh3 ligands by placing the ligands at oposite ends of the complex. Even though PCl3 is being used in our investigation as the phenyl groups are too big and would take too long to optimise, the same reasoning can justify why the trans isomer has been calculated to be the more stable one.
The only way the cis isomer of this metal complex to be lower in energy than the trans isomer would be if the ligands used (L) are fairly small and hence do not experience much steric hindrance when the ligands are next to each other in the cis conformer, for example, hydrogen.
| Cis Isomer | Literature Value[4] [5] | Trans Isomer | Literature Value [6] | |
|---|---|---|---|---|
| Mo-P Bond Length/Å | 2.48 | 2.58 | 4.42 | 2.50 |
| Mo-C Bond Length/Å | 2.05 | 2.06 | 2.06 | 2.06 |
| C=O Bond Length/Å | 1.17 | 1.16 | 1.17 | 1.17 |
| C-Mo-C Bond Angle/o | 89.1 | 90.1 | 89.2 | 92.1 |
| P-Mo-P Bond Angle/o | 94.3 | 104.6 | 176.7 | Not Found |
| P-Mo-C Bond Angle/o | 89.3 | 91.7 | 90.0 | 92.0 |
The literature values used are for the complex Mo(CO)4(PPh3)2. The literature values are close to the calculated values and hence convey that the calculations were fairly accurate. The differences may be due to the method or basis set used as there will always be some error on the computationally derived values due to the approximations made. The more likely reason for the differences between the calculated and literature values is the fact that the complexes in each case are different. The literature values for the angles and the bond lengths are bigger than the calculated values. This is due to the fact that the PPh3 ligands used to obtain the literature results are larger than the PCl3 ligands used in the computational calculations and hence the bonds are bound to be bigger in the literature. In addition, due to the PPh3 ligands being more bulkier than the PCl3 ligands they are more likely to sterically hinder each other more in the cis conformer and hence increase the P-Mo-P bond angle.
Vibrational Analysis of Mo(CO)4(PCl3)2
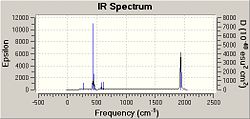
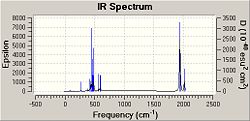
The third optimisation .log files were opened in Gaussview and the job type was changed to frequency but the basis set, method and additional key words remained unchanged. The calculation took 9 minutes 41 seconds for the cis isomer and 8 minutes 30 seconds for the cis isomer. The output .log files can be viewed here: cis-DOI:10042/to-3773 and trans-DOI:10042/to-3772 .
No negative frequencies were obtained for both isomers and hence proves that the optimisation of both isomers are correct and they worked. However, some low value frequencies were obtained for both isomers. These are shown below.
| Vibrational Number | Form of Vibration | Description of Vibration | Frequency/cm-1 | Intensity |
|---|---|---|---|---|
| 1 | 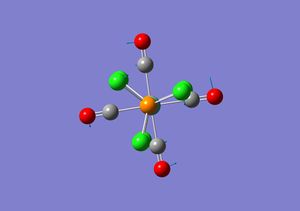 |
Whole complex is twisting | 5 | 0.0547 |
| 2 |  |
TPCl3 are twisting. | 7 | 0 |
A small amount of energy is required by the molecule in order to vibrate at these small frequencies and therefore at room temperature these molecules will be vibrating a lot. This will cause the molecule to access higher vibrational states and hence fewer molecules will be in the ground state and hence these vibrating molecules will not be seen in the spectra.
The vibrations coressponding to the stretch of the C=O are shown below for both isomers.
| Vibrational Number | Vibration | Frequency/cm-1 | Intensity | Symmetry C2v Point Group |
|---|---|---|---|---|
| 42 |  |
1938 | 1598 | B2 |
| 43 |  |
1942 | 820 | B1 |
| 44 |  |
1953 | 592 | A1 |
| 45 |  |
2019 | 542 | A1 |
| Vibrational Number | Vibration | Frequency/cm-1 | Intensity | Symmetry C2v Point Group |
|---|---|---|---|---|
| 42 |  |
1939 | 1606 | Eu |
| 43 |  |
1940 | 1606 | Eu |
| 44 |  |
1967 | 6 | A1g |
| 45 |  |
2026 | 5 | A1g |
The vibrational frequencies and intensities show that in the IR spectrum of the cis conformer there should be three or four carbonyl absorption peaks. This is because all four carbonyl vibrations are IR active and hence will appear on the spectrum. Three peaks may only appear as two peaks have very similar frequencies and may overlap. According to the literature four C=O stretching frequencies are seen in the IR spectrum of Mo(CO)4(PPh3)2 at 1897, 1908, 1927 and 2023cm-1 . These values do not match the frequencies obtained for the cis isomer, the discrepancy could be due to the method used, but it may be due to the fact that the IR frequencies calculated are based on gaseous molecules and the IR spectrum in the literature is produced from a mull and hence solvent effects may affect the vibrational frequencies. However, the literature does support the concept of seeing four peaks in the C=O stretching region for the cis isomer.
The data calculated for the trans isomer shows that two C=O stretch vibrations are IR active and two are not. This is because two of the frequencies have high intensities and the other two frequencies have intensity lower than 10 cm-1. The two active frequencies are close together and may overlap and so we expect to see one peak in the IR spectrum of the trans isomer representing a C=O stretch. In the literature only one peak is seen at 1901 cm-1, which agrees with the results obtained. However, the value of the frequency in the literature does not match the value of the frequency calculated and this again could be due to the method used (it may not be good enough) or due to solvents affecting the literature data.[7]
Accuracy
The energy values of this investigation have a error of 10 kJmol-1, which is approximately 0.0038 a.u. and thus the energy values have been reported to 4 decimal places. The bond angles have been reported to 0.1o, the bond lengths are accurate to 0.01Å, dipole moment values have been reported accurate to two decimal places and finally, intensities and frequencies have been reported to the nearest whole number. Only a couple intensity values have been reported to more accuracy and this is because the values are very small (near zero).
References
- ↑ V. Horvath and I. Hargittai, Structural Chemistry, 2004, 15, 3, 233. DOI:10.1023/B:STUC.0000021532.01536.21
- ↑ O. Brieux de Mandirola, Spectrochimica Acta, 1967, 23A, 4, 767. DOI:10.1016/0584-8539(67)80004-7
- ↑ O. Brieux de Mandirola, Spectrochimica Acta, 1967, 23A, 4, 767. DOI:10.1016/0584-8539(67)80004-7
- ↑ D. J. Darensbourg, Inorg. Chem., 1978, 17, 2680. DOI:10.1021/ic50187a062
- ↑ F. Albert, D. J. Darensbourg, Inorg. Chem., 1982, 21, 294. DOI:10.1021/ic00131a055
- ↑ G. Hogarth, Inorganica Chimica Acta, 1997, 254, 167. DOI:10.1016/S0020-1693(96)05133-X
- ↑ D. J. Darensbourg, Inorg. Chem., 1978, 17, 2680. DOI:10.1021/ic50187a062


