Rep:Mod:imperial123
EX3 section
| BH3 | BBr3 | GaBr3 | |
|---|---|---|---|
| r(E-X) | 1.19Å | 1.93Å | 2.35Å |
| θ(X-E-X) | 120° | 120° | 120° |
The table above indicates that there is variations in bond lengths for each molecule. The reason for the differences is due to the size of the atoms in the molecules; namely the central atom (B or Ga) and the adjoining "ligand" atoms (H or Br).
Hydrogen is a small atom as it only contains one proton and an electron and therefore has a small 1s orbital; as a result, it can be situated much closer to the central atom without causing steric interference. Furthermore, having only one electron amplifies this idea as there is less electron-electron repulsion and therefore the bond length to a hydrogen atom would be smaller than that to a bromine atom. Bromine is a larger atom, with larger p orbitals that are used for bonding. As a result of this, the bromine atom is further away from the central atom in order to minimise the energy and stabilise the molecule. This difference is highlighted through the comparison of BH3 and BBr3; the bond length for the bromine containing molecule is larger than the hydrogen containing molecule.
On the other hand, changing of the central atom also has an effect on bond length. Gallium is a 4th row element and is much larger than boron which is a 2nd row element. The larger gallium atom means that the ligands associated with the central atom are not able to be as close otherwise there would be steric and electric interactions (as mentioned above) that would cause an unfavourable interaction. This can be seen through comparing BBr3 and GaBr3; the gallium containing molecule has larger bond lengths than the boron containing molecule.
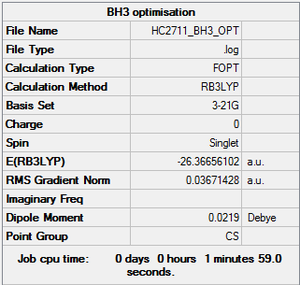
BH3 optimisation
        Item               Value     Threshold  Converged?
 Maximum Force            0.000220     0.000450     YES
 RMS     Force            0.000106     0.000300     YES
 Maximum Displacement     0.000709     0.001800     YES
 RMS     Displacement     0.000447     0.001200     YES
BH optimisation |
The optimisation file is linked to via clicking here
BH3 optimisation - 631g dp

         Item               Value     Threshold  Converged?
 Maximum Force            0.000012     0.000450     YES
 RMS     Force            0.000008     0.000300     YES
 Maximum Displacement     0.000061     0.001800     YES
 RMS     Displacement     0.000038     0.001200     YES
BH optimisation with 631g basis sets |
The optimisation file is linked to via clicking here
GaBr3 optimisation

        Item               Value     Threshold  Converged?
 Maximum Force            0.000000     0.000450     YES
 RMS     Force            0.000000     0.000300     YES
 Maximum Displacement     0.000003     0.001800     YES
 RMS     Displacement     0.000002     0.001200     YES
GaBr optimisation with LANL2DZ basis sets |
The optimisation file is linked to via clicking here: DOI:10042/31185
BBr3 optimisation
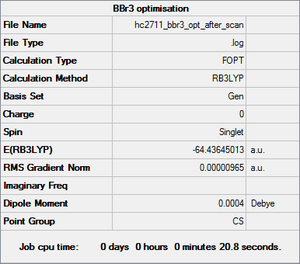
The optimisation file is linked to via clicking here: DOI:10042/31191
         Item               Value     Threshold  Converged?
 Maximum Force            0.000015     0.000450     YES
 RMS     Force            0.000009     0.000300     YES
 Maximum Displacement     0.000069     0.001800     YES
 RMS     Displacement     0.000041     0.001200     YES
BBr optimisation |
BH3 frequency
Low frequencies ---   -0.9452   -0.8686   -0.0054    5.6959   11.6999   11.7380
Low frequencies --- 1162.9961 1213.1825 1213.1852
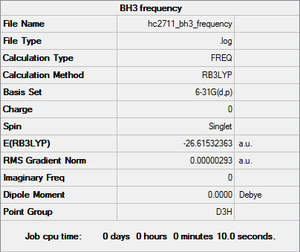
         Item               Value     Threshold  Converged?
 Maximum Force            0.000006     0.000450     YES
 RMS     Force            0.000003     0.000300     YES
 Maximum Displacement     0.000023     0.001800     YES
 RMS     Displacement     0.000012     0.001200     YES
BH frequency analysis |
The optimisation file is linked to via clicking here
| wavenumber cm-1 | Intensity | IR active? | type |
| 1163 | 92 | yes | bend |
| 1213 | 14 | slight | bend |
| 1213 | 14 | slight | bend |
| 2582 | 0 | no | stretch |
| 2715 | 126 | yes | stretch |
| 2715 | 126 | yes | stretch |
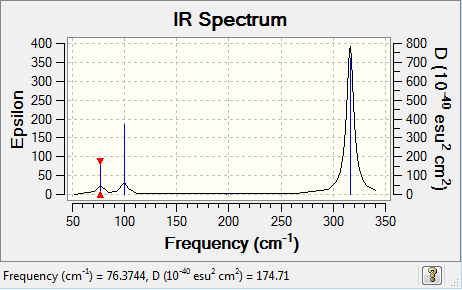
In the IR spectrum, we only see three peaks despite the fact that there are six vibrations. This is due to the fact that in order for a vibrational mode to be IR active and show a peak in a spectrum, it must be associated with a change in dipole moment of a molecule. As shown in the table above, the vibrations at 1163cm-1, 1213-1 and 2715-1 are associated with a dipole change in the molecule and would therefore record a peak in the IR spectrum. As a result, there are 3 peaks seen.
GaBr3 frequency analysis

 Low frequencies ---   -0.5252   -0.5247   -0.0024   -0.0010    0.0235    1.2010
 Low frequencies ---   76.3744   76.3753   99.6982
         Item               Value     Threshold  Converged?
 Maximum Force            0.000000     0.000450     YES
 RMS     Force            0.000000     0.000300     YES
 Maximum Displacement     0.000002     0.001800     YES
 RMS     Displacement     0.000001     0.001200     YES
The frequency analysis file is linked to via clicking here
NH frequency |
| wavenumber | Intensity | IR active? | type |
| 76.37 | 3.3447 | no | bend |
| 76.38 | 3.3447 | no | bend |
| 99.70 | 9.2161 | slight | bend |
| 197.34 | 0.0000 | no | stretch |
| 316.18 | 57.0704 | yes | stretch |
| 316.19 | 57.0746 | yes | stretch |
There is a large difference in the value of the frequencies for BH3 compared to GaBr3. This can be explained through understanding of how the frequency value is generated.
v=(1/2π)(k/μ)0.5
v = frequency (cm-1)
k = force constant (Ncm-1)
μ = reduced mass (kg)
The force constant is relative to the strength of a bond. The bond in a BH3 molecule is shorter than the bond in GaBr3 and is therefore stronger. Therefore, there would be a larger force constant value, which in turn causes there to be a larger frequency value. Additionally, the reduced mass value is relative to the molecular mass of the molecule in question. BH3 is a lighter molecule than GaBr3 and would therefore have a smaller μ component. As a result, this would also increase the frequency value of BH3 relative to GaBr3
BH3 molecular orbitals
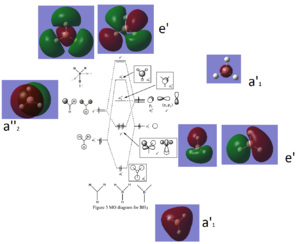
REFERENCE ^^^^^^^^^^^^^
NH3 optimisation
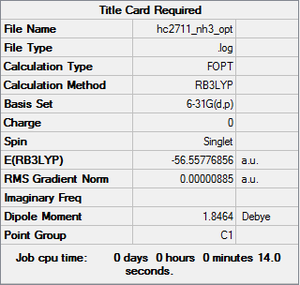
         Item               Value     Threshold  Converged?
 Maximum Force            0.000024     0.000450     YES
 RMS     Force            0.000012     0.000300     YES
 Maximum Displacement     0.000079     0.001800     YES
 RMS     Displacement     0.000053     0.001200     YES
NH optimisation |
The optimisation file is linked to via clicking here
NH3 frequency
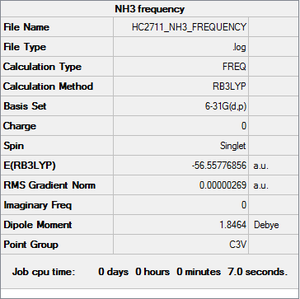
         Item               Value     Threshold  Converged?
 Maximum Force            0.000007     0.000450     YES
 RMS     Force            0.000003     0.000300     YES
 Maximum Displacement     0.000020     0.001800     YES
 RMS     Displacement     0.000009     0.001200     YES
Low frequencies ---  -31.6862   -0.0021   -0.0019   -0.0010   13.0137   25.5415
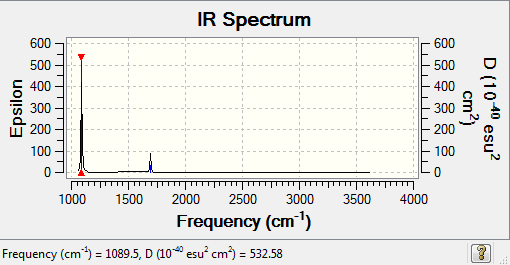
Low frequencies --- 1089.5024 1694.1077 1694.1683
The optimisation file is linked to via clicking here
NH frequency analysis |
| wavenumber | Intensity | IR active? | type |
| 1089.50 | 145.4472 | yes | bend |
| 1694.11 | 13.5564 | slight | bend |
| 1694.17 | 13.5568 | slight | bend |
| 3461.13 | 1.0589 | no | stretch |
| 3589.59 | 0.2701 | no | stretch |
| 3589.62 | 0.2702 | no | stretch |
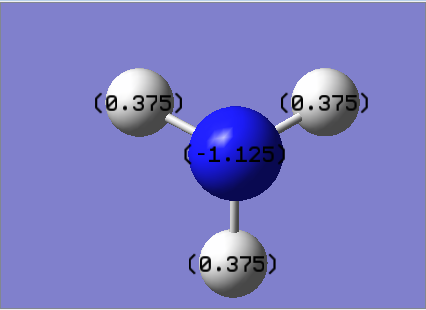
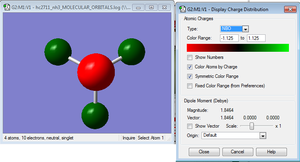
NBO analysis of NH3
NH3BH3 optimisation and frequency analysis
Optimisation
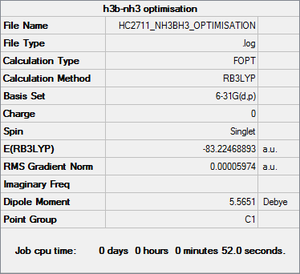
         Item               Value     Threshold  Converged?
 Maximum Force            0.000123     0.000450     YES
 RMS     Force            0.000058     0.000300     YES
 Maximum Displacement     0.000515     0.001800     YES
 RMS     Displacement     0.000296     0.001200     YES
BHNH frequency analysis |
The optimisation file is linked to via clicking here
Frequency analysis
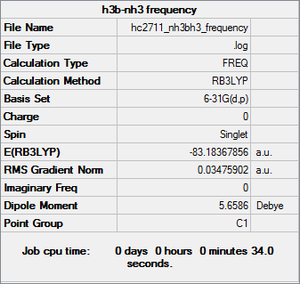
Low frequencies --- -798.6586 -401.9665 -401.6723    0.0011    0.0012    0.0014
 Low frequencies ---  641.9215  642.0636  912.2909
         Item               Value     Threshold  Converged?
 Maximum Force            0.096500     0.000450     NO
 RMS     Force            0.034759     0.000300     NO
 Maximum Displacement     0.121535     0.001800     NO
 RMS     Displacement     0.061044     0.001200     NO
BHNH frequency analysis |
The frequency analysis file is linked to via clicking here
Questions
What is a bond?
A bond is an attraction between atoms as a result of sharing electrons in order to form substances that contain two or more atoms. The electrostatic attraction forming a bond can be a result of attraction between oppositely charged ions, between electrons and nuclei or due to a dipole attraction. The bond will only form a stable molecule if the total energy of the created compound has a lower overall energy than the separated substituent atoms.
How much energy is there in a strong, medium and weak bond? Give examples of each type of bond (strong, medium and weak)
A typical strong bond is the nitrogen-nitrogen bond in an N2 molecule. This is around 945kJmol-1. An example of a medium bond is the bond between a carbon atom and a chlorine atom; this has a bond enthalpy of 331kJmol-1. An example of a weak bond is an iodine-iodine bond which has a bond dissociation energy of 151kJmol-1.
In some structures gaussview does not draw in the bonds where we expect, why does this NOT mean there is no bond?
In order for a bond to be graphically depicted in the expected position, the distance between the atoms must be within the range that is programmed into gaussview. If it is not in this pre-programmed range then the bond would not be drawn where expected. This does not mean that there is no bond as there is a wide variety of bond lengths due to the wide variety of possible molecules.
Why must you use the same method and basis set for both the optimisation and frequency analysis calculations?
The basis set and methods must be the same for the calculations. The method is related to the LCAO part of an equation and the basis set is related to all of the functions used. If at any point of the calculations one of these is not the same then the results will not be valid.
What is the purpose of carrying out a frequency analysis?
Frequency analysis is useful in determining whether the stationary points derived from optimising the structure is a minimum or a maximum. The frequency analysis is the second derivative of the potential energy surface. If the value is positive, then a minimum has been obtained. If it is a negative, then a maximum has been obtained. However, if all of the values are negative then it indicates that the optimisation done is not the lowest energy state of the molecule and should be redone.
What do the "low frequencies" represent
A molecule with N atoms has 3N-6 number of vibrational modes. The low frequencies are indicated by the "-6" part of the equation. These frequency values are much lower than the first vibrational mode as they are the motion of the centre of the mass of the molecule.
Aromaticity
basis set 6-31g (d,p)
freq, MO
draw orbitals on diagram from gauss
b(benzene) + n(benzene) same thing no MO
compare
Benzene
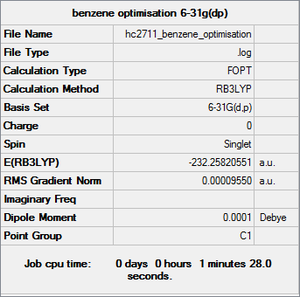
         Item               Value     Threshold  Converged?
 Maximum Force            0.000212     0.000450     YES
 RMS     Force            0.000085     0.000300     YES
 Maximum Displacement     0.000991     0.001800     YES
 RMS     Displacement     0.000315     0.001200     YES
The optimisation file is linked to via clicking here
Benzene optimisation |


