Rep:Mod:ilovemelody
Compulsory Computation (Week 1)
Optimization of Trigonal Planar Molecules
Optimising BH3 Molecule using 3-21G Basis Set
| Optimised BH3 Molecule Summary (1) | |
|---|---|
| File Type | .log |
| Calculation Type | FOPT |
| Calculation Method | RB3LYP |
| Basis Set | 3-21G |
| Final Energy (au) | -26.462264 |
| Gradient (au) | 0.00008851 |
| Dipole Moment (Debye) | 0.00 |
| Symmetry Point Group | CS |
| Calculation CPU Time | 15 seconds |
| H-B-H Bond Angle (°) | 119.998 (H2 B1 H3) |
| 119.986 (H3 B1 H4) | |
| 120.016 (H4 B1 H2) | |
| 120.0 (Mean) | |
| B-H Bond Distance (Å) | 1.19467 (B1 H2) |
| 1.19445 (B1 H3) | |
| 1.19480 (B1 H4) | |
| 1.19 (Mean) | |
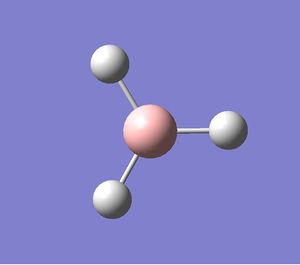
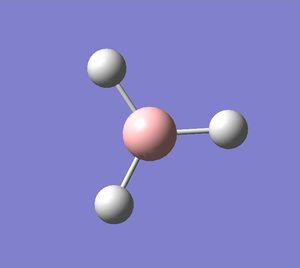
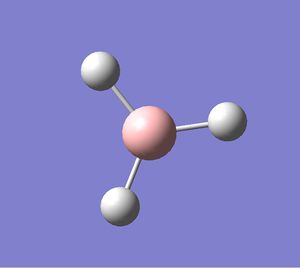
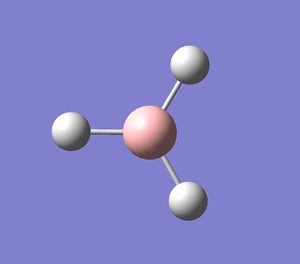
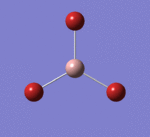
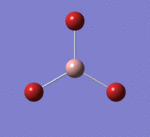
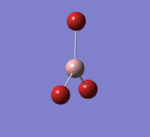
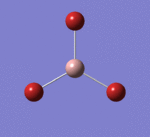
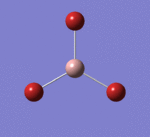
Using GaussView, a BH3 molecule was preset to have different B-H bond length of 1.53, 1.54 and 1.55 to break the symmetry of the molecule. Using a simple 3-21G Basis set, the molecule was optimised. However, a point group symmetry of Cs was obtained, instead of the expected D3h symmetry. As the symmetry of the molecule was broken by presetting different bond lengths, the program has difficulty achieving the correct symmetry without extremely accurate numbers. However, the molecule still has D3h symmetry up to 3 decimal places (dp) in the bond distances and 1dp in the angles.[1]
         Item               Value     Threshold  Converged?
 Maximum Force            0.000220     0.000450     YES
 RMS     Force            0.000106     0.000300     YES
 Maximum Displacement     0.000709     0.001800     YES
 RMS     Displacement     0.000447     0.001200     YES
 Predicted change in Energy=-1.672479D-07
 Optimization completed.
    -- Stationary point found.
                           ----------------------------
                           !   Optimized Parameters   !
                           ! (Angstroms and Degrees)  !
 --------------------------                            --------------------------
 ! Name  Definition              Value          Derivative Info.                !
 --------------------------------------------------------------------------------
 ! R1    R(1,2)                  1.1947         -DE/DX =   -0.0002              !
 ! R2    R(1,3)                  1.1944         -DE/DX =   -0.0001              !
 ! R3    R(1,4)                  1.1948         -DE/DX =   -0.0002              !
 ! A1    A(2,1,3)              119.9983         -DE/DX =    0.0                 !
 ! A2    A(2,1,4)              120.0157         -DE/DX =    0.0                 !
 ! A3    A(3,1,4)              119.986          -DE/DX =    0.0                 !
 ! D1    D(2,1,4,3)            180.0            -DE/DX =    0.0                 !
 --------------------------------------------------------------------------------
 GradGradGradGradGradGradGradGradGradGradGradGradGradGradGradGradGradGrad
The optimisation .log file can be found here.
Optimising BH3 Molecule using 6-31G(d,p) Basis Set
| Optimised BH3 Molecule Summary (2) | |
|---|---|
| File Type | .log |
| Calculation Type | FOPT |
| Calculation Method | RB3LYP |
| Basis Set | 6-31G(d,p) |
| Final Energy (au) | -26.61532358 |
| Gradient (au) | 0.00008207 |
| Dipole Moment (Debye) | 0.00 |
| Symmetry Point Group | CS |
| Calculation CPU Time | 27.0 seconds |
| H-B-H Bond Angle (°) | 119.999 (H2 B1 H3) |
| 119.987 (H3 B1 H4) | |
| 120.015 (H4 B1 H2) | |
| 120.0 (Mean) | |
| B-H Bond Distance (Å) | 1.19264 (B1 H2) |
| 1.19243 (B1 H3) | |
| 1.19276 (B1 H4) | |
| 1.19 (Mean) | |
Using the 3-21G optimised BH3 log file, another round of optimization was carried out using the 6-31G basis set. Basis sets determine the number of functions used to describe an electronic structure.[2] As 6-31G is a higher level basis set, the optimization would better represent the actual structure of the molecule, and hence, more accurate results are expected from this optimization. This can be clearly seen in the bond angles and bond distances of the BH3 optimized molecule, which has less deviation than in the previous calculation, resulting in a more D3H symmetry.
 Item               Value     Threshold  Converged?
 Maximum Force            0.000204     0.000450     YES
 RMS     Force            0.000099     0.000300     YES
 Maximum Displacement     0.000875     0.001800     YES
 RMS     Displacement     0.000418     0.001200     YES
 Predicted change in Energy=-1.452205D-07
 Optimization completed.
    -- Stationary point found.
                           ----------------------------
                           !   Optimized Parameters   !
                           ! (Angstroms and Degrees)  !
 --------------------------                            --------------------------
 ! Name  Definition              Value          Derivative Info.                !
 --------------------------------------------------------------------------------
 ! R1    R(1,2)                  1.1926         -DE/DX =   -0.0002              !
 ! R2    R(1,3)                  1.1924         -DE/DX =    0.0                 !
 ! R3    R(1,4)                  1.1928         -DE/DX =   -0.0002              !
 ! A1    A(2,1,3)              119.9988         -DE/DX =    0.0                 !
 ! A2    A(2,1,4)              120.0146         -DE/DX =    0.0                 !
 ! A3    A(3,1,4)              119.9866         -DE/DX =    0.0                 !
 ! D1    D(2,1,4,3)            180.0            -DE/DX =    0.0                 !
 --------------------------------------------------------------------------------
 GradGradGradGradGradGradGradGradGradGradGradGradGradGradGradGradGradGrad
The optimisation .log file can be found here.
Optimising GaBr3 Molecule using LANL2DZ Basis Set
| Optimised GaBr3 Molecule Summary | ||
|---|---|---|
| File Type | .log | |
| Calculation Type | FOPT | |
| Calculation Method | RB3LYP | |
| Basis Set | LANL2DZ | |
| Final Energy (au) | -41.700828 | |
| Gradient (au) | 0.00000016 | |
| Dipole Moment (Debye) | 0.00 | |
| Symmetry Point Group | D3H | |
| Calculation CPU Time | 27.5 seconds | |
| Br-Ga-Br Bond Angle (°) | 120.0 | |
| Ga-Br Bond Distance (Å) | 2.35 | |
The optimization of GaBr3 involves the use of pseudo-potentials (PP), where it is assumed that for heavy elements, the valence electrons dominate in bonding interactions. The usage of PP makes calculations involving heavy elements much easier without affecting the accuracy of results significantly.[3] By using the LanL2DZ basis set, the program uses a medium level basis set: D95V on first row atoms and Los Alamos ECP (ie pseudo potentials) on heavier elements.[4] In this optimization, the symmetry of the molecule has also been locked to D3H. It is worth noting that by doing so, there is no variation in bond angles and bond distances between each Ga-Br bond, unlike the previous optimizations. The calculated bond lengths of the Ga-Br bonds (2.35018 Å) are found to be significantly longer than literature values. (2.239±0.007 at 357 K and 2.249±0.005 at 638 K) [5] It is believed that optimization with a higher basis set will result in a more accurate calculation of the structure of GaBr3.
 Item               Value     Threshold  Converged?
 Maximum Force            0.000000     0.000450     YES
 RMS     Force            0.000000     0.000300     YES
 Maximum Displacement     0.000003     0.001800     YES
 RMS     Displacement     0.000002     0.001200     YES
 Predicted change in Energy=-1.282691D-12
 Optimization completed.
    -- Stationary point found.
                           ----------------------------
                           !   Optimized Parameters   !
                           ! (Angstroms and Degrees)  !
 --------------------------                            --------------------------
 ! Name  Definition              Value          Derivative Info.                !
 --------------------------------------------------------------------------------
 ! R1    R(1,2)                  2.3502         -DE/DX =    0.0                 !
 ! R2    R(1,3)                  2.3502         -DE/DX =    0.0                 !
 ! R3    R(1,4)                  2.3502         -DE/DX =    0.0                 !
 ! A1    A(2,1,3)              120.0            -DE/DX =    0.0                 !
 ! A2    A(2,1,4)              120.0            -DE/DX =    0.0                 !
 ! A3    A(3,1,4)              120.0            -DE/DX =    0.0                 !
 ! D1    D(2,1,4,3)            180.0            -DE/DX =    0.0                 !
 --------------------------------------------------------------------------------
 GradGradGradGradGradGradGradGradGradGradGradGradGradGradGradGradGradGrad
The optimisation .log file can be found here. DOI:10042/26917
Optimising BBr3 Molecule using mixed Basis Sets
| Optimised BBr3 Molecule Summary | |
|---|---|
| File Type | .log |
| Calculation Type | FOPT |
| Calculation Method | RB3LYP |
| Basis Set | Gen |
| Final Energy (au) | -64.436454 |
| Gradient (au) | 0.00001020 |
| Dipole Moment (Debye) | 0.00 |
| Symmetry Point Group | CS |
| Calculation CPU Time | 38.6 seconds |
| H-B-H Bond Angle (°) | 120.002 (Br2 B1 Br3) |
| 119.997 (Br3 B1 Br4) | |
| 120.001 (Br4 B1 Br2) | |
| 120.0 (Mean) | |
| B-H Bond Distance (Å) | 1.93392 (B1 Br2) |
| 1.93398 (B1 Br3) | |
| 1.93400 (B1 Br4) | |
| 1.93 (Mean) | |
When compunds contain both heavy atoms which require a pseudo-potential, and light atoms, which are treated more accurately with a full basis set, we need to be able to mix psueod-potentials and basis sets.[6] In the case of BBr3, the Boron (B) atoms were optimized with a 6-31G(d,p) basis set while the Bromine (Br) atoms were optimized with the LanL2DZ basis set.
         Item               Value     Threshold  Converged?
 Maximum Force            0.000017     0.000450     YES
 RMS     Force            0.000010     0.000300     YES
 Maximum Displacement     0.000072     0.001800     YES
 RMS     Displacement     0.000043     0.001200     YES
 Predicted change in Energy=-1.759239D-09
 Optimization completed.
    -- Stationary point found.
                           ----------------------------
                           !   Optimized Parameters   !
                           ! (Angstroms and Degrees)  !
 --------------------------                            --------------------------
 ! Name  Definition              Value          Derivative Info.                !
 --------------------------------------------------------------------------------
 ! R1    R(1,2)                  1.9339         -DE/DX =    0.0                 !
 ! R2    R(1,3)                  1.934          -DE/DX =    0.0                 !
 ! R3    R(1,4)                  1.934          -DE/DX =    0.0                 !
 ! A1    A(2,1,3)              120.0018         -DE/DX =    0.0                 !
 ! A2    A(2,1,4)              120.0011         -DE/DX =    0.0                 !
 ! A3    A(3,1,4)              119.9971         -DE/DX =    0.0                 !
 ! D1    D(2,1,4,3)            180.0            -DE/DX =    0.0                 !
 --------------------------------------------------------------------------------
 GradGradGradGradGradGradGradGradGradGradGradGradGradGradGradGradGradGrad
The optimisation .log file can be found here. DOI:10042/26916
Bond Length Comparison and Analysis
| BH3 | BBr3 | GaBr3 |
|---|---|---|
| 1.19261±0.00018 Å | 1.93397±0.00005 Å | 2.35018±0.00000 Å |
All three optimized molecules in the Gaussian calculations are trigonal planar molecules, where the central atom (B or Ga) is a Group III element with an oxidation state of (III), and the ligand is H or Br, both of which have oxidation states of (-I), which are bonded to the central atom though a 2 centre 2 electron bond. It is observed that as the atomic radii of the central atom increases, from Period 2 element Boron to Period 4 Gallium, bond length increases. Similarly, when the atomic radii of the ligand increases, so does the bond length. The primary factor in determining bond length in these molecules is the efficiency of the orbital overlap between the central atom and ligands. As atomic radii increases, the valence orbital size increases, resulting in more diffuse orbitals which in turn results in weaker overlaps and weaker bonds.
Another explanation for the differences in bond lengths could be explained with a Molecular Orbital diagram. The electronegativities of B, Ga, H and Br are 2.04, 1.81, 2.20 and 2.96 respectively. As the electonegativity difference between the central atom and the ligand atoms increases, so does the Molecular Orbital energy difference between the central atom and the X3 fragments. Larger differences in orbital energy, result in smaller orbital overlap and smaller stabilization energy from the resulting bonding orbital.
Lack of Bonds
The Total Energy graph represents the program traversing the Potential Energy Surface to attain the minimum energy structure of BH3. The initial high energy reflects the close proximity of the nuclei, hence a repulsive interaction. The gradual decrease in energy during the optimization moves towards a stable equilibrium position. The Gradient graph represents the Root Mean Square Gradient, showing the gradient of the Potential Energy Surface tending towards zero as the equilibrium structure of BH3 is obtained.
The peculiarity here is that the GaussView program shows that there are no bonds present in the first few optimization steps. The depiction of bonds within Gaussview is purely dependent on distance, thus the absence of a bond is a consequence of the bond length exceeding the threshold value within the program. According to the valence bond theory, a covalent bond can be defined as a build-up of electron density between two or more nuclei due to the overlap of their valence atomic orbitals. As for an ionic bond, the definition is a strong electrostatic attraction between oppositely charged ions. Thus, according to these definitions, there is no evidence to suggest an absence of a bond based purely on the bond distance, which is reasonably within the magnitude of similar bond lengths.
Vibrational Analysis of Trigonal Planar Molecules
Frequency Analysis for BH3
| BH3 Frequency Summary | |
|---|---|
| File Type | .log |
| Calculation Type | FREQ |
| Calculation Method | RB3LYP |
| Basis Set | 6-31G(d,p) |
| Final Energy (au) | -26.615324 |
| Gradient (au) | 0.00008198 |
| Dipole Moment (Debye) | 0.00 |
| Symmetry Point Group | CS |
| Calculation CPU Time | 10.0 seconds |
The frequency calculation was first calculated without restricting symmetry to D3H
 Low frequencies ---   -0.0004    0.0008    0.0012   33.8055   41.5584   43.6982
 Low frequencies --- 1163.5017 1213.4677 1213.5865
 Diagonal vibrational polarizability:
        0.7187530       0.7198816       1.8387966
 Harmonic frequencies (cm**-1), IR intensities (KM/Mole), Raman scattering
 activities (A**4/AMU), depolarization ratios for plane and unpolarized
 incident light, reduced masses (AMU), force constants (mDyne/A),
 and normal coordinates:
                      1                      2                      3
                     A"                     A'                     A'
 Frequencies --   1163.5016              1213.4676              1213.5864
 Red. masses --      1.2531                 1.1072                 1.1071
 Frc consts  --      0.9995                 0.9605                 0.9607
 IR Inten    --     92.4985                14.0941                14.0721
  Atom  AN      X      Y      Z        X      Y      Z        X      Y      Z
     1   5     0.00   0.00   0.16    -0.04  -0.09   0.00     0.09  -0.04   0.00
     2   1     0.00   0.00  -0.57     0.60   0.31   0.00    -0.34  -0.29   0.00
     3   1     0.00   0.00  -0.57    -0.05   0.72   0.00     0.06   0.36   0.00
     4   1     0.00   0.00  -0.57    -0.08  -0.05   0.00    -0.71   0.39   0.00
                      4                      5                      6
                     A'                     A'                     A'
 Frequencies --   2580.4421              2712.7989              2714.0816
 Red. masses --      1.0078                 1.1273                 1.1273
 Frc consts  --      3.9539                 4.8881                 4.8927
 IR Inten    --      0.0056               126.4088               126.3655
  Atom  AN      X      Y      Z        X      Y      Z        X      Y      Z
     1   5     0.00   0.00   0.00     0.01   0.11   0.00     0.11  -0.01   0.00
     2   1    -0.30   0.49   0.00     0.34  -0.53   0.00    -0.25   0.44   0.00
     3   1     0.57   0.01   0.00    -0.13   0.01   0.00    -0.80  -0.02   0.00
     4   1    -0.28  -0.51   0.00    -0.37  -0.66   0.00    -0.12  -0.26   0.00
The optimisation .log file can be found here.
The low frequencies corresponding to the vibrations of the center B nucleus is not within ±15cm-1, which is not acceptable.
| BH3 Frequency D3HSummary | |
|---|---|
| File Type | .log |
| Calculation Type | FREQ |
| Calculation Method | RB3LYP |
| Basis Set | 6-31G(d,p) |
| Final Energy (au) | -26.615323 |
| Gradient (au) | 0.00008056 |
| Dipole Moment (Debye) | 0.00 |
| Symmetry Point Group | D3H |
| Calculation CPU Time | 5.0 seconds |
Frequency calculation was then calculated again to restrict the point group symmetry to D3H
Low frequencies ---   -0.9432   -0.8611   -0.0056    5.7455   11.7246   11.7625
 Low frequencies --- 1162.9963 1213.1826 1213.1853
 Diagonal vibrational polarizability:
        0.7181146       0.7180145       1.8413851
 Harmonic frequencies (cm**-1), IR intensities (KM/Mole), Raman scattering
 activities (A**4/AMU), depolarization ratios for plane and unpolarized
 incident light, reduced masses (AMU), force constants (mDyne/A),
 and normal coordinates:
                      1                      2                      3
                     A2"                    E'                     E'
 Frequencies --   1162.9963              1213.1826              1213.1853
 Red. masses --      1.2531                 1.1072                 1.1072
 Frc consts  --      0.9986                 0.9601                 0.9601
 IR Inten    --     92.5482                14.0551                14.0587
  Atom  AN      X      Y      Z        X      Y      Z        X      Y      Z
     1   5     0.00   0.00   0.16     0.00   0.10   0.00    -0.10   0.00   0.00
     2   1     0.00   0.00  -0.57     0.00   0.08   0.00     0.81   0.00   0.00
     3   1     0.00   0.00  -0.57     0.39  -0.59   0.00     0.14  -0.39   0.00
     4   1     0.00   0.00  -0.57    -0.39  -0.59   0.00     0.14   0.39   0.00
                      4                      5                      6
                     A1'                    E'                     E'
 Frequencies --   2582.2764              2715.4465              2715.4477
 Red. masses --      1.0078                 1.1273                 1.1273
 Frc consts  --      3.9595                 4.8977                 4.8977
 IR Inten    --      0.0000               126.3302               126.3206
  Atom  AN      X      Y      Z        X      Y      Z        X      Y      Z
     1   5     0.00   0.00   0.00     0.11   0.00   0.00     0.00   0.11   0.00
     2   1     0.00  -0.58   0.00     0.02   0.00   0.00     0.00  -0.81   0.00
     3   1     0.50   0.29   0.00    -0.60  -0.36   0.00    -0.36  -0.19   0.00
     4   1    -0.50   0.29   0.00    -0.60   0.36   0.00     0.36  -0.19   0.00
The optimisation .log file can be found here.
The low frequencies corresponding to the vibrations of the center B nucleus is within ±15cm-1, which is acceptable, and all the real frequencies are positive, indicating that the potential energy surface is at a minimum.
Calculated IR Spectra of BH3:
N.B: Click on images once to open a new window, and click again on the new image to play the animation.
Frequency Analysis for GaBr3
| GaBr3 Frequency Summary | |
|---|---|
| File Type | .log |
| Calculation Type | FREQ |
| Calculation Method | RB3LYP |
| Basis Set | LANL2DZ |
| Final Energy (au) | -41.700828 |
| Gradient (au) | 0.00000011 |
| Dipole Moment (Debye) | 0.00 |
| Symmetry Point Group | D3H |
| Calculation CPU Time | 16.5 seconds |
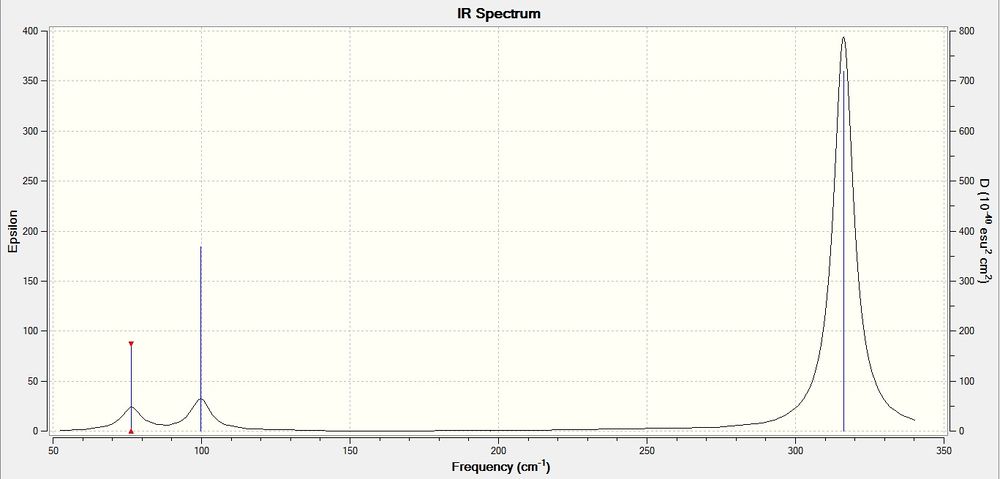
A frequency analysis was performed on the previously optimized GaBR3 molecule with the following results.
 Low frequencies ---   -0.5252   -0.5247   -0.0024   -0.0010    0.0235    1.2010
 Low frequencies ---   76.3744   76.3753   99.6982
 Diagonal vibrational polarizability:
       30.7937168      30.7942540      24.9520712
 Harmonic frequencies (cm**-1), IR intensities (KM/Mole), Raman scattering
 activities (A**4/AMU), depolarization ratios for plane and unpolarized
 incident light, reduced masses (AMU), force constants (mDyne/A),
 and normal coordinates:
                      1                      2                      3
                     E'                     E'                     A2"
 Frequencies --     76.3744                76.3753                99.6982
 Red. masses --     77.4211                77.4212                70.9513
 Frc consts  --      0.2661                 0.2661                 0.4155
 IR Inten    --      3.3447                 3.3447                 9.2161
  Atom  AN      X      Y      Z        X      Y      Z        X      Y      Z
     1  31    -0.39   0.00   0.00     0.00   0.39   0.00     0.00   0.00   0.89
     2  35     0.63   0.00   0.00     0.00   0.41   0.00     0.00   0.00  -0.26
     3  35    -0.15  -0.45   0.00     0.45  -0.37   0.00     0.00   0.00  -0.26
     4  35    -0.15   0.45   0.00    -0.45  -0.37   0.00     0.00   0.00  -0.26
                      4                      5                      6
                     A1'                    E'                     E'
 Frequencies --    197.3371               316.1825               316.1863
 Red. masses --     78.9183                72.2067                72.2066
 Frc consts  --      1.8107                 4.2531                 4.2532
 IR Inten    --      0.0000                57.0704                57.0746
  Atom  AN      X      Y      Z        X      Y      Z        X      Y      Z
     1  31     0.00   0.00   0.00     0.82   0.00   0.00     0.00   0.82   0.00
     2  35     0.00   0.58   0.00    -0.01   0.00   0.00     0.00  -0.47   0.00
     3  35    -0.50  -0.29   0.00    -0.35  -0.20   0.00    -0.20  -0.12   0.00
     4  35     0.50  -0.29   0.00    -0.35   0.20   0.00     0.20  -0.12   0.00
The optimisation .log file can be found here. DOI:10042/26964
The low frequencies corresponding to the vibrations of the center Ga nucleus is within ±15cm-1, which is acceptable, and all the real frequencies are positive, indicating that the potential energy surface is at a minimum.
Calculated IR Spectra of GaBr3:
N.B: Click on images once to open a new window, and click again on the new image to play the animation.
Comparison of Vibrational Modes
N.B: Click on images once to open a new window, and click again on the new image to play the animation.
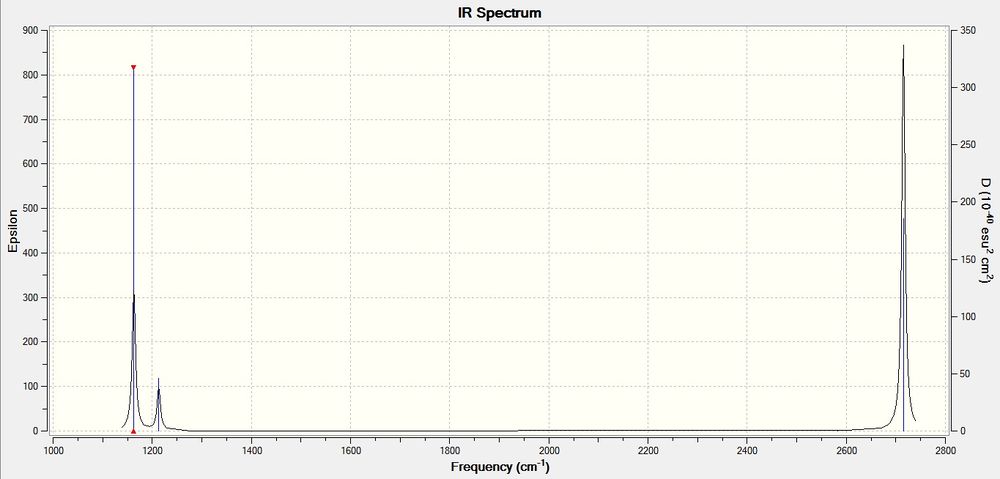
On immediate inspection, the the vibrational frequencies of BH33 are significantly higher than GaBr3. The frequency of vibrations is an indication of bond strength (i.e., higher frequency indicates stronger bonds, and vice versa). The stretching frequency of a bond can be derived from Hooke’s law, resulting in the following equation:
where ν is the vibrational frequency (cm–1), m1 and m2 are the mass of atoms 1 and 2 respectively in grams, c is the velocity of light (cm/s), and (m1m2/m1+m2) is the reduced mass, μ. [7]
Given that the reduced mass of a B-H bond is smaller than that of a Ga-Br bond, and that the vibrational frequency is inverse of the reduced mass, the vibrational frequency of BH3 molecules is larger than GaBr3, which is in agreement with the calculated frequencies.
Both structures also have six vibrational frequencies, as expected of isostructural, trigonal planar molecules. However, there is a reordering of the vibrational modes (i.e., A2", E1',E1',A1,E1',E1' in BH3 and E1', E1',A2',A1,E1',E1' in GaBr3.) This is because the A2" mode is at a higher energy compared to the lower energy E1' vibrations in GaBr3 due to the heavier mass of the Br atoms requiring higher energy to bend in and out of plane. In the case of BH3, the A2" mode is below the E1' vibrations due to the ease at which the light H atoms can bend in and out of plane.
In both spectra, there were only 3 peaks even though 6 vibrational modes were calculated. This is because the lower and higher E' vibrational modes are degenerate and only results in one peak each, and the A1' vibrational mode does not result in a IR peak as there is no change in dipole moment in this motion.
For both spectra two modes lie fairly closely together, the A2 and E' modes and then the other two modes also lie fairly close together, the A1' and E' modes, but higher in energy. This is because the lower E1' and A2" vibrational modes in both molecules exhibit identical rocking,scissoring and bending motions which are similar in energy, while the higher E1' modes and A2' vibrational modes are stretching motions which are similar in energy, albeit higher than the other motions. The higher energy is typical of stretching motions.
Molecular Orbital Calculation
A Molecular Orbital Analysis was performed on the previous 6-31G(D,P)optimized BH3 molecule.
| BH3 MO Summary | |
|---|---|
| File Type | .fch |
| Calculation Type | SP |
| Calculation Method | RB3LYP |
| Basis Set | 6-31G(D,P) |
| Final Energy (au) | -26.61532358 |
| Gradient (au) | 0.00000000 |
| Dipole Moment (Debye) | 0.0003 |
| Symmetry Point Group | Cs |
| Calculation CPU Time | 31.6 seconds |
The .log file of the MO analysis can be found here. DOI:10042/26965
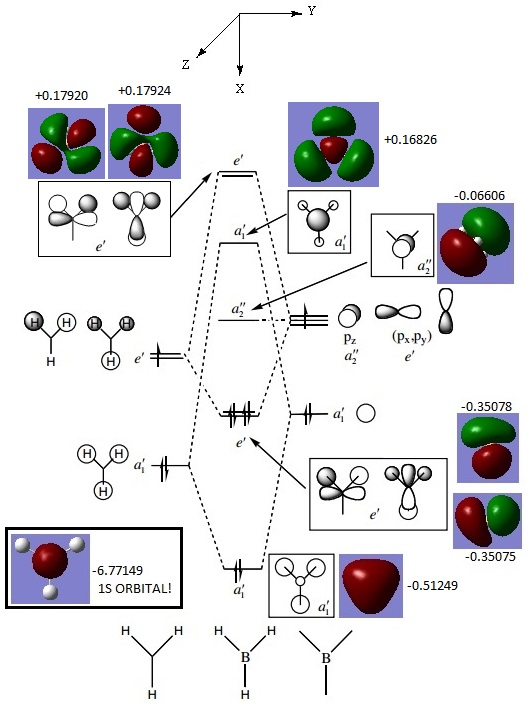
THe molecular orbitals obtained from this calculation is compared with a Molecular Orbital Diagram drawn using Linear Combination of Atomic Orbitals (LCAO), where the H atoms are considered as a H3 fragment. The comparison is shown below:
From the comparison, there are no significant differences between the calculated and LCAO molecular orbitals. This proves that LCAO qualitative MO theory is a very useful and quite accurate representation of real Molecular Orbitals. However, in several instances, in calculations from other students, the a1' antibonding orbital was calculated to be of higher energy than the degenerate e' antibonding orbitals. Although this was not the case in the above calculation, it must be noted that the energies of the a1' and e' antibonding orbitals are relatively similar at +0.16826, 0.17920 and +0.17924 respectively. This could be due to the fact that the 2s orbital of the B atom might be more similar in energy to the a1' H3 fragments than expected, thus resulting in a bigger splitting energy.
NBO Analysis
Optimization of NH3
| Optimised NH3 Molecule Summary | ||
|---|---|---|
| File Type | .log | |
| Calculation Type | FOPT | |
| Calculation Method | RB3LYP | |
| Basis Set | 6-31G(d,p) | |
| Final Energy (au) | -56.557769 | |
| Gradient (au) | 0.00000885 | |
| Dipole Moment (Debye) | 1.85 | |
| Symmetry Point Group | C1 | |
| Calculation CPU Time | 9.0 seconds | |
| H-N-H Bond Angle (°) | 105.7 | |
| N-H Bond Distance (Å) | 1.02 | |
A molecule of NH3 was optimized.
         Item               Value     Threshold  Converged?
 Maximum Force            0.000024     0.000450     YES
 RMS     Force            0.000012     0.000300     YES
 Maximum Displacement     0.000088     0.001800     YES
 RMS     Displacement     0.000056     0.001200     YES
 Predicted change in Energy=-1.779173D-09
 Optimization completed.
    -- Stationary point found.
                           ----------------------------
                           !   Optimized Parameters   !
                           ! (Angstroms and Degrees)  !
 --------------------------                            --------------------------
 ! Name  Definition              Value          Derivative Info.                !
 --------------------------------------------------------------------------------
 ! R1    R(1,2)                  1.018          -DE/DX =    0.0                 !
 ! R2    R(1,3)                  1.018          -DE/DX =    0.0                 !
 ! R3    R(1,4)                  1.018          -DE/DX =    0.0                 !
 ! A1    A(2,1,3)              105.7413         -DE/DX =    0.0                 !
 ! A2    A(2,1,4)              105.7486         -DE/DX =    0.0                 !
 ! A3    A(3,1,4)              105.7479         -DE/DX =    0.0                 !
 ! D1    D(2,1,4,3)           -111.8631         -DE/DX =    0.0                 !
 --------------------------------------------------------------------------------
 GradGradGradGradGradGradGradGradGradGradGradGradGradGradGradGradGradGrad
The calculated bond length and bond angle is in agreeement with literature. [8]
The optimisation .log file can be found here.
Frequency Analysis of Nh3
| NH3 Frequency Summary | |
|---|---|
| File Type | .log |
| Calculation Type | FREQ |
| Calculation Method | RB3LYP |
| Basis Set | 6-31G(d,p) |
| Final Energy (au) | -56.557769 |
| Gradient (au) | 0.00000081 |
| Dipole Moment (Debye) | 1.85 |
| Symmetry Point Group | C1 |
| Calculation CPU Time | 10.0 seconds |
A frequency analysis was performed on the previously optimized NH3 molecule with the following results.
 Low frequencies ---   -6.8430   -5.1179   -1.4050    0.0006    0.0010    0.0019
 Low frequencies --- 1089.3464 1693.9250 1693.9292
 Diagonal vibrational polarizability:
        3.3004196       0.1277142       0.1277138
 Harmonic frequencies (cm**-1), IR intensities (KM/Mole), Raman scattering
 activities (A**4/AMU), depolarization ratios for plane and unpolarized
 incident light, reduced masses (AMU), force constants (mDyne/A),
 and normal coordinates:
                      1                      2                      3
                      A                      A                      A
 Frequencies --   1089.3464              1693.9250              1693.9292
 Red. masses --      1.1800                 1.0644                 1.0644
 Frc consts  --      0.8250                 1.7995                 1.7995
 IR Inten    --    145.4303                13.5574                13.5573
  Atom  AN      X      Y      Z        X      Y      Z        X      Y      Z
     1   7     0.12   0.00   0.00     0.00   0.07  -0.01     0.00  -0.01  -0.07
     2   1    -0.53  -0.21   0.00     0.26   0.15   0.08    -0.03  -0.02   0.75
     3   1    -0.53   0.11   0.18    -0.11  -0.57   0.40     0.24  -0.33   0.04
     4   1    -0.53   0.11  -0.18    -0.15  -0.49  -0.38    -0.21   0.45   0.12
                      4                      5                      6
                      A                      A                      A
 Frequencies --   3461.3526              3589.8912              3589.9210
 Red. masses --      1.0272                 1.0883                 1.0883
 Frc consts  --      7.2512                 8.2638                 8.2639
 IR Inten    --      1.0592                 0.2698                 0.2699
  Atom  AN      X      Y      Z        X      Y      Z        X      Y      Z
     1   7     0.04   0.00   0.00     0.00   0.08   0.01     0.00  -0.01   0.08
     2   1    -0.18   0.55   0.00     0.31  -0.75   0.00    -0.04   0.11   0.02
     3   1    -0.18  -0.27  -0.47    -0.19  -0.22  -0.41    -0.24  -0.31  -0.51
     4   1    -0.18  -0.27   0.47    -0.12  -0.12   0.25     0.29   0.36  -0.60
The optimisation .log file can be found here.
The low frequencies corresponding to the vibrations of the center N nucleus is within ±15cm-1, which is acceptable, and all the real frequencies are positive, indicating that the potential energy surface is at a minimum.
Population Analysis
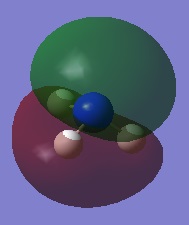
Having analysed the optimization and the vibrational modes of NH3, a population analysis was carried out using the "Energy" calculation method.
| NH3 Frequency Summary | |
|---|---|
| File Type | .chk |
| Calculation Type | SP |
| Calculation Method | RB3LYP |
| Basis Set | 6-31G(d,p) |
| Final Energy (au) | -56.55776872 |
| Gradient (au) | 0.00000000 |
| Dipole Moment (Debye) | 1.8465 |
| Symmetry Point Group | N/A |
| Calculation CPU Time | 10.0 seconds |
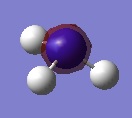 |
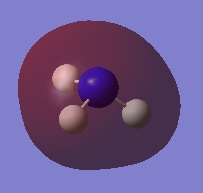 |
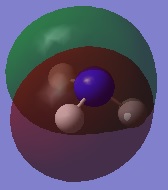 | |||
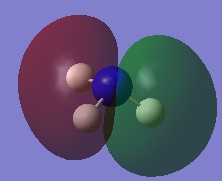 |
 | ||||
The optimisation .log file can be found here.
Charge Distribution Image of NH3
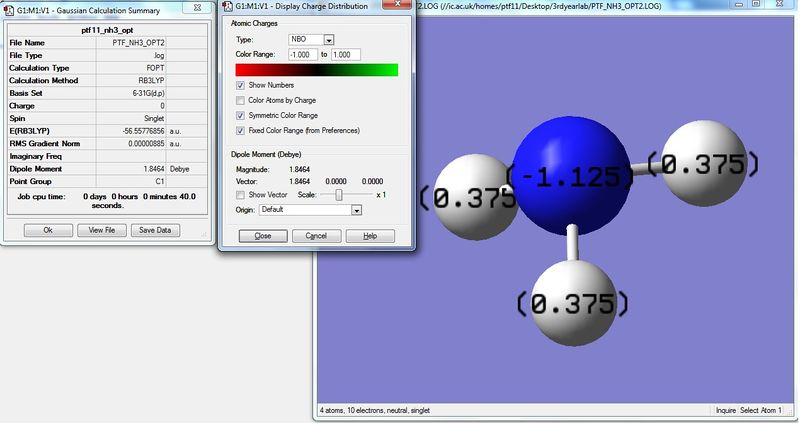
Using the NH3 MO .log file,an NBO analysis was performed, with the charge distribution range set to ±1.0.
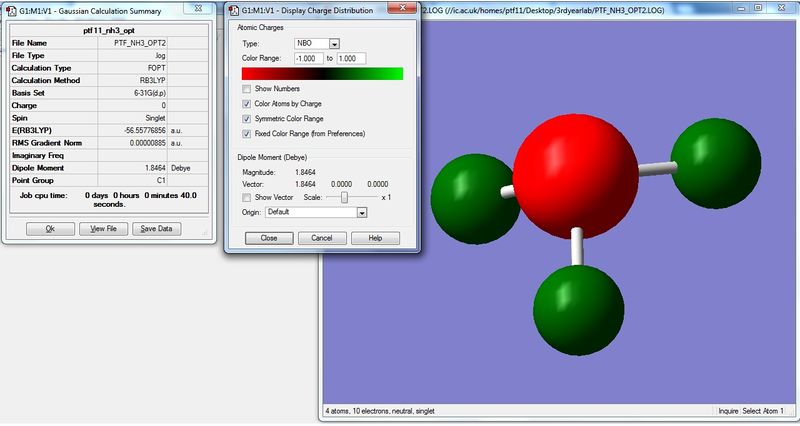
The NBO charges were then analysed as shown below.
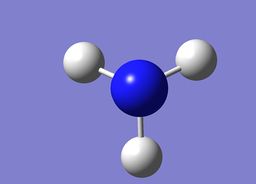
As expected, the charge distribution is negative around the N nuclei and positive around the H nuclei. This is due to the electronegative nature of Nitrogen, which withdraws electrons from the surrounding H atoms. As the NH3 molecule is trigonal pyramidal in shape, this results in a net dipole moment towards the Nitrogen lone pair.
 Summary of Natural Population Analysis:

                                       Natural Population
                Natural  -----------------------------------------------
    Atom  No    Charge         Core      Valence    Rydberg      Total
 -----------------------------------------------------------------------
      N    1   -1.12514      1.99982     6.11103    0.01429     8.12514
      H    2    0.37505      0.00000     0.62250    0.00246     0.62495
      H    3    0.37505      0.00000     0.62250    0.00246     0.62495
      H    4    0.37505      0.00000     0.62250    0.00246     0.62495
 =======================================================================
   * Total *    0.00000      1.99982     7.97852    0.02166    10.00000
The optimisation .log file can be found here.
Association energies: Ammonia-Borane
Ammonia-Borane Optimization
| Optimised NH3BH3 Molecule Summary | |
|---|---|
| File Type | .log |
| Calculation Type | FOPT |
| Calculation Method | RB3LYP |
| Basis Set | 6-31G(d,p) |
| Final Energy (au) | -83.24927997 |
| Gradient (au) | 0.00000082 |
| Dipole Moment (Debye) | 5.5176 |
| Symmetry Point Group | C1 |
| Calculation CPU Time | 130.0 seconds |
| N-B bond distance (Å) | 1.663 |
| N-H bond distance (Å) | 1.017 |
| B-H bond distance (Å) | 1.208 |
| H-N-H bond angle (°) | 107.8 |
| H-B-H bond angle (°) | 113.6 |
A molecule of NH3BH3 was optimized.
         Item               Value     Threshold  Converged?
 Maximum Force            0.000001     0.000015     YES
 RMS     Force            0.000001     0.000010     YES
 Maximum Displacement     0.000018     0.000060     YES
 RMS     Displacement     0.000007     0.000040     YES
 Predicted change in Energy=-3.883390D-11
 Optimization completed.
    -- Stationary point found.
                           ----------------------------
                           !   Optimized Parameters   !
                           ! (Angstroms and Degrees)  !
 --------------------------                            --------------------------
 ! Name  Definition              Value          Derivative Info.                !
 --------------------------------------------------------------------------------
 ! R1    R(1,7)                  1.0174         -DE/DX =    0.0                 !
 ! R2    R(2,7)                  1.0174         -DE/DX =    0.0                 !
 ! R3    R(3,7)                  1.0174         -DE/DX =    0.0                 !
 ! R4    R(4,8)                  1.208          -DE/DX =    0.0                 !
 ! R5    R(5,8)                  1.208          -DE/DX =    0.0                 !
 ! R6    R(6,8)                  1.208          -DE/DX =    0.0                 !
 ! R7    R(7,8)                  1.6634         -DE/DX =    0.0                 !
 ! A1    A(1,7,2)              107.8011         -DE/DX =    0.0                 !
 ! A2    A(1,7,3)              107.8011         -DE/DX =    0.0                 !
 ! A3    A(1,7,8)              111.0938         -DE/DX =    0.0                 !
 ! A4    A(2,7,3)              107.801          -DE/DX =    0.0                 !
 ! A5    A(2,7,8)              111.0937         -DE/DX =    0.0                 !
 ! A6    A(3,7,8)              111.0937         -DE/DX =    0.0                 !
 ! A7    A(4,8,5)              113.6408         -DE/DX =    0.0                 !
 ! A8    A(4,8,6)              113.6408         -DE/DX =    0.0                 !
 ! A9    A(4,8,7)              104.8861         -DE/DX =    0.0                 !
 ! A10   A(5,8,6)              113.6409         -DE/DX =    0.0                 !
 ! A11   A(5,8,7)              104.8864         -DE/DX =    0.0                 !
 ! A12   A(6,8,7)              104.8864         -DE/DX =    0.0                 !
 ! D1    D(1,7,8,4)            179.9999         -DE/DX =    0.0                 !
 ! D2    D(1,7,8,5)            -60.0001         -DE/DX =    0.0                 !
 ! D3    D(1,7,8,6)             60.0            -DE/DX =    0.0                 !
 ! D4    D(2,7,8,4)            -60.0            -DE/DX =    0.0                 !
 ! D5    D(2,7,8,5)             60.0            -DE/DX =    0.0                 !
 ! D6    D(2,7,8,6)           -179.9999         -DE/DX =    0.0                 !
 ! D7    D(3,7,8,4)             59.9999         -DE/DX =    0.0                 !
 ! D8    D(3,7,8,5)            179.9998         -DE/DX =    0.0                 !
 ! D9    D(3,7,8,6)            -60.0001         -DE/DX =    0.0                 !
 --------------------------------------------------------------------------------
 GradGradGradGradGradGradGradGradGradGradGradGradGradGradGradGradGradGrad
The optimisation .log file can be found here.
Ammonia-Borane Vibrational Analysis
|
A frequency calculation of the output file of the optimized Ammonia-Borane molecule was then performed to ensure a minimum has been achieved. The lower frequencies are found to be within ±15cm-1. Low frequencies --- -2.2121 -1.1044 -0.0001 0.0004 0.0005 4.3753 Low frequencies --- 275.7041 637.5771 653.7000 Item Value Threshold Converged?
Maximum Force 0.000003 0.000450 YES
RMS Force 0.000001 0.000300 YES
Maximum Displacement 0.000020 0.001800 YES
RMS Displacement 0.000011 0.001200 YES
Predicted change in Energy=-5.220274D-11
Optimization completed.
-- Stationary point found.
The frequency calculation .log file can be found here. | ||||||||||||||||||||||
Energy Calculation
| E(NH3) | E(BH3) | E(NH3BH3 |
|---|---|---|
| -56.557769 | -26.615323 | -83.249280 |
Thus, the energy difference (au) is
ΔE = E(NH<sub>3</sub>BH<sub>3</sub>)-[E(NH<sub>3</sub>)+E(BH<sub>3</sub>)]
   = -83.249280 - (-56.557769 - 26.615323)
   = -0.076188 (au)
   = -200 KJ/mol
The calculated bond energy of -200±10 KJ/mol (around -47.8kcal/mol) is of agreeable magnitude when compared to other energetic interactions in Ammonia Borane. [9] The negative value of the bond energy means that the energy level of ammonia borane is lower than the combined energy of NH3 and BH3. Thus, ammonia borane is a thermodynamically stable molecule and its formation is favorable and exothermic. The dissociation energy is the inverse of the bond energy, which is a positive value. This means that energy is required to break the B-N bond.
Aromaticity Computation (Week 2)
Benzene
Benzene Optimization
|
         Item               Value     Threshold  Converged?
 Maximum Force            0.000013     0.000015     YES
 RMS     Force            0.000004     0.000010     YES
 Maximum Displacement     0.000054     0.000060     YES
 RMS     Displacement     0.000017     0.000040     YES
 Predicted change in Energy=-1.965794D-09
 Optimization completed.
    -- Stationary point found.
The calculated bond lengths and bond angle is in agreement with literature. [10] The .log file can be found here. DOI:10042/27275 | |||||||||||||||||||||||||||||||
Benzene Vibrational Analysis
|
 Low frequencies ---   -5.0211   -4.6278   -0.0006   -0.0002    0.0003    3.2465
 Low frequencies ---  414.5375  414.5498  621.0653
Item Value Threshold Converged?
Maximum Force 0.000023 0.000450 YES
RMS Force 0.000009 0.000300 YES
Maximum Displacement 0.000048 0.001800 YES
RMS Displacement 0.000020 0.001200 YES
Predicted change in Energy=-1.970070D-09
Optimization completed.
-- Stationary point found.
Full Convergence was achieved, the low frequency values are within an acceptable ±15cm-1, and all the "real" vibrational frequencies are positive in value, thus, the minimum in the Potential Energy Surface has been achieved. The .log file can be found here. DOI:10042/27276 | ||||||||||||||||||||||
Molecular Orbital Analysis
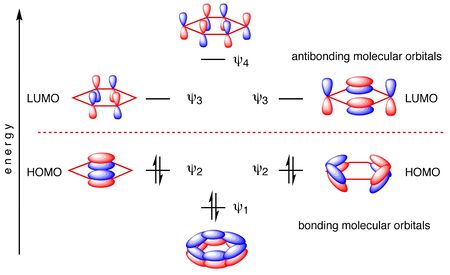
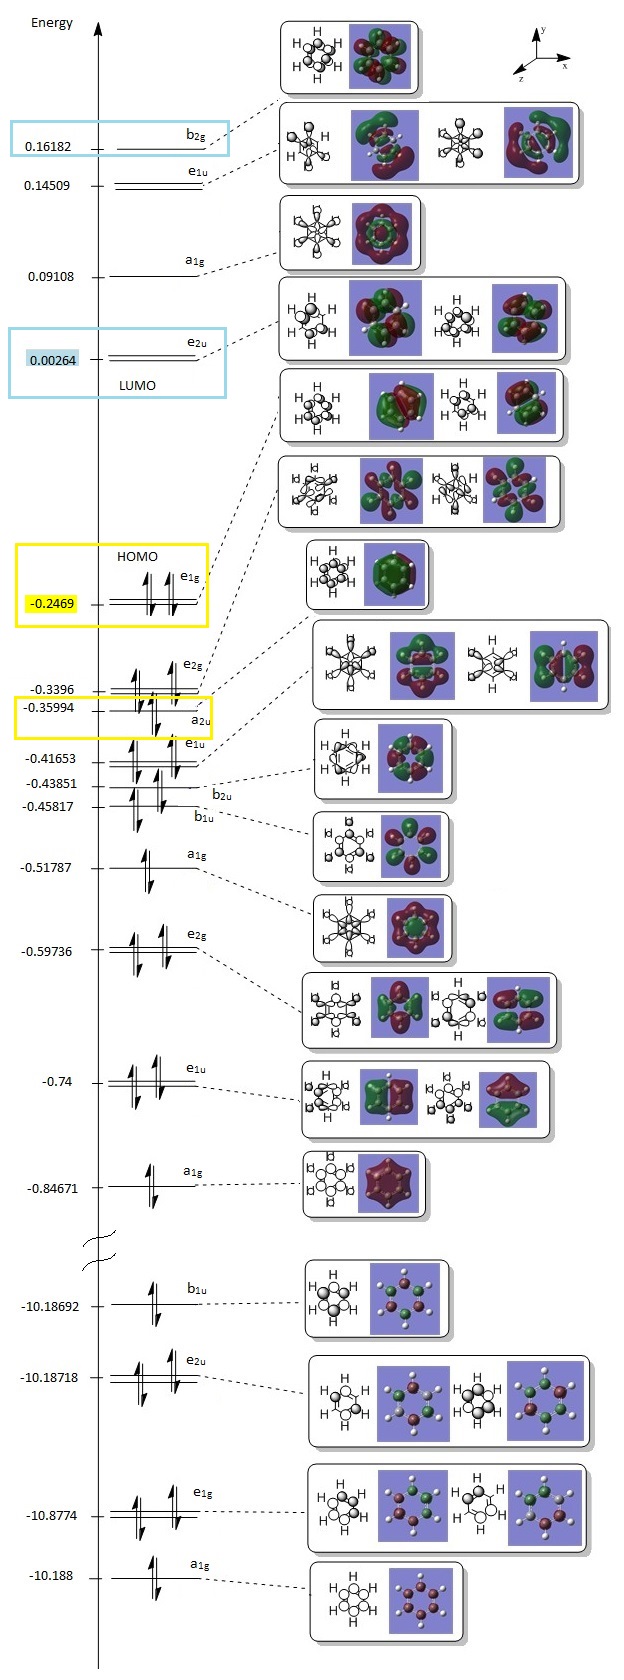
The .log file can be found here. DOI:10042/27277 Aromaticity is defined as the effect in which a conjugated ring of unsaturated bonds, lone pairs, or empty orbitals exhibits a stabilization stronger than would be expected by the stabilization of conjugation alone. It is considered to be a manifestation of cyclic delocalization and of resonance.[11] Aromaticity is only provided to a molecule upon possessing four specific qualities, namely; 1. Pi bonds must lie within the cyclic structure. 2. Each atom in the cycle must possess a p-orbital, forming a p-orbital loop. 3. All p-orbitals in the loop must overlap. (Planarity) 4. Molecule must obey Huckel's Rule (4n+2 pi electrons in the loop, where n is an integer), where orbital rearrangement will result in a lowering of energy. In the calculated MO diagram of benzene, it is observed that the molecular orbitals highlighted possesses out-of-plane clouds of electron density. It is fair to deduce that these molecular orbitals correspond to the aforementioned delocalised p-orbitals which has formed a loop. It is also noteworthy that these particular Molecular Orbitals correspond to the "textbook" molecular orbitals often used to describe the aromatic nature of benzene, as shown below.[12]
Additionally, in these highlighted molecules, the occupancy is 6 electrons. This means that there are 6 delocalised elctrons in the benzene molecule, which satisfies Huckel's Rule for Aromaticity. Notice that the energy difference between the delocalised b2g orbital and the LUMO is larger than the energy difference between the delocalised a2u orbital and the HOMO. While this energy difference is normally depicted to be equal, the calculated MOs are more representative of actual values, as destabilization energy for antibonding orbitals are always larger than the stabilizing energy for bonding orbitals. Almost all textbooks include only the pi orbitals when they discuss benzene, but in reality, there are many sigma orbtials that are interleved with the pi MOs. These orbitals involve the the s-orbitals of the H fragments, which tend to be ignored as textbooks use molecular orbitals to explain aromaticity. Also noteworthy are the 6 lowest energy occupied Molecular Orbitals, which are significantly much lower in energy than the other MO energies. These MOs correspond to the 2s orbitals of the Carbon atoms (2 electrons for each Carbon atom), which shows that these electrons do not participate in delocalization, thus, not contributing to the aromaticity. |
|||||||||||||||||||||||
NBO Analysis of Benzene
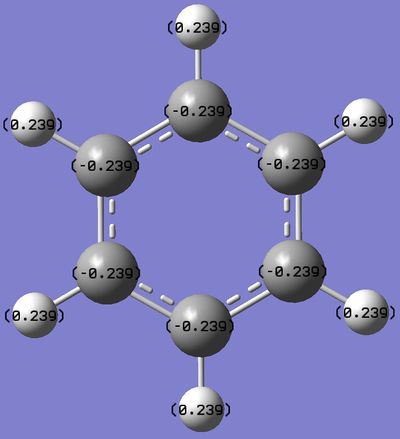
The .log file can be found here. DOI:10042/27277 Using the Benzene MO .log file,an NBO analysis was performed, with the charge distribution range set to ±1.0. Summary of Natural Population Analysis:
Natural Population
Natural -----------------------------------------------
Atom No Charge Core Valence Rydberg Total
-----------------------------------------------------------------------
C 1 -0.23859 1.99910 4.22617 0.01331 6.23859
C 2 -0.23859 1.99910 4.22617 0.01331 6.23859
C 3 -0.23859 1.99910 4.22617 0.01331 6.23859
C 4 -0.23859 1.99910 4.22617 0.01331 6.23859
C 5 -0.23859 1.99910 4.22617 0.01331 6.23859
C 6 -0.23859 1.99910 4.22617 0.01331 6.23859
H 7 0.23859 0.00000 0.75998 0.00144 0.76141
H 8 0.23859 0.00000 0.75998 0.00144 0.76141
H 9 0.23859 0.00000 0.75998 0.00144 0.76141
H 10 0.23859 0.00000 0.75998 0.00144 0.76141
H 11 0.23859 0.00000 0.75998 0.00144 0.76141
H 12 0.23859 0.00000 0.75998 0.00144 0.76141
=======================================================================
* Total * 0.00000 11.99462 29.91690 0.08847 42.00000
This analysis indicates that all carbon atoms in the molecule share the same distribution of electron cloud around the ring. There is also a pull electron density away from the Hydrogen atoms, which seems to agree with the theory that benzene has a delocalized electron ring above and below the planar ring. Also, carbon is more electronegative than Hydrogen, thus pulling electron density away from the Hydrogen atoms. |
|||||||||||||||||||||||
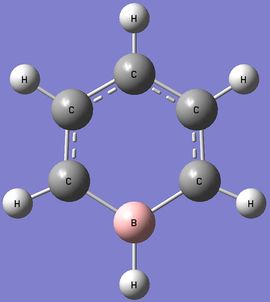
Boratabenzene
Boratabenzene Optimization
|
         Item               Value     Threshold  Converged?
 Maximum Force            0.000010     0.000015     YES
 RMS     Force            0.000002     0.000010     YES
 Maximum Displacement     0.000045     0.000060     YES
 RMS     Displacement     0.000013     0.000040     YES
 Predicted change in Energy=-6.760325D-10
 Optimization completed.
    -- Stationary point found.
The calculated bond lengths and bond angle is in agreement with literature. [13] The .log file can be found here. DOI:10042/27284 | |||||||||||||||||||||||||||||||||||||||||||||||||
Boratabenzene Vibrational Analysis
|
 Low frequencies ---   -7.2703   -0.0009   -0.0008   -0.0007    3.1509    4.5207
 Low frequencies ---  371.2965  404.4156  565.0825
Item Value Threshold Converged?
Maximum Force 0.000022 0.000450 YES
RMS Force 0.000005 0.000300 YES
Maximum Displacement 0.000052 0.001800 YES
RMS Displacement 0.000019 0.001200 YES
Predicted change in Energy=-8.985093D-10
Optimization completed.
-- Stationary point found.
Full Convergence was achieved, the low frequency values are within an acceptable ±15cm-1, and all the "real" vibrational frequencies are positive in value, thus, the minimum in the Potential Energy Surface has been achieved. The .log file can be found here. DOI:10042/27285 | ||||||||||||||||||||||
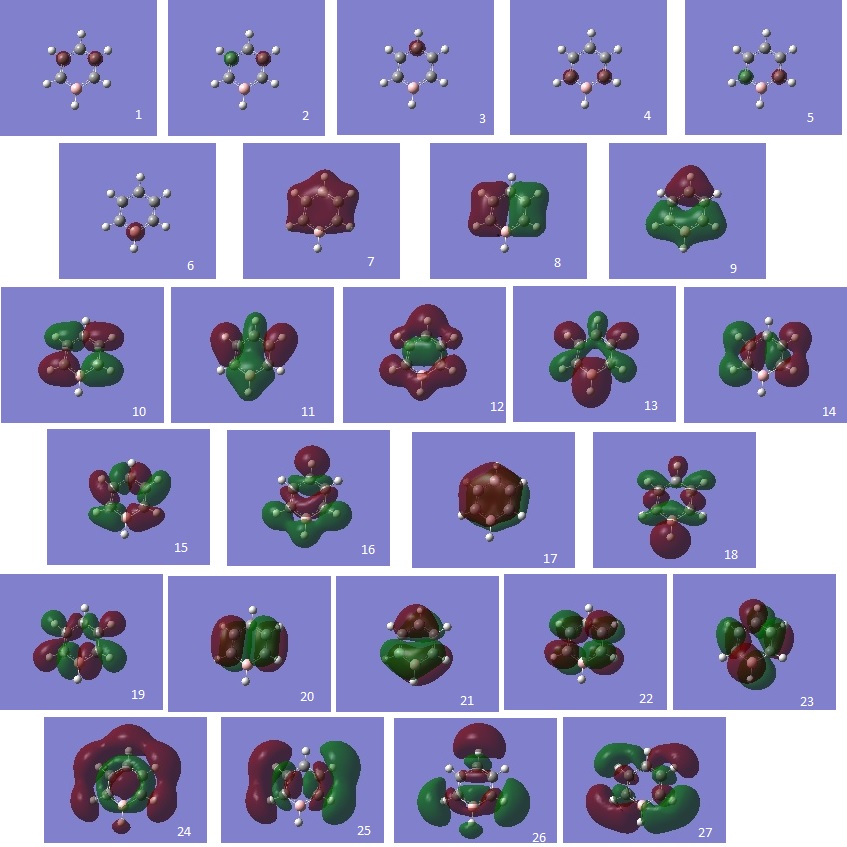
Boratabenzene MO analysis
The .log file can be found here. DOI:10042/27286 |
|||||||||||||||||||||||
Boratabenzene NBO Analysis
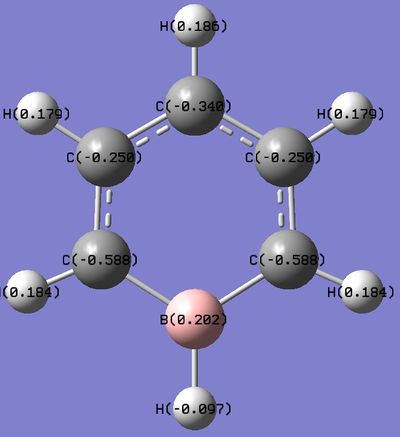
The .log file can be found here. DOI:10042/27306 Using the Boratabenzene MO .log file,an NBO analysis was performed, with the charge distribution range set to ±1.0. Summary of Natural Population Analysis:
Natural Population
Natural -----------------------------------------------
Atom No Charge Core Valence Rydberg Total
-----------------------------------------------------------------------
C 1 -0.25033 1.99910 4.23710 0.01413 6.25033
C 2 -0.34002 1.99907 4.32711 0.01384 6.34002
C 3 -0.25033 1.99910 4.23710 0.01413 6.25033
C 4 -0.58806 1.99901 4.57726 0.01178 6.58806
C 5 -0.58805 1.99901 4.57725 0.01178 6.58805
H 6 0.17899 0.00000 0.81838 0.00263 0.82101
H 7 0.18574 0.00000 0.81227 0.00199 0.81426
H 8 0.17899 0.00000 0.81838 0.00263 0.82101
H 9 0.18385 0.00000 0.81397 0.00218 0.81615
H 10 -0.09650 0.00000 1.09596 0.00054 1.09650
H 11 0.18385 0.00000 0.81397 0.00218 0.81615
B 12 0.20186 1.99906 2.78748 0.01160 4.79814
=======================================================================
* Total * -1.00000 11.99436 29.91623 0.08941 42.00000
As Boron is less electronegative than carbon and hydrogen, it would lose electron density.This is reflected in the NBO calculation, where the Boron atom was found with a positive charge.Interestingly, the ortho-carbon possesses the greatest negative charge distribution (-0.588), followed by the C atom at the para position (-0.340), and the meta-carbon with the least positive charge.(-0.250). As seen from the resonance forms above, the negative charge is quite likely to stay in the ortho and para positions, thus rationalizing the NBO charge distribution. However, the negative charge is better stabilized at the ortho carbons than the para carbon. Thia is because it is unfavourable to have a negative charge on the Boron atom which is the least electronegative. Also, note that the hydrogen atom bonded to the Boron atoms have a higher electron density than the hydrogen atoms that are bonded to the Carbon atoms, and the charge distribution differs on the Hydrogen atoms attached to different Carbon atoms. The trend is that the Hydrogen atom will have less electron density and consequently, a more positive charge if the atom it is bonded to has a higher electron density and more negative charge (i.e. an inverse relationship with the nature of the atom it is bonded to). This is expected, as more electron withdrawing atoms in the ring will withdraw more electron density from the H atom it is bonded to. |
|||||||||||||||||||||||
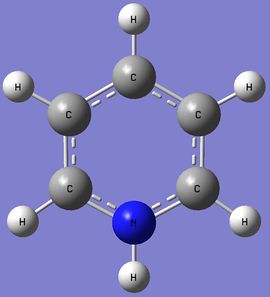
Pyridinium
Pyridinium Optimization
|
         Item               Value     Threshold  Converged?
 Maximum Force            0.000004     0.000015     YES
 RMS     Force            0.000001     0.000010     YES
 Maximum Displacement     0.000012     0.000060     YES
 RMS     Displacement     0.000004     0.000040     YES
 Predicted change in Energy=-9.588034D-11
 Optimization completed.
    -- Stationary point found.
The calculated bond lengths and bond angle is in agreement with literature. [14] The .log file can be found here. DOI:10042/27287 | ||||||||||||||||||||||||||||||||||||||||||||||||||||
Pyridinium Vibrational Analysis
|
 Low frequencies ---   -9.3845   -2.9473    0.0005    0.0011    0.0012    0.8646
 Low frequencies ---  391.9004  404.3424  620.1995
Item Value Threshold Converged?
Maximum Force 0.000006 0.000450 YES
RMS Force 0.000002 0.000300 YES
Maximum Displacement 0.000009 0.001800 YES
RMS Displacement 0.000005 0.001200 YES
Predicted change in Energy=-1.153655D-10
Optimization completed.
-- Stationary point found.
Full Convergence was achieved, the low frequency values are within an acceptable ±15cm-1, and all the "real" vibrational frequencies are positive in value, thus, the minimum in the Potential Energy Surface has been achieved. The .log file can be found here. DOI:10042/27294 | ||||||||||||||||||||||
Pyridinium MO Analysis
The .log file can be found here. DOI:10042/27295 |
|||||||||||||||||||||||
Pyridinium NBO Analysis
The .log file can be found here. DOI:10042/27295 Using the Pyridinium MO .log file,an NBO analysis was performed, with the charge distribution range set to ±1.0. Summary of Natural Population Analysis:
Natural Population
Natural -----------------------------------------------
Atom No Charge Core Valence Rydberg Total
-----------------------------------------------------------------------
C 1 -0.24107 1.99912 4.22863 0.01331 6.24107
C 2 -0.12238 1.99913 4.10938 0.01386 6.12238
C 3 -0.24107 1.99912 4.22863 0.01331 6.24107
C 4 0.07102 1.99918 3.91065 0.01916 5.92898
C 5 0.07101 1.99918 3.91065 0.01916 5.92899
H 6 0.29720 0.00000 0.70178 0.00103 0.70280
H 7 0.29169 0.00000 0.70719 0.00113 0.70831
H 8 0.29720 0.00000 0.70178 0.00103 0.70280
H 9 0.28493 0.00000 0.71397 0.00110 0.71507
H 10 0.48278 0.00000 0.51476 0.00246 0.51722
H 11 0.28493 0.00000 0.71397 0.00110 0.71507
N 12 -0.47623 1.99937 5.46757 0.00929 7.47623
=======================================================================
* Total * 1.00000 11.99510 29.90895 0.09595 42.00000
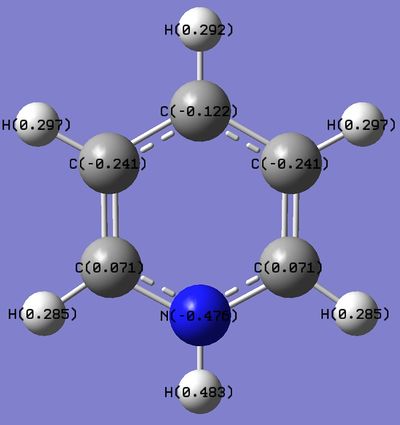
Nitrogen is much more electronegative atom than Carbon and Hydrogen. This is reflected by the high electron density and negative charge around the N nucleus. Furthermore, the H atom bonded directly to the N atom is highly electron deficiency, having a much higher positive charge than other H atoms in the ring. Contrastingly from the Boratabenzene molecule, the Carbon nuclei at the meta positions have the highest negative charge (-0.241), followed by the para C nucleus (-0.122), while the C nuclei ortho to the Nitrogen atom actually has a positive charge. Similiarly, the H atoms would have an inverse character to the atom it is bonded to (i.e. H atoms bonded to atoms with a more negative charge would have a more positive charge, and vice versa), due to the electron density withdrawing effects. This difference in the electron densities can be similarly explained with resonance forms, albeit different from the Boratabenzene resonances. As seen from the resonance form, the positive charge will be stable in the ortho and para positions. Thus, this results in the carbon atoms in these positions experiencing a greater positive charge, losing electron density. The reason why the positive charge is more stable at the ortho position is because the electronegative Nitrogen withdraws electron density from surrounding atoms, thus stabilizing the resonance forms which have a positive charge on the neighboring ortho Carbon. |
|||||||||||||||||||||||
Borazine
Borazine Optimization
|
         Item               Value     Threshold  Converged?
 Maximum Force            0.000009     0.000015     YES
 RMS     Force            0.000003     0.000010     YES
 Maximum Displacement     0.000027     0.000060     YES
 RMS     Displacement     0.000008     0.000040     YES
 Predicted change in Energy=-4.830915D-10
 Optimization completed.
    -- Stationary point found.
The calculated bond lengths and bond angle is in agreement with literature. [15] The .log file can be found here. DOI:10042/27278 | |||||||||||||||||||||||||||||||||||||||||||
Borazine Vibrational Analysis
|
 Low frequencies ---   -7.0664   -0.0007   -0.0006   -0.0002    4.6504    7.6127
 Low frequencies ---  289.5838  289.7181  404.4548
Item Value Threshold Converged?
Maximum Force 0.000012 0.000450 YES
RMS Force 0.000004 0.000300 YES
Maximum Displacement 0.000042 0.001800 YES
RMS Displacement 0.000018 0.001200 YES
Predicted change in Energy=-7.013196D-10
Optimization completed.
-- Stationary point found.
Full Convergence was achieved, the low frequency values are within an acceptable ±15cm-1, and all the "real" vibrational frequencies are positive in value, thus, the minimum in the Potential Energy Surface has been achieved. The .log file can be found here. DOI:10042/27279 | ||||||||||||||||||||||
Borazine MO Analysis
The .log file can be found here. DOI:10042/27280 |
|||||||||||||||||||||||
Borazine NBO Analysis
The .log file can be found here. DOI:10042/27280 Using the Borazine MO .log file,an NBO analysis was performed, with the charge distribution range set to ±1.0. Summary of Natural Population Analysis:
Natural Population
Natural -----------------------------------------------
Atom No Charge Core Valence Rydberg Total
-----------------------------------------------------------------------
H 1 -0.07654 0.00000 1.07585 0.00069 1.07654
H 2 0.43201 0.00000 0.56571 0.00228 0.56799
H 3 -0.07654 0.00000 1.07585 0.00069 1.07654
H 4 0.43200 0.00000 0.56571 0.00228 0.56800
H 5 -0.07654 0.00000 1.07584 0.00069 1.07654
H 6 0.43200 0.00000 0.56571 0.00228 0.56800
B 7 0.74693 1.99917 2.23868 0.01521 4.25307
B 8 0.74694 1.99917 2.23868 0.01521 4.25306
B 9 0.74693 1.99917 2.23868 0.01521 4.25307
N 10 -1.10241 1.99943 6.09820 0.00478 8.10241
N 11 -1.10240 1.99943 6.09820 0.00478 8.10240
N 12 -1.10241 1.99943 6.09820 0.00478 8.10241
=======================================================================
* Total * 0.00000 11.99579 29.93530 0.06891 42.00000
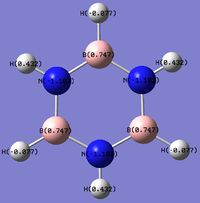
The charge distribution and electron density of the borazine molecule is largely due to the electronegativities of the atoms in the ring. Nitrogen is one of the most electronegative atoms in the periodic table, while Boron rather electropositive. This is highly reflected in the borazine molecule, where the electron density in the ring is concentrated among the Nitrogen nuclei, while the lack of electron affinity from the Boron atoms cause it to lose electron density, thus accumulating a positive charge. The electron densities of the H atoms are unsurprising; H atoms bonded to electron withdrawing N atoms will have reduced electron density and a more positive charge, while H atoms bonded to the electropositive B atoms retain electron density, thus gaining a more negative charge. The different electron densities are distributed in a symmetric manner among the electronegative and electropositive elements respectively. |
|||||||||||||||||||||||
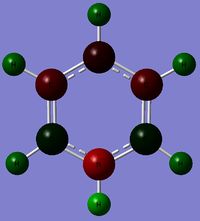
Charge Distribution (CD) Comparison
| Molecule | CD by Color | Numerical CD |
|---|---|---|
 |
 |
|
 |
 |

|
 |
 |

|
 |
 |
|
N.B: For the viewer's convenience, certain sections from the NBO analysis of the different compounds are repeated here, however further analysis is carried out in this section.
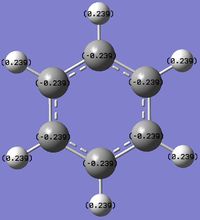
The Benzene NBO analysis indicates that all carbon atoms in the molecule share the same distribution of electron cloud around the ring. There is also a pull electron density away from the Hydrogen atoms, which seems to agree with the theory that benzene has a delocalized electron ring above and below the planar ring. Also, carbon is more electronegative than Hydrogen, thus pulling electron density away from the Hydrogen atoms.
In the Boratabenzene molecule however, as Boron is less electronegative than carbon and hydrogen, it would lose electron density.This is reflected in the NBO calculation, where the Boron atom was found with a positive charge.Interestingly, the ortho-carbon possesses the greatest negative charge distribution (-0.588), followed by the C atom at the para position (-0.340), and the meta-carbon with the least positive charge.(-0.250).
As seen from the resonance forms above, the negative charge is quite likely to stay in the ortho and para positions, thus rationalizing the NBO charge distribution. However, the negative charge is better stabilized at the ortho carbons than the para carbon. Thia is because it is unfavourable to have a negative charge on the Boron atom which is the least electronegative. Also, note that the hydrogen atom bonded to the Boron atoms have a higher electron density than the hydrogen atoms that are bonded to the Carbon atoms, and the charge distribution differs on the Hydrogen atoms attached to different Carbon atoms. The trend is that the Hydrogen atom will have less electron density and consequently, a more positive charge if the atom it is bonded to has a higher electron density and more negative charge (i.e. an inverse relationship with the nature of the atom it is bonded to). This is expected, as more electron withdrawing atoms in the ring will withdraw more electron density from the H atom it is bonded to.
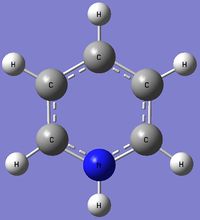
The pyridinium molecule exhibits a different Charge Distribution. Nitrogen is much more electronegative atom than Carbon and Hydrogen. This is reflected by the high electron density and negative charge around the N nucleus. Furthermore, the H atom bonded directly to the N atom is highly electron deficiency, having a much higher positive charge than other H atoms in the ring. Contrastingly from the Boratabenzene molecule, the Carbon nuclei at the meta positions have the highest negative charge (-0.241), followed by the para C nucleus (-0.122), while the C nuclei ortho to the Nitrogen atom actually has a positive charge. Similiarly, the H atoms would have an inverse character to the atom it is bonded to (i.e. H atoms bonded to atoms with a more negative charge would have a more positive charge, and vice versa), due to the electron density withdrawing effects. This difference in the electron densities can be similarly explained with resonance forms, albeit different from the Boratabenzene resonances.
As seen from the resonance form, the positive charge will be stable in the ortho and para positions. Thus, this results in the carbon atoms in these positions experiencing a greater positive charge, losing electron density. The reason why the positive charge is more stable at the ortho position is because the electronegative Nitrogen withdraws electron density from surrounding atoms, thus stabilizing the resonance forms which have a positive charge on the neighboring ortho Carbon.
The charge distribution and electron density of the borazine molecule is largely due to the electronegativities of the atoms in the ring. Nitrogen is one of the most electronegative atoms in the periodic table, while Boron rather electropositive. This is highly reflected in the borazine molecule, where the electron density in the ring is concentrated among the Nitrogen nuclei, while the lack of electron affinity from the Boron atoms cause it to lose electron density, thus accumulating a positive charge. The electron densities of the H atoms are unsurprising; H atoms bonded to electron withdrawing N atoms will have reduced electron density and a more positive charge, while H atoms bonded to the electropositive B atoms retain electron density, thus gaining a more negative charge. The different electron densities are distributed in a symmetric manner among the electronegative and electropositive elements respectively.
The effect of the differing electronegativities actually goes beyond electron density and charge. By referencing the bond distances documented in the Borazine optimzation, the N atoms, which withdraws electron density form its neighboring H atom, actually causes the N-H bond length to be shorter, while the B atoms, which loses electron density, have a much longer B-H bond length. This is very different from Benzene (which is isoelectronic and isostructural to Borazine), where all C-H bonds are similar in length.
The shortening of N-H bonds and the lengthening of B-H bonds are also apparent in the Boratabenzene and Pyridinium Molecules. However, due to the assymetric nature of these compounds, the effect of these different bond strengths also affect the Bond Angles. These are detailed in the following diagram.
Molecular Orbital Comparison
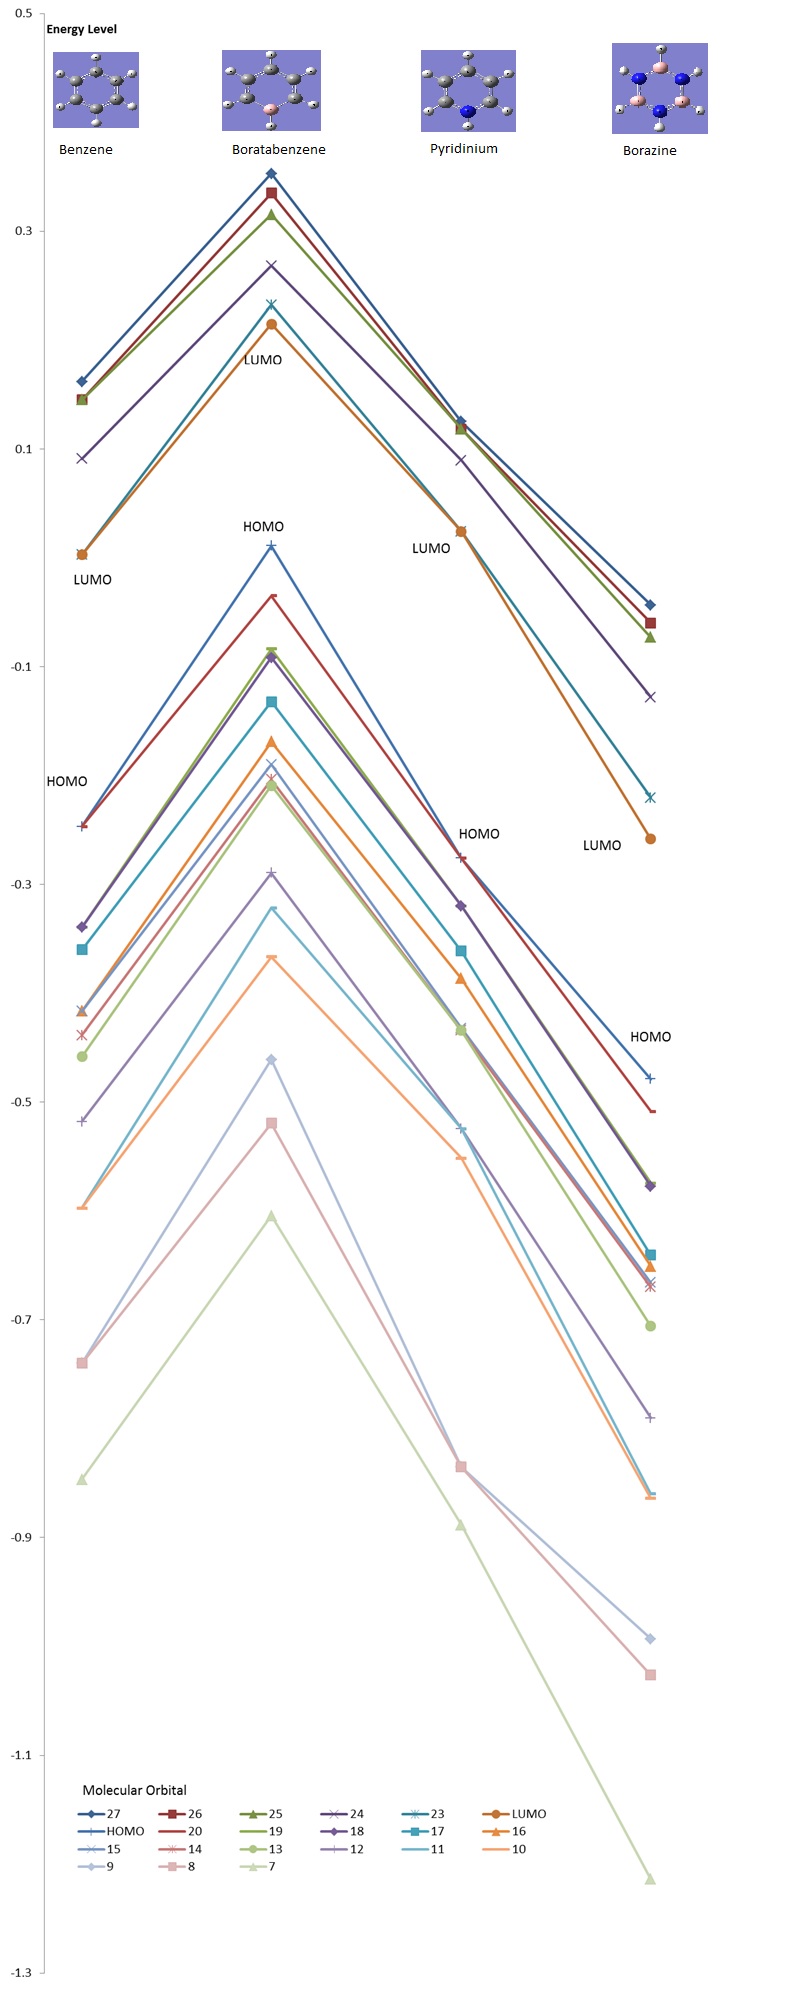
The molecular orbital energies of Benzene, Boratabenzene, Pyridinium, and Borazine were calculated and the relative energies are summarized in the graph below. Low-lying MOs from the contributions of the 2s-orbitals of the ring atoms are excluded due to the sheer difference in magnitude.
HOMO comparisons (Energy Level 20 + Energy Level 21)
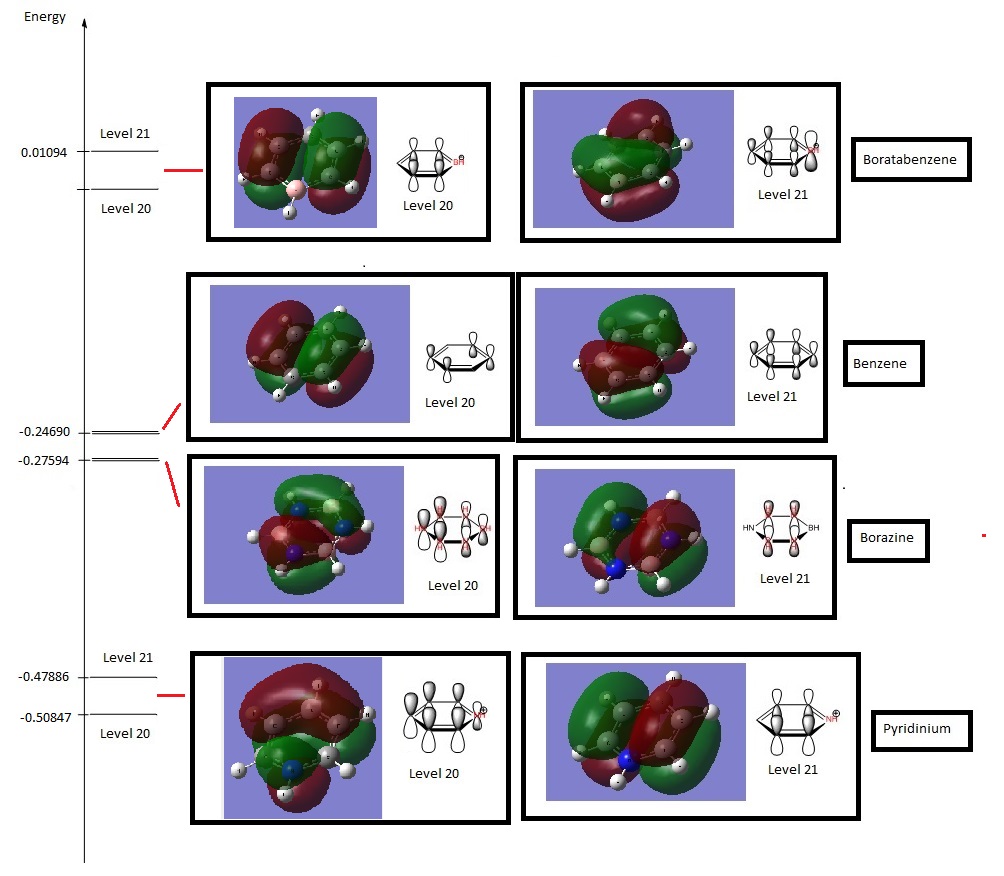
The HOMO of each compound was compared in terms of energy and shape.
The most immediate observation to make when comparing the HOMO of the compounds is that the HOMO of Benzene and Borazine are two degenerate MOs with the same energy (Levels 20 & 21), while the HOMOs of Boratabenzene and Pyridinium are non-degenerate (Level 21). This is due to the higher symmetry of Borazine and Benzene, which allows for degeneracy. However, Boratabenzene and Pyridinium, having substituted one carbon atom in the ring for a Nitrogen or Boron atom, has much lower symmetry.
Secondly, it was observed that the MOs of Boratabenzene are the highest in energy, followed by Benzene, Borazine, and Pyridinium, in descending order of MO energy. This is due to the general electronegativies of the compounds. As Nitrogen is a very electronegative element, Pyridinium's MO energy is lower, while Boratabenzene is high in energy due to the electropositivity of Boron. In Borazine, although there is an equal number of N & B atoms, the electronegativity of the N atom dominates (N is one of the most electtronegative elements in the Periodic Table), thus the HOMO energy is lower than that of Benzene.
The next observation is that the shape of the MOs Level 20 & 21 are quite similar for all molecules. One of the MOs is a LCAO of 4 pz orbitals, where the adjacent orbitals are bonding in nature but the pair opposite to it on the other side of the ring are antibonding to it. The other MO is an LCAO composed of 6 pz orbitals, of which 3 will form bonding interactions, but the opposite trio will be anti-bonding to the original 3. However, we notice that the ordering of these MOs change between Borazine and Benzene. In Borazine and Pyridinium, which are lower in energy, the LCAO of the 4 pz orbitals are higher in energy, but in Benzene and Boratabenzene, it is lower in energy. The opposite is true for the LCAO of 6 pz orbitals. While the exact reason for this reordering is not fully understood, it is believed that this effect is due to the different electronegativities.
Alhtough the shape of the LCAOs are the similar for all the molecules, there is a difference in the coefficient of the separate pz orbitals. In Benzene, there are two delocalised electron densities out of the planar molecule that are equal in density.However, when a Carbon atom is substituted with boron or nitrogen, the p orbital at boron will be larger while the p orbital at nitrogen would be smaller. As this is an antibonding orbital, the electron density would then have a larger density at more electropositive atoms, which is the opposite of bonding orbital characteristics.
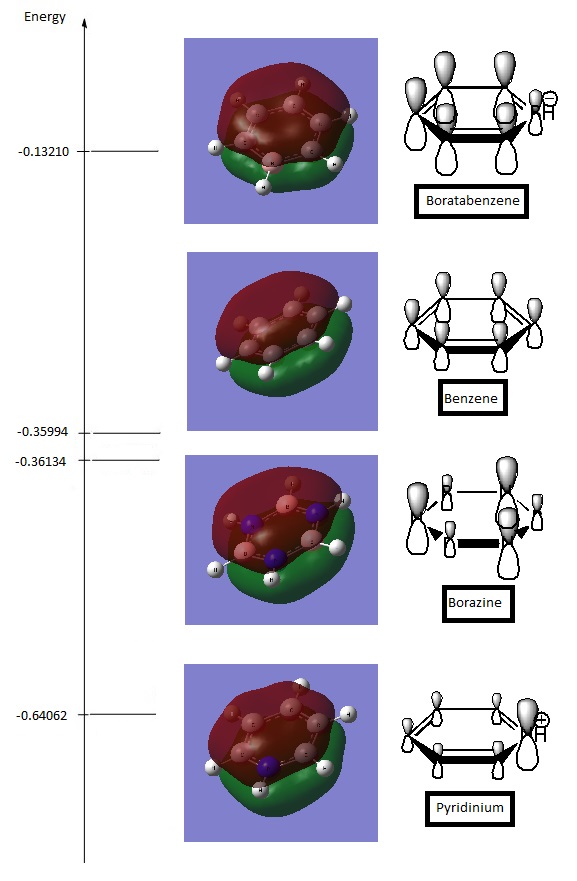
Totally Bonding Delocalised Orbitals (Energy Level 17)
Notes and References
- ↑ http://www.huntresearchgroup.org.uk/teaching/teaching_comp_lab_year3/2b_output_bh3.html
- ↑ http://www.huntresearchgroup.org.uk/teaching/teaching_comp_lab_year3/4a_pseudo_potentials.html
- ↑ http://www.huntresearchgroup.org.uk/teaching/teaching_comp_lab_year3/4a_pseudo_potentials.html
- ↑ http://www.huntresearchgroup.org.uk/teaching/teaching_comp_lab_year3/4b_creating_bcl3.html
- ↑ Balázs Réffy, Mária Kolonits, Magdolna Hargittai, Gallium tribromide: molecular geometry of monomer and dimer from gas-phase electron diffraction, Journal of Molecular Structure, Volume 445, Issues 1–3, 6 April 1998, Pages 139-148, ISSN 0022-2860, http://dx.doi.org/10.1016/S0022-2860(97)00420-1.
- ↑ http://www.huntresearchgroup.org.uk/teaching/teaching_comp_lab_year3/4c_mixed_pp_basis.html
- ↑ Online edition for students of organic chemistry lab courses at the University of Colorado, Boulder, Dept of Chem and Biochem. (2002). http://orgchem.colorado.edu/Spectroscopy/irtutor/IRtheory.pdf
- ↑ W.M Haynes,CRC handbook of Chemistry and Physics,2012, 93rd Ed., pg 26
- ↑ M. P. Mitoraj, Bonding in Ammonia Borane: An Analysis Based on the Natural Orbitals for Chemical Valence and the Extended Transition State Method (ETS-NOCV) J. Phys. Chem. A 115, 14708-14716 (2011). http://www.ncbi.nlm.nih.gov/pubmed/22085293
- ↑ Cooper, David L.; Gerratt, Joseph; Raimondi, Mario (1986). "The electronic structure of the benzene molecule". Nature 323 (6090): 699. DOI:10.1038/323699a0
- ↑ Schleyer, Paul von Ragué (2001). "Introduction: Aromaticity". Chemical Reviews 101 (5): 1115–8. DOI:10.1021/cr0103221
- ↑ http://www.chem.ucalgary.ca/courses/350/Carey5th/Ch11/ch11-4-1.html
- ↑ Allen, F.H., Watson, D.G., Brammer, L., Orpen, A.G., Taylor, R., International Tables for Crystallography, 2006, Vol. C(9.5), 790-811.
- ↑ Cooper, David L.; Gerratt, Joseph; Raimondi, Mario (1986). "The electronic structure of the benzene molecule". Nature 323 (6090): 699. DOI:10.1038/323699a0
- ↑ Duward Shriver; Peter Atkins (2010). Inorganic Chemistry (Fifth ed.). New York: W. H. Freeman and Company. p. 328.


