Rep:Mod:hyc116
The Gaussian modelling programme
Gaussian is a programme in computational chemistry designed and developped by the Gaussian Inc. based in Wallingfor, Connecticut.1 The programme allows its user to model chemical molecules and predict their properties, such as their energies, symmetry, and vibrational frequencies. For this task, the version of the programme used is the Gaussian 09.
Ammonia molecule, NH3
The table below summarises the information about the optimised ammonia molecule generated by Gaussian:
Below attached the Items table found on the log. file of the optimised molecule of ammonia generated by Gaussian. The maximum force, RMS force, maximum displacement, and the RMS displacement are all converged, indicating that optimisation has been completed.
Item               Value     Threshold  Converged?
 Maximum Force            0.000004     0.000450     YES
 RMS     Force            0.000004     0.000300     YES
 Maximum Displacement     0.000072     0.001800     YES
 RMS     Displacement     0.000035     0.001200     YES
 Predicted change in Energy=-5.986296D-10
 Optimization completed.
    -- Stationary point found.
                           ----------------------------
                           !   Optimized Parameters   !
                           ! (Angstroms and Degrees)  !
 --------------------------                            --------------------------
 ! Name  Definition              Value          Derivative Info.                !
 --------------------------------------------------------------------------------
 ! R1    R(1,2)                  1.018          -DE/DX =    0.0                 !
 ! R2    R(1,3)                  1.018          -DE/DX =    0.0                 !
 ! R3    R(1,4)                  1.018          -DE/DX =    0.0                 !
 ! A1    A(2,1,3)              105.7412         -DE/DX =    0.0                 !
 ! A2    A(2,1,4)              105.7412         -DE/DX =    0.0                 !
 ! A3    A(3,1,4)              105.7412         -DE/DX =    0.0                 !
 ! D1    D(2,1,4,3)           -111.8571         -DE/DX =    0.0                 !
 --------------------------------------------------------------------------------
Below is a 3D jmol file of the optimised molecule of ammonia. The molecule can be rotated freely in the jmol file to allow a more thorough study of the molecule.
Ammonia |
The optimisation file is linked to optimisation log file_StephC_ammonia.
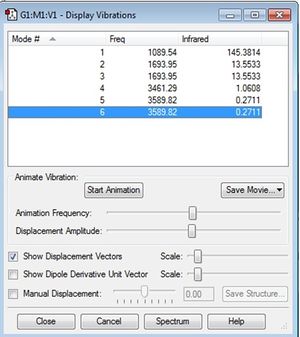
Here we are going to study the vibrational frequencies of ammonia, generated by Gaussian. Below is a screenshot of the list of vibrational frequencies generated:
How many modes do you expect from the 3N-6 rule? 6
Which modes are degenerate (ie have the same energy)? Mode 2 and 3, and mode 5 and 6
Which modes are "bending" vibrations and which are "bond stretch" vibrations? 1, 2, and 3 are bending; 4, 5, and 6 are bond stretch
Which mode is highly symmetric? Mode 1 and 4
One mode is known as the "umbrella" mode, which one is this? Mode 1
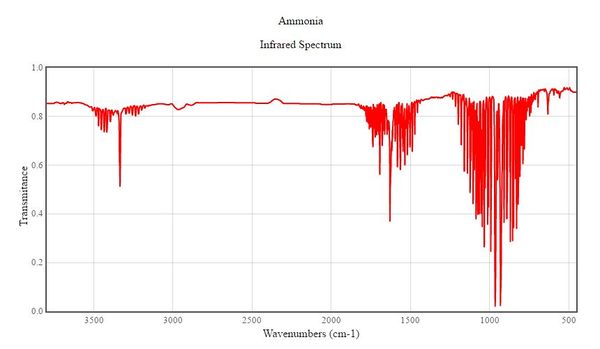
How many bands would you expect to see in an experimental spectrum of gaseous ammonia? According to these vibration frequencies obtained, two strong bands are expected to be seen in an infrared spectrum of gaseous ammonia. Mode 2 and 3 are degenerate so they will only give one band. In order for IR to be absorped by the molecule, there must be a change in dipole moment. For vibrational mode 4 whcih is the in-phase stretching of all three N-H bonds , there is no change in dipole moment. Hence, a peak should not be expected at that particular frequency. However as shown in Gaussian, the frequency at mode 4 has a higher intensity than mode 5 and 6, where there is almost no change in dipole moment. Mode 5 and 6 are degenerate and they will only give one band, but its intensity is so small it would not be observable on the spectrum. Three Bands are observed in the infrared spectrum found, attached below.2 As expected, two out of the three bands are very strong. The remaining relatively-weak band matches the vibrational frequency of mode 4.
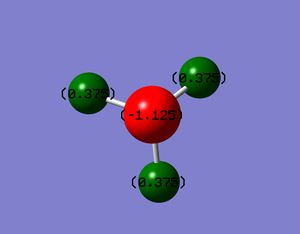
The below diagram shows the charges on the ammonia molecule. This was obtained via the charge distribution function in Gaussian.
The charge on the N-atom: -1.125
The charge on the H-atom: 0.375
A positive charge would be expected for the H-atom and a negative charge would be expected for a N-atom since nitrogen has a higher electronegativity than hydrogen.
Nitrogen molecule, N2
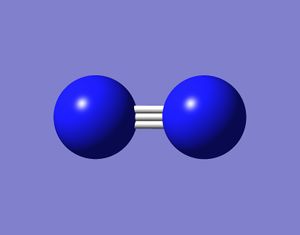
The table below summarises the information about the optimised nitrogen molecule generated by Gaussian:
| Nitrogen | ||
|---|---|---|
| ||
| More Info | ||
| Calculation method | RB3LYP | |
| Basic set | 6-31G(D,P) | |
| Final energy E(RB3LYP) | -109.52412868 a.u. | |
| RMS gradient | 0.00000060 a.u. | |
| Point group | D∞h | |
| Bond distance N-N | 1.10550 Å | |
Below attached the Items table found on the log. file of the optimised molecule of nitrogen generated by Gaussian. The maximum force, RMS force, maximum displacement, and the RMS displacement are all converged, indicating that optimisation has been completed.
Item               Value     Threshold  Converged?
 Maximum Force            0.000001     0.000450     YES
 RMS     Force            0.000001     0.000300     YES
 Maximum Displacement     0.000000     0.001800     YES
 RMS     Displacement     0.000000     0.001200     YES
 Predicted change in Energy=-3.401090D-13
 Optimization completed.
    -- Stationary point found.
                           ----------------------------
                           !   Optimized Parameters   !
                           ! (Angstroms and Degrees)  !
 --------------------------                            --------------------------
 ! Name  Definition              Value          Derivative Info.                !
 --------------------------------------------------------------------------------
 ! R1    R(1,2)                  1.1055         -DE/DX =    0.0                 !
 --------------------------------------------------------------------------------
Below is a 3D jmol file of the optimised nitrogen molecule. The molecule can be rotated freely in the jmol file to allow a more thorough study of the molecule. The nitrogen-nitrogen triple bond is represented by a single stick in this jmol file.
Nitrogen |
The optimisation file is linked to optimisation log file_StephC_nitrogen.
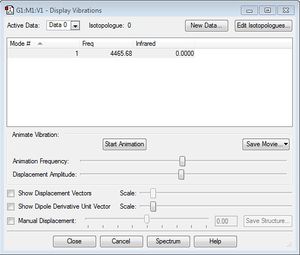
Below is a screenshot of the list of vibrational frequencies generated. Unlike ammonia, nitrogen is a homonuclear diatomic linear molecule, so there is only one mode of vibration available.
Hydrogen molecule, H2
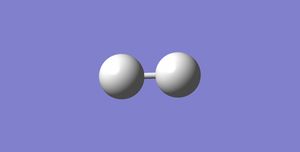
The table below summarises the information about the optimised hydrogen molecule generated by Gaussian:
| Hydrogen | ||
|---|---|---|
| ||
| More Info | ||
| Calculation method | RB3LYP | |
| Basic set | 6-31G(D,P) | |
| Final energy E(RB3LYP) | -1.17853936 a.u. | |
| RMS gradient | 0.00000017 a.u. | |
| Point group | D∞h | |
| Bond distance N-N | 0.74279 Å | |
Below attached the Items table found on the log. file of the optimised molecule of hydrogen generated by Gaussian. The maximum force, RMS force, maximum displacement, and the RMS displacement are all converged, indicating that optimisation has been completed.
 Item               Value     Threshold  Converged?
 Maximum Force            0.000000     0.000450     YES
 RMS     Force            0.000000     0.000300     YES
 Maximum Displacement     0.000000     0.001800     YES
 RMS     Displacement     0.000001     0.001200     YES
 Predicted change in Energy=-1.164079D-13
 Optimization completed.
    -- Stationary point found.
                           ----------------------------
                           !   Optimized Parameters   !
                           ! (Angstroms and Degrees)  !
 --------------------------                            --------------------------
 ! Name  Definition              Value          Derivative Info.                !
 --------------------------------------------------------------------------------
 ! R1    R(1,2)                  0.7428         -DE/DX =    0.0                 !
 --------------------------------------------------------------------------------
Below is a 3D jmol file of the optimised molecule of hydrogen. The molecule can be rotated freely in the jmol file to allow a more thorough study of the molecule.
Hydrogen |
The optimisation file is linked to optimisation log file_StephC_hydrogen.
Below is a screenshot of the list of vibrational frequencies generated. Just like nitrogen, hydrogen is a homonuclear diatomic linear molecule, so there is only one mode of vibration available.
Reaction energies
E(NH3)= -56.55776873 a.u.
2*E(NH3)= -113.11553746 a.u.
E(N2)= -109.52412868 a.u.
E(H2)= -1.17853936 a.u.
3*E(H2)= -3.53561808 a.u.
ΔE=2*E(NH3)-[E(N2)+3*E(H2)]= -0.0557907 a.u. i.e. -146.48 kJ/mol (2 d.p.)
The ammonia product is more stable; the reaction is exothermic with a negative value for the reaction energy, indicating that the products are lower in energy than the gaseous reactants, hence more stable.
The enthalpy of formation of gaseous ammonia is found to be -45.94±0.35 kJ/mol.3 As it is shown, the calculated value is rather far from the literature value found. This can possibly explained by the assumption made when doing the calculations: the values quoted in each step of the calculation are purely theoretical, whereas the literature value of the standard enthalpy of formation was obtained from experiment under standard conditions. This suggests that it is not ideal to calculate the energy change of reactions purely based on values generated by the Gaussian.
Project molecule: cyanide, CN-
The table below summarises the information about the optimised cyanide molecule generated by Gaussian:
Below attached the Items table found on the log. file of the optimised molecule of cyanide generated by Gaussian. The maximum force, RMS force, maximum displacement, and the RMS displacement are all converged, indicating that optimisation has been completed.
Item               Value     Threshold  Converged?
 Maximum Force            0.000012     0.000450     YES
 RMS     Force            0.000012     0.000300     YES
 Maximum Displacement     0.000005     0.001800     YES
 RMS     Displacement     0.000008     0.001200     YES
 Predicted change in Energy=-6.650398D-11
 Optimization completed.
    -- Stationary point found.
                           ----------------------------
                           !   Optimized Parameters   !
                           ! (Angstroms and Degrees)  !
 --------------------------                            --------------------------
 ! Name  Definition              Value          Derivative Info.                !
 --------------------------------------------------------------------------------
 ! R1    R(1,2)                  1.1841         -DE/DX =    0.0                 !
 --------------------------------------------------------------------------------
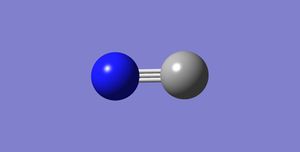
Below is a 3D jmol file of the optimised molecule of cyanide. The molecule can be rotated freely in the jmol file to allow a more thorough study of the molecule
test molecule |
The optimisation file is linked to optimisation_file_StephC_cyanide.
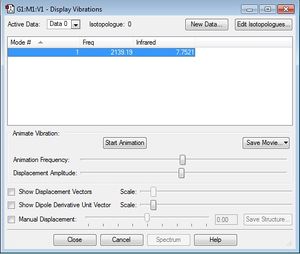
Below is a screenshot of the list of vibrational frequencies generated. Cyanide is a heteronuclear diatomic linear molecule, so there is only one mode of vibration available.
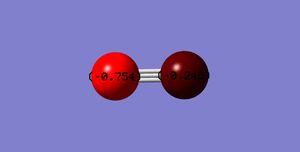
The below diagram shows the charges on the cyanide molecule. This was obtained via the charge distribution function in Gaussian.
The charge on the C-atom: -0.754
The charge on the N-atom: -0.246
Molecular orbitals
Below are a few molecular orbitals of cyanide generated in Gaussian:
MO figure 1: This orbital shows an almost-shpere shape which may have been contributed from an s orbital. We can see a node near the carbon atom, which suggests some p orbital characters. This is a bonding orbital.
MO figure 2: Here a node is observed on the nitrogen atom, indicating a p atomic orbital. On the carbon atom, both s and p characters are observed, suggesting a hybridised orbital, which agrees with the linear structure of CN-. This is a bonding orbital.
MO figure 3: Here electron density is observed above and below the molecule, indicating that it is a pi molecular orbital resulting from the p atomic orbitals on the carbon and nitrogen atoms overlapping. This is a bonding orbital which makes up one of the triple bonds in cyanide.
MO figure 4: Here again, electron density is observed on opposite sides of the molecules, perpendicular to the ones shown in MO figure 3. It is a pi molecular orbital generated from the p atomic orbitals on the carbon and nitrogen atoms overlapping. This is a bonding orbital which makes up another one of the triple bonds in cyanide. MO figure 3 and 4 are degenerate, with the same energy value of -0.01696 a.u.
MO figure 5:: The figure shows one nodal plane on each atom, suggesting that it is the two p atomic orbitals overlapping out of phase. This is an anti-bonding orbital.
Hydrogen cyanide, HCN
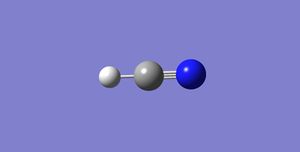
For comparison with the cyanide anion molecue, the hydrogen cyanide molecule is studied. The table below summarises the information about the optimised hydrogen cyanide molecule generated by Gaussian:
Here, it is observed that the energy of cyanide and hydrogen cyanide are very similar. The CN triple bond in cyanide is slightly longer than in hydrogen cyanide.
Below attached the Items table found on the log. file of the optimised molecule of hydrogen cyanide generated by Gaussian. The maximum force, RMS force, maximum displacement, and the RMS displacement are all converged, indicating that optimisation has been completed.
Item               Value     Threshold  Converged?
 Maximum Force            0.000370     0.000450     YES
 RMS     Force            0.000255     0.000300     YES
 Maximum Displacement     0.000676     0.001800     YES
 RMS     Displacement     0.000427     0.001200     YES
 Predicted change in Energy=-2.062470D-07
 Optimization completed.
    -- Stationary point found.
                           ----------------------------
                           !   Optimized Parameters   !
                           ! (Angstroms and Degrees)  !
 --------------------------                            --------------------------
 ! Name  Definition              Value          Derivative Info.                !
 --------------------------------------------------------------------------------
 ! R1    R(1,2)                  1.157          -DE/DX =    0.0004              !
 ! R2    R(2,3)                  1.0686         -DE/DX =    0.0004              !
 ! A1    L(1,2,3,-2,-1)        180.0            -DE/DX =    0.0                 !
 ! A2    L(1,2,3,-3,-2)        180.0            -DE/DX =    0.0                 !
 --------------------------------------------------------------------------------
The optimisation file is linked to optimisation_file_StephC_hydrogen_cyanide.
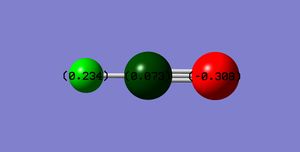
The below diagram shows the charges on the hydrogen cyanide molecule. This was obtained via the charge distribution function in Gaussian.
The charge on the H-atom: 0.234
The charge on the C-atom: 0.073
The charge on the N-atom: -0.308
The charges on the atoms in hydrogen cyanide are significantly different to the charges in cyanide. In hydrogen cyanide, the N-atom is more negatively charged than in cyanide. The C-atom in hydrogen cyanide has a positive charge instead of the negative charge found on the C-atom in cyanide. This is because the hydrogen cyanide is a neutral molecule while cyanide is a negatively charged molecule with the negative charge on the carbon atom.
References
1. http://gaussian.com/ (assessed on the 10th of March, 2017) 2. http://webbook.nist.gov/cgi/cbook.cgi?ID=C7664417&Units=SI&Type=IR-SPEC&Index=1#IR-SPEC (assessed on the 10th of March, 2017) 3. Cox, J.D.; Wagman, D.D.; Medvedev, V.A., CODATA Key Values for Thermodynamics, Hemisphere Publishing Corp., New York, 1984, 1.


