Rep:Mod:hy3
Module 3: Transition states and reactivity (Holly Yu)
Introduction
This article aims to locate the low-energy minima and transition structures on the potential energy surface of 1,5-hexadiene in order to determine the preferred mechanism of the Cope rearrangement reaction.
The Cope rearrangement proceeds via a concerted [3,3]-sigmatropic shift rearrangement, involving either a chair or boat transition state. Studies have found that the boat transition state lies several kcal mol-1 higher in energy than the chair.

The Cope rearrangement of 1,5-hexadiene
Optimising the reactants and products
Optimising an antiperiplanar conformation of 1,5-hexadiene
Using Gaussview, a molecule of 1,5-hexadiene was drawn, with an antiperiplanar relationship between the central four carbon atoms, before optimising the structure using a Hartree Fock method and a 3-21G basis set. “%mem”, found within the Link 0 tab, was altered to 250MB before performing the optimisation.
This produced the following optimised structure:
| HF 321-G logfile | File:Apphf321-glogfile.log |
| Jmol of optimised structure |
A summary of the optimisation can be seen as follows:
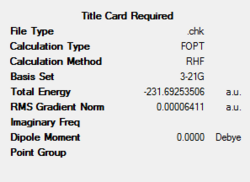
The point group of the molecule was determined to be Ci.
Comparing this structure and its energy to those given in appendix 1 shows that this is the anti2 conformation – the energies obtained are identical and the relative geometries look to be a perfect match:
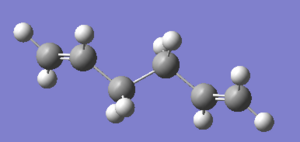
This optimised structure was then reoptimised, using a different B3LYP method and a 6-31G* basis set.
This produced the following optimised structure:
| B3LYP 631-G* logfile | File:Appb3lyplogfile.log |
| Jmol of optimised structure |
A summary of the optimisation can be seen as follows:
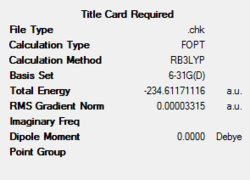
A comparison of the geometrical parameters from both the Hartree Fock 3-21G optimisation and the B3LYP 6-31G* optimisation can be shown as follows:
| Geometric parameter | Hartree Fock 3-21G method | B3LYP 6-31G* method |
|---|---|---|
| C2-C3-C4-C5 dihedral angle (o) | 180.0 | 180.0 |
| C3-C4-C5-C6 dihedral angle (o) | 114.7 | 118.3 |
| C1-C2-C3 angle (o) | 124.8 | 125.3 |
| C2-C3-C4 angle (o) | 111.4 | 112.7 |
| C3-C4-C5 angle (o) | 111.4 | 112.7 |
| C4-C5-C6 angle (o) | 124.8 | 125.3 |
| C1-C2 bond length (Å) | 1.32 | 1.33 |
| C2-C3 bond length (Å) | 1.51 | 1.50 |
| C3-C4 bond length (Å) | 1.55 | 1.55 |
| C4-C5 bond length (Å) | 1.51 | 1.50 |
| C5-C6 bond length (Å) | 1.32 | 1.33 |
| C1-H(syn to C2-H) bond length (Å) | 1.07 | 1.09 |
| C1-H(anti to C2-H) bond length (Å) | 1.07 | 1.09 |
| C2-H bond length (Å) | 1.07 | 1.09 |
| C3-H(1) bond length (Å) | 1.08 | 1.10 |
| C3-H(2) bond length (Å) | 1.09 | 1.10 |
NB. C1 and C6 refer to the terminal carbon atoms; C2, C3, C4 and C5 refer to the intervening carbons.
This shows slight differences in both the bond lengths and bond angles obtained using the different methods. This is a good illustration of the differences between the two methods, and serves to reinforce the fact that energies and geometries of isomers obtained using different methods and basis sets cannot be directly compared.
Optimising a gauche conformation of 1,5-hexadiene
A molecule of 1,5-hexadiene was drawn using Gaussview, this time with a gauche relationship between the central four atoms. Generally, antiperiplanar conformations show lower energy states than gauche, synperiplanar or anticlinal conformations, due to reduced steric interactions which would act to raise the energy profile of a particular conformation. The gauche structure was optimised as above, using a Hartree Fock method, a 3-21G basis set and an increased memory capacity of 250MB.
This produced the following optimised structure:
| HF 321-G logfile | File:Gauchehflogfile.log |
| Jmol of optimised structure |
A summary of the optimisation can be seen as follows:

The point group of the molecule was determined to be C1.
Comparing this structure and its energy to those given in appendix 1 shows that this is the gauche3 conformation – the energies obtained are identical and the relative geometries look to be a perfect match:

This optimised structure was then reoptimised, using a different B3LYP method and a 6-31G* basis set.
This produced the following optimised structure:
| B3LYP 631-G* logfile | File:Gaucheb3lyplogfile.log |
| Jmol of optimised structure |
A summary of the optimisation can be seen as follows:
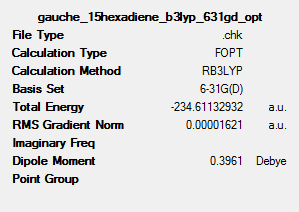
A comparison of the geometrical parameters from both the Hartree Fock 3-21G optimisation and the B3LYP 6-31G* optimisation can be shown as follows:
| Geometric parameter | Hartree Fock 3-21G method | B3LYP 6-31G* method |
|---|---|---|
| C2-C3-C4-C5 dihedral angle (o) | 60.0 | 66.3 |
| C3-C4-C5-C6 dihedral angle (o) | 150.0 | 122.1 |
| C1-C2-C3-C4 dihedral angle (o) | 150.0 | 119.4 |
| C1-C2-C3 angle (o) | 120.0 | 125.5 |
| C2-C3-C4 angle (o) | 109.5 | 113.5 |
| C3-C4-C5 angle (o) | 109.5 | 113.5 |
| C4-C5-C6 angle (o) | 120.0 | 124.9 |
| C1-C2 bond length (Å) | 1.36 | 1.33 |
| C2-C3 bond length (Å) | 1.54 | 1.55 |
| C3-C4 bond length (Å) | 1.54 | 1.50 |
| C4-C5 bond length (Å) | 1.54 | 1.50 |
| C5-C6 bond length (Å) | 1.36 | 1.33 |
| C1-H(syn to C2-H) bond length (Å) | 1.07 | 1.09 |
| C1-H(anti to C2-H) bond length (Å) | 1.07 | 1.09 |
| C2-H bond length (Å) | 1.07 | 1.09 |
| C3-H(1) bond length (Å) | 1.07 | 1.10 |
| C3-H(2) bond length (Å) | 1.07 | 1.10 |
As was the case for the antiperiplanar structures optimised using different methods and basis sets, described above, this again shows differences in both bond lengths and bond angles. In this case, the differences are marked – all of the geometrical parameters seem to have undergone a substantial shift upon optimising with the B3LYP method and 6-31G* basis set. As this is a higher level method and basis set, it is assumed that the values obtained using this method are better than those obtained using the HF 3-21G method. This can be seen when comparing the relative energies of the gauche conformations obtained with the two methods – the B3LYP method has produced an optimised energy value which is several hartrees lower in energy than that obtained using the HF 3-21G method. A lower energy indicates a more stable structure, proving that the B3LYP method is a better, higher level optimisation method than the HF 3-21G method. One downside to the B3LYP method is the fact that it uses more computational power, due to the higher level calculations involved during the optimisations it performs. However, this is outweighed by the fact that the structures it produces are better representations of the ground state structures of the molecules of interest.
Performing a frequency analysis on the antiperiplanar conformation of 1,5-hexadiene
In order to confirm an energy minimum was indeed obtained for the above antiperiplanar conformation, a frequency analysis was carried out. The same B3LYP 6-31G* method and basis set were used, as above, to enable the attainment of valid, comparable results.
All of the frequencies obtained were classed as ‘real’. This confirms that a minimum energy structure has been obtained, rather than a transition state, which has one imaginary frequency, or a failed optimisation, which has multiple negative frequencies.
The predicted IR spectrum of the compound can be seen below:

The results of the frequency analysis also contain information about the thermochemistry of the anti2 conformation.
This can be seen as follows:

The calculation provides four different energy terms:
1 The sum of the electronic and zero-point energies: this is defined as the potential energy found at 0K, which includes the zero-point vibrational energy. This can be defined as E = Eelec + ZPE.
2) The sum of the electronic and thermal energies: this is defined as the energy found at 298.15K and 1.0atm pressure, which includes translational, rotational and vibrational energy contributions. This can be written as E = E + Evib + Erot + Etrans.
3) The third term, the sum of electronic and thermal enthalpies, involves a correction for RT, where H = E + RT.
4) Finally, the fourth expression, the sum of electronic and thermal free energies, includes the entropic contribution to the free energy.
The first and fourth terms listed above can be compared to those given in the results table of the appendix:
| Energy parameter | Computed value (hartree) | Appendix value (hartree) | Difference (hartree) | Difference (kJ mol-1) |
|---|---|---|---|---|
| Sum of electronic and zero-point energies | -234.469219 | -234.469203 | 0.000016 | 0.042008 |
| Sum of electronic and thermal free energies | -234.500817 | -234.461856 | 0.461848 | 1212.503 |
This shows the energies obtained during the optimisation are almost identical to the ideal values given in the appendix, suggesting that the frequency analysis and subsequent thermochemical analysis were performed successfully.
Surprisingly, the relative energies above show that the ‘gauche 3’ conformation is of lower energy than the upper antiperiplanar (‘anti 2’) conformation. The energy difference equates to just under 1 kJ mol-1.
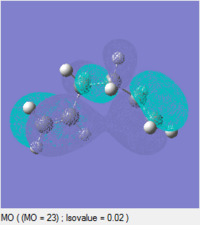
At first glance, it is not immediately obvious why the gauche conformation lies at a slightly lower energy than the antiperiplanar relationship: Newman diagrams predict that the antiperiplanar conformation should be lower in energy due to fewer steric clashes. Instead, analysing the molecular orbitals of the two conformations may help to rationalise this energy ordering:
| Antiperiplanar | Gauche | |
|---|---|---|
| HOMO |  |
 |
| LUMO | 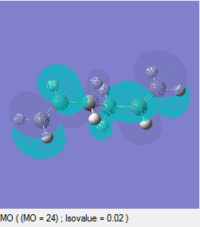 |
 |
These diagrams indicate that, for the gauche conformation, there is a potential stabilising interaction between the π bond of the C=C and the σ* orbital of the C2-H bond. This explains why the gauche conformation actually lies slightly lower in energy than the antiperiplanar conformation.
Optimising the chair and boat transition structures
Optimising an initial allyl fragment
Using Gaussview, an allyl CH2CHCH2 fragment was drawn, before optimising the structure using a Hartree Fock method and 3-21G basis set. This gave the following optimised structure:
| Allyl fragment | ||||
|---|---|---|---|---|
| HF 321-G logfile | File:Allylllogfile.log | |||
| Jmol of HF 321-G optimised structure |
|
Two lots of this optimised structure were then pasted into a new molecule window in Gaussview, in an approximately chair-shaped arrangement, which resembles the ‘chair’ transition structure shown in the appendix. The distance between the two respective fragments was on the order of 2.2Å.
This chair transition structure was then subjected to two different transition state optimisations.
Optimising the chair transition structure: method 1
The first method of optimising the transition state involved computing the force constant matrix (aka the Hessian) during the initial stages of the optimisation. This force constant matrix would then undergo constant updating during the optimisation.
To perform this type of optimisation, Opt+Freq was selected as the job type to be performed, along with ‘Optimise to a TS (Berny)’. The force constants were calculated once, and in the additional keywords box, ‘opt=noeigen’ was stated. This was to prevent the calculation from crashing if multiple imaginary frequencies were detected during the optimisation. The optimisation gave the following structure:
| Chair transition structure | ||||
|---|---|---|---|---|
| HF 321-G logfile | File:Hollychair1logfile.log | |||
| Jmol of HF 321-G optimised structure |
|
One imaginary frequency with a value of -818cm-1 was detected. The vibration corresponding to this frequency can be seen as follows:
blah |
This clearly shows a vibration involved during the Cope rearrangement, suggesting that the job completed successfully.
A summary of the optimisation is shown below.
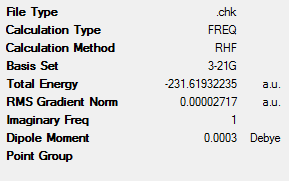
The energy of the structure compares well with that given in the appendix for the same structure:
| Energy parameter | Computed value (hartree) | Appendix value (hartree) | Difference (hartree) | Difference (kJ mol-1) |
|---|---|---|---|---|
| Electronic energy | -231.6193225 | -231.619322 | 0.0000 | 0.0000 |
This shows an exact energy match with that given in the appendix, suggesting that the transition structure has been successfully obtained during the calculation. The bond-forming distance involved in the transition state is 2.02Å.
Optimising the chair transition structure: method 2
The second optimisation method performed for the chair transition structure involved the use of a frozen coordinate method. Again, this involved taking the initial two fragments, oriented in a chairlike arrangement. The redundant coordinate editor was opened from the edit menu of Gaussview, before selecting both sets of terminal carbons which go on to form or break bonds during the rearrangement process. ‘Bond’ and ‘Freeze coordinate’ were chosen, and a value of 2.2Å was specified for the distance between the respective pairs of carbon atoms. The structure was optimised to a minimum, which gave the following intermediate structure:
| Chair transition structure | ||||
|---|---|---|---|---|
| HF 321-G logfile | File:Coptlogfile.log | |||
| Jmol of HF 321-G optimised structure |
|
The resulting checkpoint file from this optimisation was opened, in order to optimise the previously fixed 2.2Å distance between the pairs of carbon atoms. Again, this involved using the redundant coordinate editor, selecting the respective pairs of carbon atoms undergoing bond breaking or formation, and choosing ‘Bond’ and ‘Derivative’. A transition state (Berny) optimisation was performed, to give the following structure:
| Chair transition structure | ||||
|---|---|---|---|---|
| HF 321-G logfile | File:D12logfile.log | |||
| Jmol of HF 321-G optimised structure |
|
A summary of the optimisation is shown below.
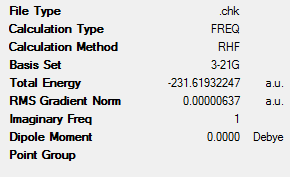
Comparing the energy obtained during this calculation with that from the appendix shows no difference:
| Energy parameter | Computed value (hartree) | Appendix value (hartree) | Difference (hartree) | Difference (kJ mol-1) |
|---|---|---|---|---|
| Electronic energy | -231.619322 | -231.619322 | 0.0000 | 0.0000 |
As per the prior optimisation method, a single imaginary frequency of value -818cm-1 was detected. The vibration corresponding to this vibration can be seen as follows:
blah |
This clearly shows a vibration involved during the Cope rearrangement, suggesting that the job completed successfully.
In this case, the distance between the reacting carbons of the transition state is again found to be 2.02Å. This is exactly the same value as the obtained using the former Hessian method, indicating that both methods produce reliable estimates of the transition state geometry. Similarly, the energies obtained using the two methods are extremely close.
Optimising the boat transition structure
The boat transition structure was optimised by trialling a different method to those used above for the chair transition state. This new optimisation method, the QST2 method, involves specifying both the reactants and products, after which the calculation interpolates between the structures in order to find the transition state.
The checkpoint file corresponding to the anti2 conformer was opened, and pasted into a new molecule window to provide both reactant and product structures. The numbering of the structures was altered so that the relevant atoms within the reactants and products corresponded to each other.

An Opt+Freq calculation was run, choosing to optimise to a transition state. TS (QST2) was chosen. This initial optimisation failed. The corresponding logfile and Jmol of this failed calculation are shown below.
| Boat transition structure | ||||
|---|---|---|---|---|
| Logfile | File:FailedQST2logfile.log | |||
| Jmol of the optimised structure |
|
Analysing the resulting Jmol of the structure shows that it resembles the chair transition structure, but it is more dissociated. This can be attributed to the fact that the calculation solely translated the upper allyl fragment, without rotating any of the central bonds within the structures.
In order to overcome this problem, both the dihedral and bond angles were altered to provide structures which more closely resemble the predicted boat transition state. This involved opening the initial input file from the previous calculation, and altering the central dihedral angles within the fragments to 0o, and the C2-C3-C4 and C3-C4-C5 angles to 100o.
The labelled structures, with their new geometries, looked as follows:

The QST2 optimisation was run again, as before. This time, the boat transition structure was successfully obtained:
| Boat transition structure | ||||
|---|---|---|---|---|
| HF 321-G logfile | File:SuccessfulQST2afterangleslogfile.log | |||
| Jmol of HF 321-G optimised structure |
|
The resulting structure showed only one imaginary frequency at -840cm-1, which corresponds to the Cope rearrangement involving a boat transition state.
The animation corresponding to the imaginary frequency can be seen below:
blah |
A summary of the calculation is shown below.
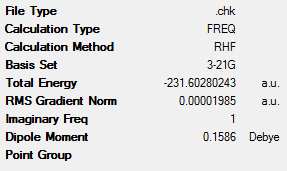
The energy of this boat transition structure can be compared to that given in the appendix:
| Energy parameter | Computed value (hartree) | Appendix value (hartree) | Difference (hartree) | Difference (kJ mol-1) |
|---|---|---|---|---|
| Electronic energy | -231.602802 | -231.602802 | 0.0000 | 0.0000 |
This shows that the energy value is identical to that given in the appendix, suggesting that a suitable boat transition structure has been found.
An Intrinsic Reaction Coordinate analysis of the chair transition structure
From looking at the optimised chair and boat transition structures, it is difficult to determine exactly which conformers of 1,5-hexadiene they most closely resemble.
One method which enables the minimum energy path from a transition structure to be followed through to its local minimum is the Intrinsic Reaction Coordinate method (IRC). This method involves small geometry steps toward the direction in which the gradient of the energy surface is steepest, creating a series of points during the optimisation.
This intrinsic coordinate method was performed on the optimised chair transition structure from the TS (Berny) optimisation (method 1), detailed above.
The checkpoint file from this TS (Berny) optimisation was opened, before selecting an IRC method from the job type tab. The reaction coordinate was selected to act in the forwards direction only, and it was opted to calculated force constants only once during the calculation. The number of points for the IRC to step along was increased from 6 to 50.
The logfile and Jmol of the optimisation are shown below:
| Chair transition structure | ||||
|---|---|---|---|---|
| HF 321-G logfile | File:Singleforceconstant.log [1] | |||
| Jmol of HF 321-G optimised structure |
|
Analysing the intermediate geometries obtained during the reaction reveals that a minimum geometry has not been obtained yet:
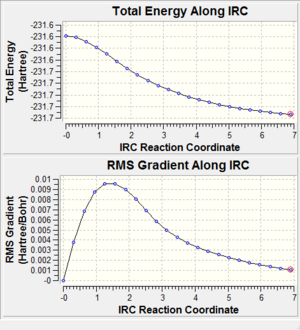
The root-mean-squared gradient has a value of 0.001 following this optimisation. Generally, values need to be less than 0.001 for a successful optimisation. Therefore a further optimisation was performed, as detailed below: In order to find a minimum geometry, the calculation was run again, this time opting to calculate force constants at every step. This is a very reliable option, though it is computationally expensive.
Calculating the force constants at every step gave the following result:
| Chair transition structure | ||||
|---|---|---|---|---|
| HF 321-G logfile | File:Multipleforceconstants.log | |||
| Jmol of HF 321-G optimised structure |
|


The graphs clearly show that a smaller gradient has been obtained – it is much lower than the previous value of 0.001, meaning that it is likely that a minimum geometry has now been obtained with this improved method.
The activation energies of the chair and boat transition structures
In order to calculate the activation energies for forming both the chair and boat transition structures (ie the energy difference between the stable anti or gauche conformations, and the corresponding chair or boat transition structures), the chair and boat transition structures were reoptimised using a B3LYP method and a 6-31G* basis set. Frequency calculations were also performed during the optimisations.
This gave the following Jmols and logfiles for the optimised structures:
| Chair | Boat | |||||||
|---|---|---|---|---|---|---|---|---|
| B3LYP 6-31G* logfile | File:ChairB3LYP.log [2] | File:BoatB3LYP.log [3] | ||||||
| Jmol of optimised structure |
|
|
The energies obtained during this optimisation can be compared to those for the stable reactants, and the difference calculated to give an overall activation energy for the formation of the two respective transition states:
| Transition state energy (hartree) | Stable reactant energy (hartree) | Difference (hartree) | Difference (kcal mol-1) | |
|---|---|---|---|---|
| Chair (B3LYP method) | -234.55698 | -234.61171 | 0.05473 | 34.34 |
| Boat (B3LYP method) | -234.54309 | -234.61133 | 0.06824 | 42.82 |
| Chair (HF 3-21G method) | -231.61932 | -231.69253 | 0.07321 | 45.94 |
| Boat (HF 3-21G method) | -231.60280 | -231.69266 | 0.08986 | 56.39 |
The energies also compare favourably with those of the transition structures given in the appendix, which suggests the transition states have been found and optimised successfully.
It can be seen that, regardless of the method used, the boat conformation has a higher activation energy than the formation of the chair conformation.
The Diels-Alder Cycloaddition
The Diels-Alder reaction is a [4+2] cycloaddition reaction. It is classed as a pericyclic reaction. During the reaction, π orbitals of both the dienophile and diene interact to form a new σ bond. This interaction between the two species can be classed as either allowed or forbidden, depending on the number of π electrons involved.
During the Diels-Alder reaction, the frontier orbitals (HOMO/LUMO) of one fragment interact with the frontier orbitals of the other fragment. Overall, two new bonding and antibonding molecular orbitals will be formed.
Analysis of the HOMO and LUMO properties (specifically their nodal planes) enables predictions as to whether a reaction is allowed or forbidden.
This can be summarised in the following manner:
1) If the HOMO of one reactant can undergo a favourable interaction with the LUMO of the other reactant, then the reaction is classed as allowed. This is only possible if there is significant overlap of orbital density.
2) If this is not the case, and the two interacting orbitals have different symmetry properties, meaning favourable interactions are not possible, then the reaction is classed as forbidden.
These interactions will be analysed in the following exercise, which looks at the Diels-Alder transition state for reaction between cis-butadiene and ethene, and cyclohexadiene with maleic anhydride.
Analysis of cis-butadiene
Cis-butadiene was drawn on Gaussview, before optimising the geometry to produce the following structure:
| Cis-butadiene | ||||
|---|---|---|---|---|
| HF 321-G logfile | File:Cisbutadienelogfile.log | |||
| Jmol of HF 321-G optimised structure |
|
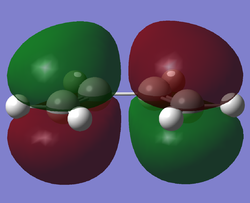
The HOMO and LUMO of cis-butadiene can be seen as follows:
| HOMO | LUMO |
|---|---|
 |
 |
| Antisymmetric | Symmetric |
This clearly shows that the HOMO is antisymmetric with respect to the plane of the molecule, and the LUMO is symmetric with respect to the plane of the molecule.
Analysis of the transition state geometry for the reaction of cis-butadiene with ethene
Cis-butadiene and ethene were drawn in Gaussview, using an envelope-type orientation between the two fragments, before performing an Opt+Freq analysis, choosing to perform a TS (Berny) analysis. This gave the following transition state:
| Prototypical transition state | ||||
|---|---|---|---|---|
| HF 321-G logfile | File:Cisbutadieneandethenelogfile.log | |||
| Jmol of HF 321-G optimised structure |
|
The frequency analysis shows just a single imaginary frequency, at -819 cm-1, indicating that a transition state has successfully been obtained. The frequency can be seen as follows:
blah |
This corresponds to the Diels-Alder mechanism. The formation of the two bonds is synchronous. Comparing this to the lowest positive frequency, shown below, with a value of 166 cm-1,
blah |
it can be seen that this vibration corresponds to an asynchronous bond-formation.
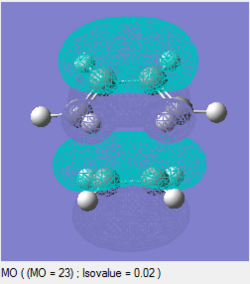
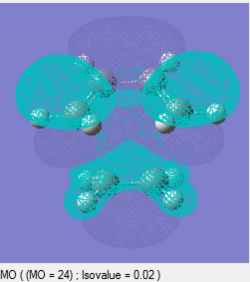
The frontier orbitals of the transition state can be analysed, as above for the cis-butadiene molecule. These can be seen as follows:
| HOMO | LUMO |
|---|---|
 |
 |
| Symmetric | Symmetric |
It can be seen that both the HOMO and LUMO are symmetric with respect to the plane of the transition state.
A diagram showing the respective bond lengths within the transition state is shown below:
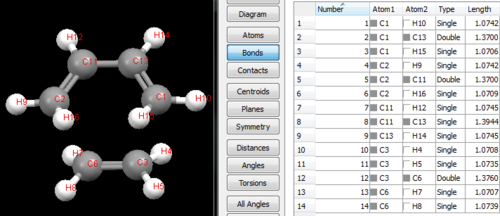
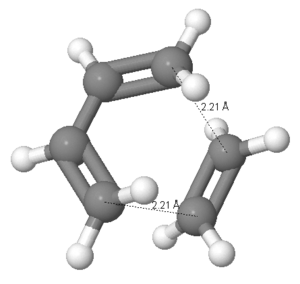
The distance between the terminal carbons, across which the new bonds form, is 2.21Å.
This compares to experimentally determined sp3 C-C and sp2 C-C bond lengths of 1.543Å and 1.353Å, respectively[4].
The van der Waals radius of a carbon atom is 1.70Å[5]. Therefore this shows that the bond length of the partially formed C-C bond length in the transition state is still too long to be considered a formal bond, and that the distance will decrease further before the final product structure is obtained. The HOMO and LUMO of ethene have been calculated, and can be seen as follows:
| HOMO | LUMO |
|---|---|
 |
 |
| Symmetric | Antisymmetric |
Taking these molecular orbitals, and the ones for butadiene, shown earlier, into account, it can be seen that the HOMO of the transition state comprises the HOMO of butadiene and the LUMO of ethene. These molecular orbitals are both antisymmetric in nature, meaning that the interaction is formally allowed. Similarly, the LUMO of the transition state comprises the HOMO of ethene and the LUMO of butadiene. These orbitals are symmetric, again meaning that the interaction is formally allowed.
Analysis of the regioselectivity of the Diels-Alder reaction
NB for all of the following calculations, the AM1 semi-empirical molecular orbital method was used, unless otherwise stated.
To analyse the regioselectivity of the Diels-Alder reaction, transition states for both the endo and exo conformations of the reaction of maleic anhydride and cyclohexadiene were calculated.
This involved an initial optimisation of both cyclohexadiene and maleic anhydride. The results from these optimisations are given below:
| Cyclohexadiene | ||||
|---|---|---|---|---|
| Logfile | File:Cyclohexadienelogfile.log | |||
| Jmol of HF 321-G optimised structure |
|
| Maleic anhydride | ||||
|---|---|---|---|---|
| Logfile | File:Maleicanhydridelogfile.log | |||
| Jmol of HF 321-G optimised structure |
|
It can be seen from the optimised Jmol of cyclohexadiene that the 4 sp2 carbons do not lie perfectly in plane, as might be expected. This is presumably due to the fact that the two sp3 hybridised carbons distort the structure somewhat. It is assumed that for larger ring systems still containing 4 adjacent sp2 hybridised carbons, the carbons would be more likely to lie in plane due to decreased steric constraints imposed by the larger number of sp3 carbons.
Cyclohexadiene and maleic anhydride were then arranged into endo and exo orientations, respectively, and optimised using the frozen coordinate method to find the transition structures.
The results are shown below:
| Endo transition state | ||||
|---|---|---|---|---|
| Logfile | File:Endotslogfile.log [6] | |||
| Jmol of optimised structure |
|
| Exo transition state | ||||
|---|---|---|---|---|
| Logfile | File:Exotslogfile.log [7] | |||
| Jmol of optimised structure |
|
| Endo transition state | Exo transition state | |
|---|---|---|
| TS energy (hartree) | -0.05150 | -0.05042 |
The kinetic product of the Diels-Alder reaction has been found to be the endo adduct. This is due to the exo transition structure lying higher in energy.
The results from the calculations performed above support this experimental finding.
Diagrams showing the C-C distances within both the endo and exo transition states are shown below:


Comparing the through-space C-C interactions between the C(=O)COC(=O) portion of the maleic anhydride with both the ‘opposite’ –HC=CH- of the endo form, and the ‘opposite’ –H2C-CH2- of the exo form, shows a shorter distance of 2.89Å within the endo transition structure, compared to a slightly longer distance of 2.95Å within the exo transition structure.
This suggests that there is slightly less steric strain present within the exo transition structure, meaning it may be assumed that the exo transition structure would lie lower in energy and would thus be the kinetic product. However, this is not the case. This is due to secondary orbital interactions being present within the endo transition structure, which act to lower the energy of the endo transition structure below that of the exo transition structure. Ultimately, this results in the endo product being the kinetically favoured one.
From the molecular orbital diagrams below, a secondary orbital overlap interaction can be seen for the endo structure – the p-orbitals of the carbonyl carbons can interact with the p-orbital of the dienes, which results in a stabilising interaction and thus a lowering of the transition state energy. This stabilising secondary orbital interaction overcomes the slightly increased unfavourable steric interactions within the endo transition structure. Overall, the endo transition structure lies slightly lower in energy than the exo transition structure, meaning it is more energetically accessible along the kinetic reaction pathway. This gives the endo product as the kinetic product of the reaction.
N.B. this is the case when the substituents present on the reactants are fairly small – if bulkier substituents are present, this may result in the steric interactions overcoming the secondary orbital interactions, and an ultimate greater stabilisation of the exo transition structure. Therefore the balance between whether the endo or exo structure dominates as the kinetic product is highly sensitive to the nature of the substituents present on the reactants.
| Endo | Exo | |
|---|---|---|
| HOMO |  |
 |
| HOMO symmetry | Antisymmetric | Antisymmetric |
| LUMO | 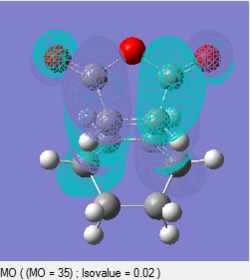 |
 |
| LUMO symmetry | Antisymmetric | Antisymmetric |
Conclusion
These exercises have illustrated the power of computational chemistry. The calculated results are in good agreement with experimental findings, and molecular orbital analyses allow determination of any previously unforeseen stabilising or destabilising interactions, allowing anomalous structural and reactivity effects to be rationalised. The fact that transition states can be located using these programs is synthetically useful, as it will allow better, more efficient syntheses to be designed, to maximise yields and minimise the number of synthetic steps to form desired compounds.
References
- ↑ HF 3-21G TS (Berny) optimisation of boat transition stateDOI:10042/to-7209
- ↑ B3LYP optimisation of chair transition structureDOI:10042/to-7211
- ↑ B3LYP optimisation of boat transition structureDOI:10042/to-7212
- ↑ M. Karplus, J. Am. Chem. Soc., 1963, 85, 2870 DOI:10.1021/ja00901a059
- ↑ R.S. Rowland and R. Taylor, J. Phys. Chem., 1996, 100, 7384-7391 DOI:10.1021/jp953141+
- ↑ Frozen coordinate method optimisation of the endo transition structureDOI:10042/to-7213
- ↑ Frozen coordinate method optimisation of the exo transition structureDOI:10042/to-7214
