Rep:Mod:ht1010.2
Computational
The Hydrogenation of Cyclopentadiene Dimer
In the experiment below, we have studied the Diels Alder reaction between two cyclopentadiene molecules. The reaction occurs in a concerted fashion to produce predominantly the Endo product[1] and so we subsequently investigated the hydrogenation of each of the Endo product's c-c double bonds, as shown in the scheme below in figure 1.

To investigate the reason for the Endo selectivity of the dimerisation reaction, the two products were drawn in Avogadro and then optimised using a MMFF94(s)[2] force field. The resulting structures and their energies are shown below in figures 2 and 3. As shown, the Exo product is 2.81726 Kcal/mol lower in energy than the Endo product and is therefore the thermodynamic product of the reaction. This means that the Endo product must be the kinetic product of the reaction and the reaction must also be under kinetic control. This is in accordance with the general principle that Endo products of Diels Alder reactions usually have lower energy transition states than Exo products as a result of increased frontier molecular orbital overlap between the two reacting species.
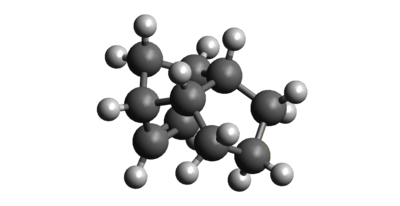
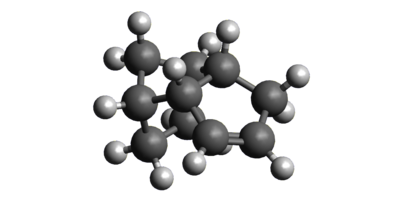
The Endo product was hydrogenated at each of its C-C double bonds in turn and the resulting structures were then optimized again using the MMFF94(s) force field. The resulting geometries and energies of the species are listed below in figures 4 and 5. As shown, hydrogenating the double bond in the bridged system resulted in a product which was 9.46536 Kcal/mol lower in energy than that resulting from hydrogenation at the alternative position. As such, if the hydrogenation reaction is under thermodynamic control, the major product will be that which is shown in figure 5. As can be seen, the largest contribution to the greater stabilization is from the angle bending energy, which is just 24.68523 Kcal/mol compared with 30.85378 Kcal/mol for the higher energy product. This is because the removal of the significant ring strain imposed on the molecule as a result of the c-c double bond in the norbornene cluster is much more stabilising than the removal of the lesser ring strain in the cyclopentene ring.
Shown below in figure 6 are two atropisomers of an important intermediate in the synthesis of Taxol which was first proposed by Paquette [3].The main difference between the two atropisomers is the orientation of the carbonyl group and when left to stand, the compound isomerises to the lower energy atropisomer [4].

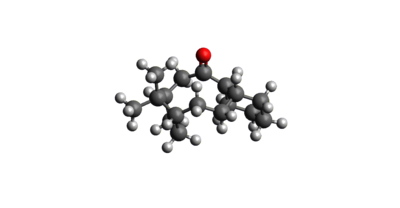
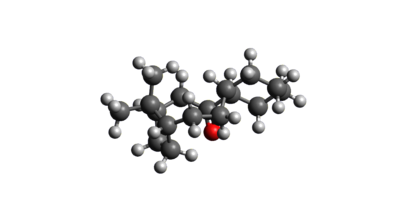
To find out which of the atropisomers was lower in energy, we drew the two geometries in Avogadro and optimized them using the MMFF94s force field. To further minimize the structures, the hexane ring on each was then manually manipulated into both the twist-boat and chair conformations in between further MMFF94s optimizations. After having manipulated the structures sufficiently so as to be confident in having located the minimum energy conformations, the structures and associated energies shown below in figures 7 and 8 were obtained. As shown, the configuration in figure 8 is 9.97039Kcal/mol lower in energy than that shown in figure 7. Upon inspection, it was immediately clear that the main energy difference between the two atropisomers was their angle bending energy, with a large difference of 9.46319Kcal/mol. This is largely a result of the increased deviation from the ideal sp2 bond angle of 120' for the two sp2 centers in figure 8 relative to figure 7, as shown below by the bond angles highlighted in blue. We can therefore conclude that the conformation shown in figure 8 is the thermodynamic product and so when figure 7 is left to stand, it isomerises into figure 8.
| Fig 7: | Fig 8: | ||||||
|---|---|---|---|---|---|---|---|
|
| ||||||
| Total energy (Kcal/mol) | |||||||
| 70.53924 | 60.56885 | ||||||
| Total bond stretching energy (Kcal/mol) | |||||||
| 7.70653 | 7.61680 | ||||||
| Total angle bending energy (Kcal/mol) | |||||||
| 28.31420 | 18.85101 | ||||||
| Total stretch bending energy (Kcal/mol) | |||||||
| -0.06465 | -0.14387 | ||||||
| Total torsional energy (Kcal/mol) | |||||||
| 0.16140 | 0.28519 | ||||||
| Total out of plane bending energy (Kcal/mol) | |||||||
| 0.96562 | 0.84997 | ||||||
| Total van der waals energy (Kcal/mol) | |||||||
| 33.15321 | 33.15687 | ||||||
| Total electrostatic energy (Kcal/mol) | |||||||
| 0.30294 | -0.04712 | ||||||
It has been reported that the alkene group in the above molecules undergoes functionalisation at a much slower rate than would be first assumed. This suggests that it is an example of a hyperstable alkene [5]. To investigate this, the hydrogenated product of the two atropisomers were drawn and MMFF94s optimized to give the two structures and energies shown below in figures 9 and 10. As can clearly be seen, the energy of the hydrogenated products is actually significantly higher than that of the original alkene structures. This destabilisation is due to an increase in the ring strain of the large ring, as a result of the saturation because of increased transannular and vicinal hydrogen interactions. As a result, the hydrogenated products are thermodynamically unfavourable with respect to the alkene reactants which is why they are considered hyperstable.
Spectroscopic Simulation using Quantum Mechanics
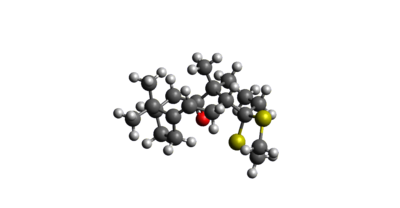
The structure shown below in figure 11 is a derivative of the taxol intermediate studied previously and shown above in figure 8. The structure was first MMFF94s optimised before being further optimised using the Becke three-parameter Lee-Yang-Parr exchange-correlation functional and 6-31G(d,p) basis set, while simultaneously calculating its NMR spectra using benzene as the solvent and TMS as the reference. The resulting structure is shown below in figure 11, alongside its thermodynamic data.
The NMR of the structure was calculated, the results of which are shown in figure 12 below, along with the predicted and experimental chemical shifts. As can clearly be seen, the calculated chemical shifts are in good agreement with the experimentally determined values. This gives us a good degree of confidence in both our determined conformation and also methodology.
 |
 |
Experimental chemical shifts Spectroscopic data[6]:
(300 MHz, c6D6) Shifts 5.21 (m, 1 H), 3.00-2.70 (m, 6 H), 2.70-2.35 (m, 4 H), 2.20-1.70 (m, 6 H), 1.58 (t, J= 5.4 Hz, 1 H), 1.50-1.20 (m,3 H), 1.10 (s, 3 H), 1.07 (s, 3 H), 1.03 (s, 3 H);
13C NMR (75 MHz C6D6) ppm 211.49, 148.72, 120.90, 74.61, 60.53, 51.30, 50.94, 45.53,43.28, 40.82, 38.73, 36.78, 35.47, 30.84.30.00, 25.56, 25.35, 22.21, 21.39,19.83
The NMR spectrum was also calculated using chloroform as a solvent as shown below in figures 14 and 15, to view the effect that differing solvents has on the signal.
 |
 |
Analysis of the properties of the synthesised alkene epoxides
In the following experiment, we investigated the structure of the Shi and Jacobsen asymmetric epoxidation catalysts and subsequently analysed their role in the epoxidation of two specific alkenes: β-methyl styrene and trans-Stilbene. The structures of the stable pre-catalyst of each of the catalysts were first found by searching the Cambridge Crystal Database [7] using Conquest. This yielded the two structures shown below in figures 16 and 17.
| Fig.16: Shi asymmetric epoxidation pre-catalyst [8] | Fig.17: Jacobsen asymmetric epoxidation pre-catalyst [9] |
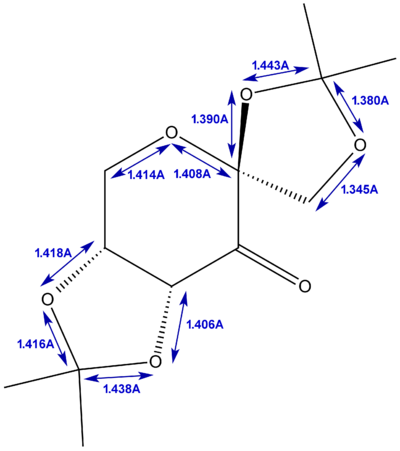
From the structure of the Shi assymetric epoxidation pre-catalyst above, we measured the bond lengths around the anomeric centres for the two crystallographically unique structures, the results of which are shown below in figures 18 and 19.
 |
 |
From the structure of the Jacobsen assymetric epoxidation pre-catalyst above, we then also measured the interatomic distance between the hydrogen atoms on the tertiary butyl ring substituents for each of the crystallographically unique structures, as shown below in figures 20 and 21. As can be seen, there are 4 reasonably short H-H distances in each of the structures, with all but one of these distances in the strongly Van der Waals attractive range. This is because the maximum attraction for H-H corresponds to a distance of 2.4A, and becomes repulsive at distances less than 2.1A [10]. As such, the 2.081A H-H distance found on one of the structures is within this repulsive range and so will act to destabilise the structure by raising its energy.
 |
 |
Analysis of epoxidation products of β-methyl styrene and trans-Stilbene
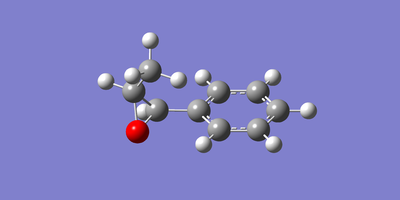
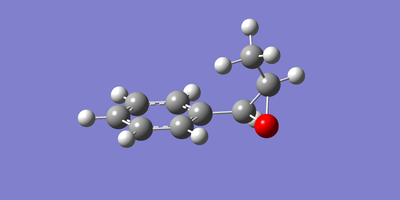
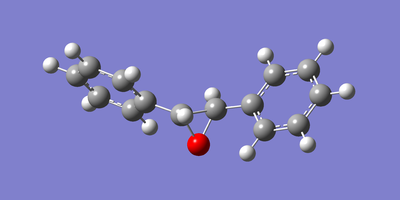
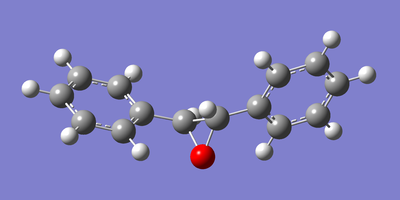
The two enantiomeric structures of each of the epoxidised β-methyl styrene and trans-stillbene were drawn in GaussView and optimised using the Becke three-parameter Lee-Yang-Parr exchange-correlation functional and 6-31G(d,p) basis set. The resulting optimized structures are shown below in figures 22 to 25.
 |
 |
 |
 |
For help in later characterisation of the products, the H and C NMR of the two compounds were then calculated using chloroform as a solvent and TMS as a reference, the resulting spectra of which is shown below in figures 26 and 27.
 |
 |
 |
 |
To enable enantiomeric identification, the optical rotation of each of the products was calculated at 589nm using the B3LYP 6-31G(d,P) optimized structures. As can be seen, these agree well with the literature values giving us good confidence in our methodology and assignments. To illustrate the susceptability of the optical rotation method to slight structural changes, we also calculated the optical rotation for the structures only optimised to the MMFF94s level of theory. As can be seen, this had a very drastic effect on the optical rotation values produced by the calculations and so highlighted the need for well optimised structures in this regard.
| Structure | MMFF94s optimized Optical Rotation at 589nm (degrees) | B3LYP 6-31G(d,p) optimized Optical Rotation at 589nm (degrees) | Experimental Optical Rotation at 589nm (degrees) |
|---|---|---|---|
| SS-2-Methyl-3-phenyloxirane | -119.60 | -37.57 | -37.8 [11] |
| RR-2-Methyl-3-phenyloxirane | 119.16 | 37.00 | 37.8 [12] |
| SS-trans-stillbene oxide | 13.33 | 298.22 | 239.2 [13] |
| RR-trans-stillbene oxide | -26.23 | -297.75 | -239.2 [14] |
The VCD spectrum of each of the structures was then also calculated as shown below in figures 30 to 32. As expected the enantiomers produced reflections of the vcd spectrum of their enantiomeric partners.
 |
 |
 |
 |
Transition state analysis
We set out to analyse the non covalent interactions in the active site of the reaction transition state for the Jacobsen catalyst in the epoxidation of SS-trans-β-methyl styrene, to gain a further insight into the selectivity of the catalyst. As such, to find the lowest energy transition state for the reaction, the sum of electronic and zero-point energies for the two transition states were inspected, revealing one was lower at -3383.188478 (Hartree/Particle) and the other was -3383.184384 (Hartree/Particle). As such, the lower energy transition state (DOI:10042/25945 ) was submitted to NCI analysis, the results of which are shown below in figure 34. As can clearly be seen, there is an extensive plane of non covalent interaction between the Jacobsen catalyst and the forming epoxide.
| Fig.34: Non covalent interactions in the active site of the reaction transition state for the Jacobsen catalyst in the epoxidation of SS-trans-β-methyl styrene |
Further Work
A synthetically accessible molecule worth further investigation which has a large reported optical rotary power of -580 degrees is trans-(2R,3R)-2-(4-methylphenyl)-3-phenyl oxirane [15], the structure of which is shown below in figure 35.

References:
- ↑ Hydrogenation of Cyclopentadiene Dimer, Org Comp Lab Manual, Imperial College London [1]
- ↑ Thomas A. Halgren, J.Comp.Chem;1996; 450-519, DOI:<490::AID-JCC1>3.0.CO;2-P 10.1002/(SICI)1096-987X(199604)17:5/6<490::AID-JCC1>3.0.CO;2-P
- ↑ S. W. Elmore and L. Paquette, Tetrahedron Letters, 1991, 319; DOI:10.1016/S0040-4039(00)92617-0 10.1016/S0040-4039(00)92617-0 10.1016/S0040-4039(00)92617-0 10.1016/S0040-4039(00)92617-0 10.1016/S0040-4039(00)92617-0
- ↑ Spectroscopic Simulation using Quantum Mechanics, Org Comp Lab Manual, Imperial College London [2]
- ↑ W. F. Maier, P. Von Rague Schleyer, J. Am. Chem. Soc., 1981, 103, 1891. DOI:10.1021/ja00398a003
- ↑ L. Paquette, N. A. Pegg, D. Toops, G. D. Maynard, R. D. Rogers, J. Am. Chem. Soc.,, 1990, 112, 277-283. DOI:10.1021/ja00157a043
- ↑ The Cambridge Crystal Database [3]
- ↑ M.Durik, D.Gyepesova, J.Micova, B.Steiner, M.Koos, Acta Crystallogr.,Sect.E:Struct.Rep.Online (2001), 57, 0672 DOI:10.1107/S160053680101073X
- ↑ J.W.Yoon, T.S.Yoon,S.W.Lee,W.Shin, Acta Crystallogr.,Sect.C:Cryst.Struct.Commun. (1999), 55, 1766 DOI:10.1107/S0108270199009397
- ↑ H.Rzepa, Conformational Analysis, Imperial College London [ http://www.ch.ic.ac.uk/local/organic/conf/]
- ↑ Wong, O. Andrea, Wang, Bin, Zhao, Mei-Xin, Shi, Yian, Journal of Organic Chemistry,2009, vol.74, 16, p.6335-6338
- ↑ Wong, O. Andrea, Wang, Bin, Zhao, Mei-Xin, Shi, Yian, Journal of Organic Chemistry,2009, vol.74, 16, p.6335-6338
- ↑ Denmark,Scott E, Matsuhashi,Hayao,Journal of Organic Chemistry, 2002, vol.67, 10 p.3479-3486
- ↑ Denmark,Scott E, Matsuhashi,Hayao,Journal of Organic Chemistry, 2002, vol.67, 10 p.3479-3486
- ↑ Dansette,P.M. et al. Tetrahedron, 1976 , vol. 32, p. 2071-2074
Calculations
B3LYP/6-31g(d,p) optimized Taxol intermediate and NMR calculation, chloroform solvent DOI:10042/26375
B3LYP/6-31g(d,p) optimized Taxol intermediate and NMR calculation, Benzene solvent DOI:10042/26371
B3LYP/6-31g(d,p) optimized 2-Methyl-3-phenyloxirane and NMR calculation, chloroform solvent DOI:10042/26372
B3LYP/6-31g(d,p) optimized Trans-stillbene oxide and NMR calculation, chloroform solvent DOI:10042/26375
Optical Rotation calculation on B3LYP/6-31g(d,p) optimized SS-2-Methyl-3-phenyloxirane, chloroform solvent DOI:10042/26497
Optical Rotation Calculation on B3LYP/6-31g(d,p) optimized RR-2-Methyl-3-phenyloxirane, chloroform solvent DOI:10042/26498
Optical Rotation calculation on B3LYP/6-31g(d,p) optimized SS-trans-stillbene oxide, chloroform solvent DOI:10042/26500
Optical Rotation calculation on B3LYP/6-31g(d,p) optimized RR-trans-stillbene oxide, chloroform solvent DOI:10042/26499
Optical Rotation calculation on MMFF9s optimized SS-2-Methyl-3-phenyloxirane, chloroform solvent DOI:10042/26502
Optical Rotation Calculation on MMFF9s optimized RR-2-Methyl-3-phenyloxirane, chloroform solvent DOI:10042/26501
Optical Rotation calculation on MMFF9s optimized SS-trans-stillbene oxide, chloroform solvent DOI:10042/26504
Optical Rotation calculation on MMFF9s optimized RR-trans-stillbene oxide, chloroform solvent DOI:10042/26503
VCD calculation on B3LYP/6-31g(d,p) optimized SS-2-Methyl-3-phenyloxirane, chloroform solvent DOI:10042/26505
VCD calculation on B3LYP/6-31g(d,p) optimized RR-2-Methyl-3-phenyloxirane, chloroform solvent DOI:10042/26506
VCD calculation on B3LYP/6-31g(d,p) optimized SS-trans-stillbene oxide, chloroform solvent DOI:10042/26508
VCD calculation on B3LYP/6-31g(d,p) optimized RR-trans-stillbene oxide, chloroform solvent DOI:10042/26507

