Rep:Mod:hsmhb29
3rd Year Computational Laboratory; Module 2; Jubeda Hena (00641785)
Introduction
The aim of this lab is to give an insight into the structure and bonding of complexes. By doing computational studies the energy of stable conformers can be differentiated between. Also transition states and activated complexes can be located, which may not be possible to get to experimentally. During this course Gaussian and GaussView will be used to look at BH3,, TlBr3, NH3, BBr3 and NH3.BH3. The molecules will be created, optimised using range of basis sets and for a number of the molecules a frequency and population analysis will be carried out.
For the second part of the course a mini project will be completed, looking into the lewis acidity and basicity of Al2Cl4Br2. The molecules will be optimised using both pseudo-potentials and basis sets along with a frequency and population analysis being conducted.
Part 1:
Optimising a Molecule
Optimised BH3 Molecule
The first part of this course was to familiarize ourselves with Gaussian and GaussView. First a molecule of BH3 was created. Hydrogen is represented by the grey colouring while Boron is represented by pink.
Once a BH3 molecule was created the bond lengths were manipulated so that each B-H bond distance was 1.5 Å. Next an optimisation was ran using B3LYP as the method, 3-21G as the basis set and OPT (for optimisation) to show what type of calculation is taking place. For the rest of the wiki operations run by Gaussian will be represented as: the method, the basis set, type of calculation, so for the first optimisation: B3LYP, 3-21G, OPT was run.
The optimisation file is linked to File:BH3 OPT.LOG
After the optimisation the following results were obtained:
| Optimised B-H Bond Distance | Optimised B-H-B Bond Angle |
|---|---|
| 1.19 Å | 120.00 |
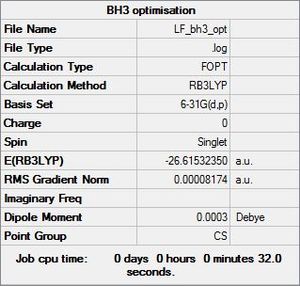
The summary shows a gradient close to zero showing that optimisation went to completion along with the following results:
         Item               Value     Threshold  Converged?
 Maximum Force            0.000413     0.000450     YES
 RMS     Force            0.000271     0.000300     YES
 Maximum Displacement     0.001610     0.001800     YES
 RMS     Displacement     0.001054     0.001200     YES
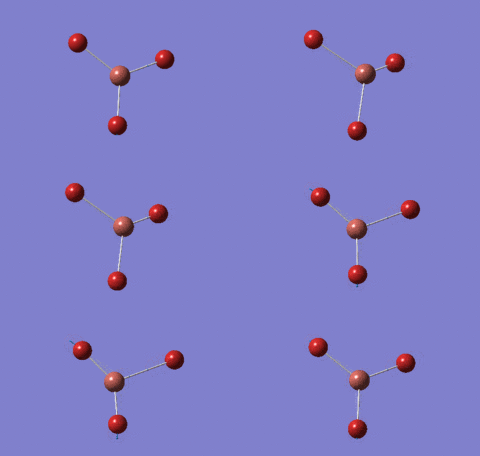
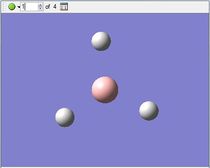
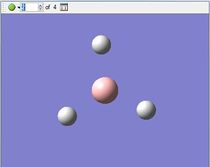
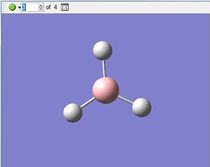
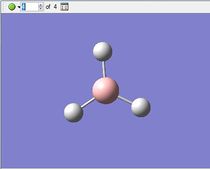
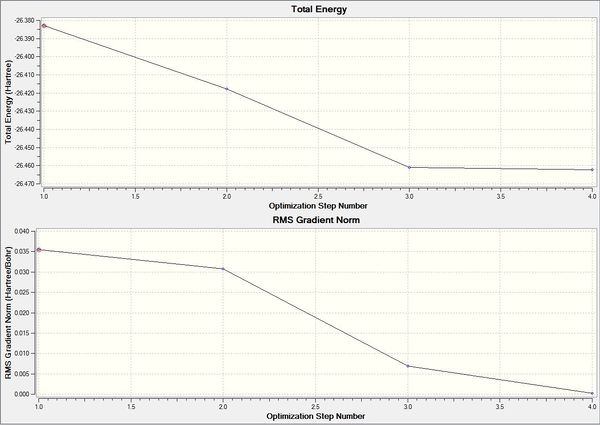
To understand what is happening during an optimisation the following graph was obtained to see how the energy and gradient changed over the optimisation. There were four steps during the optimisation shown by the following positions of the nuclei shown in Table (2). The RMS Gradient Norm graph (Figure 3) shows the gradient converging towards zero as the molecule is optimised. This is shown in the summary table above (Figure 2). While the Total Energy graph shows the potential energy surface of BH3 traversing to find the minimum energy structure.
| Step 1 | Step 2 | Step 3 | Step 4 |
|---|---|---|---|
 |
 |
 |
|
Using a Better Basis Set: 6-31G(d,p)
The optimised geometry was then used to start a new optimisation using a higher level basis set. B3LYP, 6-31G(d,p), OPT
The optimisation file is linked to File:BH3 OPT 631G DP.LOG
The link for optimised BH3 is DOI:10042/23446
A summary table is shown below along wit the item table to confirm that the convergence went to completion.
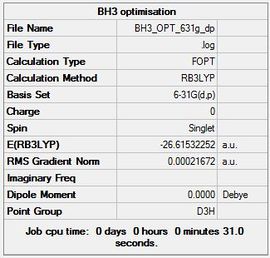
          Item               Value     Threshold  Converged?
 Maximum Force            0.000433     0.000450     YES
 RMS     Force            0.000284     0.000300     YES
 Maximum Displacement     0.001702     0.001800     YES
 RMS     Displacement     0.001114     0.001200     YES
The inquiry button was used to determine the following information:
| Optimised B-H Bond Distance | Optimised B-H-B Bond Angle |
|---|---|
| 1.19 Å | 120.00 |
The literature value for a B-H bond distance is 1.23 Å [1].
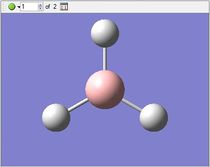
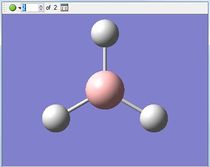
The optimisation for this required two steps shown by the following graphs and nuclei positions.
| Step 1 | Step 2 |
|---|---|
 |
|

Reporting Total Energies
The total energies of the two optimisations are shown in Table 5.
| Basis Set | Total Energy (a.u.) | Total Energy (kJ/mol) |
|---|---|---|
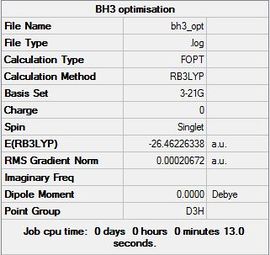
| 3-21G | -26.46226338 | -69476.68 |
| 6-31G(d,p) | -26.61532252 | -69878.53 |
The total energies have been reported but have not been compared as they have been obtained using different basis sets making them incomparable.
Results of TlBr3
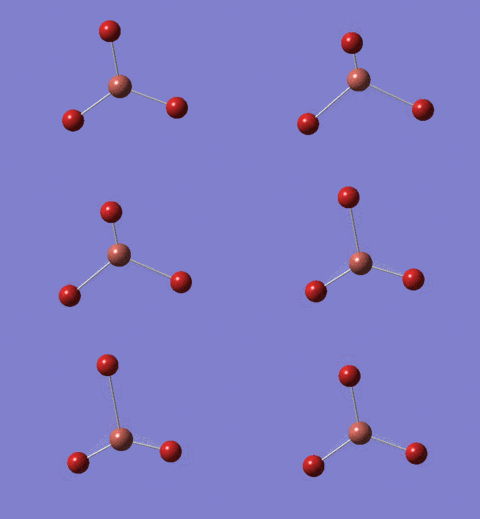
An optimisation was carried out for TlBr3. The symmetry of the molecule was set to the point group D3h and the tolerance was increased to very tight (0.0001). A medium level basis set of LanL2DZ was used therefore the calculation B3LYP, LanL2DZ, OPT was carried out.
The Gaussian file for the optimisation can be found here File:Optimisation.log along with the link to the D-Space DOI:10042/23357

The summary table (Figure 7) and item tables are shown below:
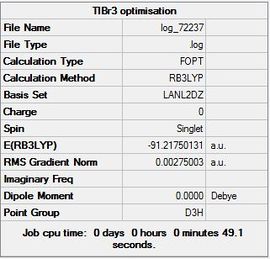
          Item               Value     Threshold  Converged?
 Maximum Force            0.000002     0.000450     YES
 RMS     Force            0.000001     0.000300     YES
 Maximum Displacement     0.000022     0.001800     YES
 RMS     Displacement     0.000014     0.001200     YES
The inquiry button was used to find the following information and then compared to literature.
| Optimised Tl-Br Bond Distance | Optimised Br-Tl-Br Bond Angle |
|---|---|
| 2.69 Å | 120.00 |
The literature value was found to be 2.51 Å [2]. The value obtained from the Gaussian optimisation is slightly larger than the one in literature.
BBr3
For heavy atoms pseudo-potentials are required and for light atoms a full basis set is needed. A calculation was run for BBr3 mixing pseudo-potentials with basis sets. A calculation using the GEN basis set was used which specifies basis sets for each atom individually. Pseudo-potentials were also set to be specified for each atom individually. Some additional information was added to the input file to have a full basis set for the Boron atom and pseudo-potentials for the Bromine atoms.
The file for the completed BBr3 optimisation is File:Log 72238.log and the link to is here DOI:10042/23347
The summary table is included below (Figure 8) along with the item table to show that the optimisation went to completion.
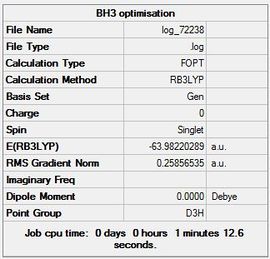
          Item               Value     Threshold  Converged?
 Maximum Force            0.000246     0.000450     YES
 RMS     Force            0.000161     0.000300     YES
 Maximum Displacement     0.001151     0.001800     YES
 RMS     Displacement     0.000754     0.001200     YES
The following information about geometry was obtained:
| Optimised B-Br Bond Distance | Optimised Br-B-Br Bond Angle |
|---|---|
| 1.93 Å | 120.00 |
The literature value for the B-Br bond was found to be 1.96 Å [3]. This is quite close to the one from the calculated optimisation.
Analysing Results
| Molecule | Bond Length (Å) |
|---|---|
| BH3 | 1.19 |
| TlBr3 | 2.69 |
| BBr3 | 1.93 |
From Table (6) the bond lengths of the three molecules BH3, TlBr3 and BBr3 can be seen. Changing the ligand for Boron, so going from Hydrogen to Bromine increases the bond length. This can be reasoned by the fact that Bromine is a much larger ligand compared to Hydrogen. This means that Bromine has a much more diffuse outer electron shell resulting in poorer overlap with the Boron central element thus resulting in the longer bond distance indicating the weakness of the bond compared to a B-H bond. Differences other than the size between Bromine and Hydrogen include the electronegativities of the two elements. Bromine is more electronegative than Hydrogen making the B-Br more polar than B-H bonds. Similarities include that both Bromine and Hydrogen are X-type ligands containing one electron in their valence shells.
Next looking at changing the central atom the bond lengths for Tl-Br and B-Br are looked at. As Thalium is in row 6 of the periodic table compared to row 2 for Boron it is a much larger atom. Due to the larger more diffuse orbital the same argument as above can be applied that the Thalium has poorer overlap with its ligand Bromine compared to Boron and Bromine hence resulting in the weaker and longer bond distance. The similarity between the two central elements is that they are both in group 13 of the periodic table containing 3 valence electrons. A difference would be the oxidation states the two adopt with Boron having a +3 oxidation state and Thalium having a +1 oxidation state due to the inert pair effect.
What is a Bond?
For some structures GaussView does not draw in bonds where one might expect. However, this does not mean that the bonds are not present. The reason the bond is not drawn in is because GaussView draws bonds on a distance criteria. When these bonds are not drawn in it means that the distance exceeds some pre-defined value.
Bonds can be defined as ionic, covalent or metallic. In a covalent bond the electrons are shared between the orbitals involved and can be broken down into Van der Waals Forces, Hydrogen Bonding and Dipole-Dipole interactions. For an ionic bond, electrons are donated and accepted between two species and an electrostatic interaction is formed between the species involved. Lastly metallic bonding is the electrostatic interactive force between delocalised electrons and the positively charged ions.
A bond is essentially a region of high electron density where atoms are able to interact with one another creating a larger article between the two.
Frequency Analysis
The next part of these labs was to carry out a frequency analysis. This was to confirm that the structures obtained contained a minimum. For this section the BH3 molecule was recreated and reoptimised as above but this time not changing the bond distance to 1.5 Å. For this part of the analysis in GaussView under the job type calculation instead of choosing Optimisation, Frequency was now chosen.
BH3
The link for the completed frequency analysis is File:JUBEDAHENA BH3 FREQ.LOG
The summary (Figure 9) and item tables are provided below along with the low frequency data which shows that a minimum was obtained by the positive values in the second row.

          Item               Value     Threshold  Converged?
 Maximum Force            0.000006     0.000450     YES
 RMS     Force            0.000003     0.000300     YES
 Maximum Displacement     0.000023     0.001800     YES
 RMS     Displacement     0.000011     0.001200     YES
  Full mass-weighted force constant matrix:
 Low frequencies ---   -0.9432   -0.8611   -0.0054    5.7455   11.7246   11.7625
 Low frequencies --- 1162.9963 1213.1826 1213.1853
A table summarising the vibrational motions, frequencies and intensities for trigonal planar BH3 is shown below (Table 7):
An IR spectrum of the BH3 molecule is shown below (Figure 10).

The spectrum shows less than six peaks even though there are six vibrations. The reason for this is that for an IR peak to be active there needs to be a change in the dipole moment. Vibration 4 from Table 7 shows the intensity of B-H symmetric stretching to be zero. As there is no change in dipole for this, this peak is not present in the spectrum. Vibrations 2 & 3 have the same frequencies as do vibrations 5 & 6 as they are degenerate and have e' symmetry. As these four peaks overlap with their respective pairs only two peaks are seen rather than four. Therefore, this is why three peaks are seen rather than the expected six.
TlBr3
A frequency analysis was carried out for TlBr3 using the previously optimised molecule.
The file for the calculation is File:Frequency.log and the link is here DOI:10042/23357
The summary table (Figure 11), item table and low frequencies are included below.
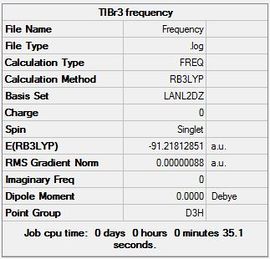
          Item               Value     Threshold  Converged?
 Maximum Force            0.000002     0.000450     YES
 RMS     Force            0.000001     0.000300     YES
 Maximum Displacement     0.000022     0.001800     YES
 RMS     Displacement     0.000011     0.001200     YES
  Low frequencies ---   -3.4213   -0.0026   -0.0004    0.0015    3.9367    3.9367
 Low frequencies ---   46.4289   46.4292   52.1449
The lowest "real" normal mode has a frequency of 46.4289 cm-1.
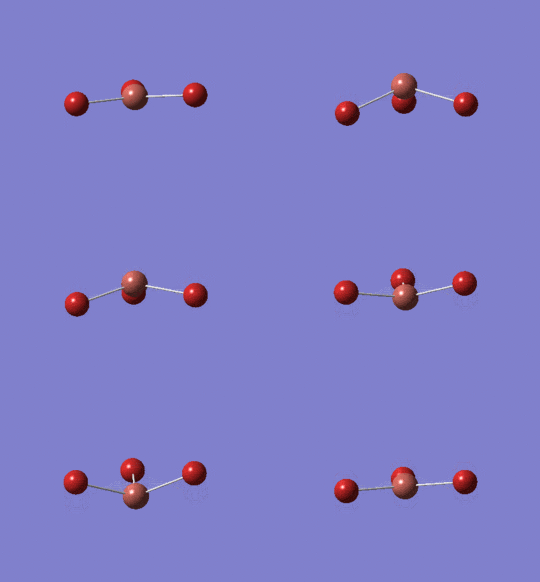
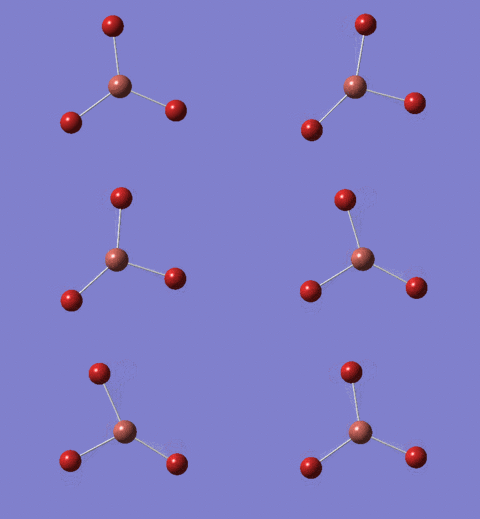
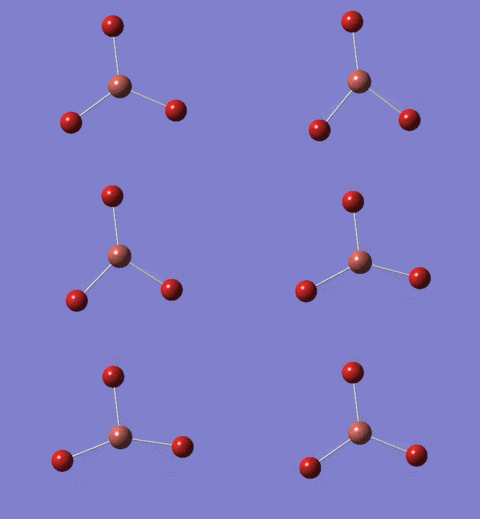
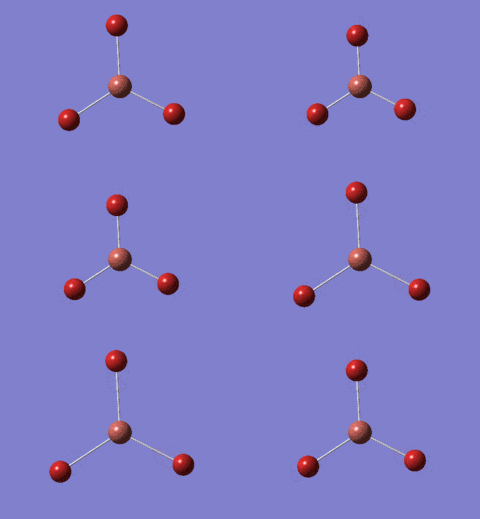
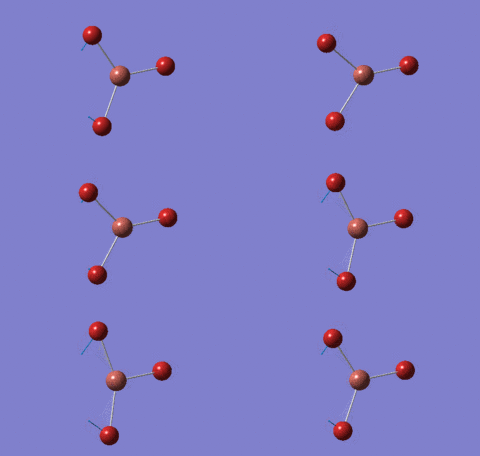
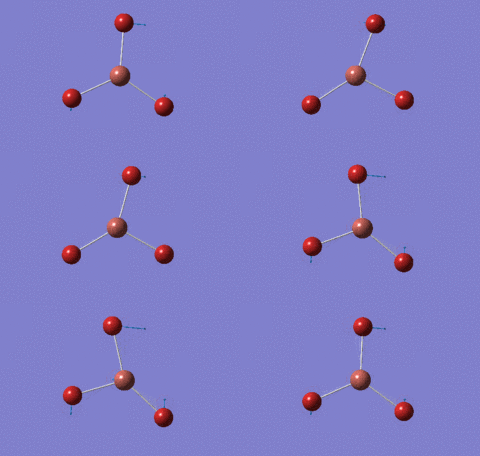
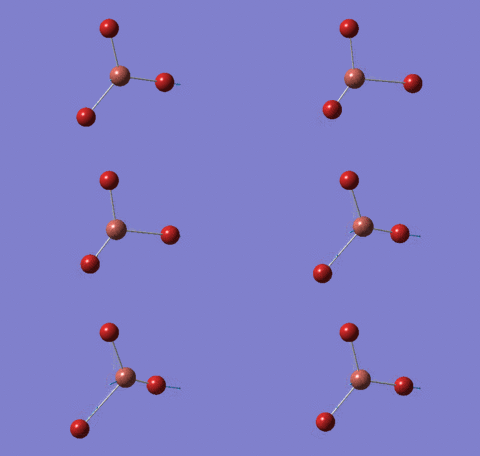
The frequencies of TlBr3 and its vibrational modes are shown in Table 8.
The IR spectrum of TlBr3 (Figure 12) is included below:
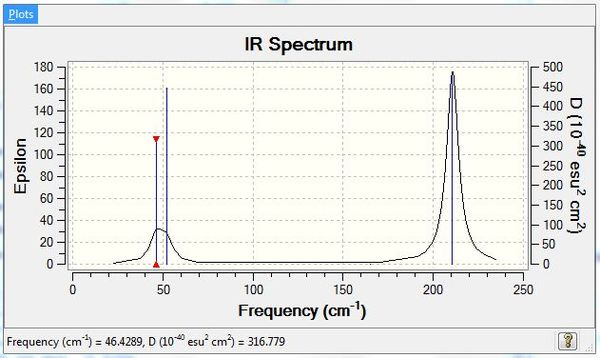
Once again there are only three peaks seen instead of six for the same reasons mentioned above for BH3 where there are two sets of degenerate frequencies and one the peaks is inactive with zero intensity due to having no change in dipole moment.
BH3 & TlBr3 Compared
| BH3 | TlBr3 | ||
|---|---|---|---|
| Symmetry Label | Frequency | Symmetry Label | Frequency |
| a2" | 1163 | e' | 46 |
| e' | 1213 | e' | 46 |
| e' | 1213 | a2" | 52 |
| a1' | 2582 | a1' | 165 |
| e' | 2715 | e' | 211 |
| e' | 2715 | e' | 211 |
What does the large difference in the value of the frequencies for BH3 compared to TlBr3 indicate?
Table 9 shows both vibrational frequencies and symmetry labels for the two molecules BH3 and TlBr3. From looking at the table it can be seen that BH3 has much higher frequencies than TlBr3. This links in with the relative strengths of the B-H bonds and Tl-Br bonds which is discussed in section 2.1.6 above where in Table 6 it shows BH3 has a much shorter bond lengths than TlBr3. This indicates that Tl-Br bonds are weaker than B-H bonds due to Thalium and Bromine being much larger than Boron and Hydrogen hence having more diffuse orbitals.
Has there been a reordering of modes?
Although both molecules have the same point group and therefore the same symmetry labels there has been a slight reordering of modes. For BH3 the weakest vibrational mode is the a2" bending whereas the degenerate e' bending modes for TlBr3 are the weakest modes. For the three stretching modes these are of the same order for the two molecules.
How are these spectra similar?
Figures 10 and 12 shows the IR spectrums for BH3 and TlBr3 respectively. Both show three peaks instead of the expected six, reasons for which have been discussed above. The BH3 has much sharper peaks than TlBr3 which shows two of the peaks merging to form one broad peak. For both molecules the stretching vibrational modes lie at higher frequencies than the bending modes.
For both spectra two modes lie fairly close together, the A2 and E' modes and then the other two modes also lie fairly close together, the A1' and E' modes, but higher in energy. Why is this?
The two modes A2 and E' which lie fairly close together are representative of bending modes which are lower in energy than the corresponding vibrational modes A1' and E'. The reason for this is that the barrier for the vibrations are generally much higher than the barriers for bending.
Why must you use the same method and basis set for both the optimisation and frequency analysis calculations?
The reason the same method ad basis set is used for the optimisation and frequency analysis is so that the results can be compared. If a different basis set or method is used then slight changes in energy can make big differences making the results incomparable.
What is the purpose of carrying out a frequency analysis?
The purpose of carrying out a frequency analysis is so that it can be confirmed that a minimum structure has been obtained.
What do the "Low frequencies" represent?
The low frequencies show the "-6" part of the 3N-6 vibrational frequencies which are the motions of the centre of mass of the molecule. If the values do not lie within +/- 15 cm-1 then this can indicate the calculation having gone wrong.
Molecular Orbitals
The next step was to use Gaussian to create the molecular orbitals and compare this to LCAO theory. A molecular orbital diagram was created in ChemDraw for BH3 and is shown below (Figure 14). A calculation was carried out in GaussView using the previously optimised 6-31G(d,p) BH3 molecules: B3LYP, 6-31G(d,p), Energy.
Summary table:
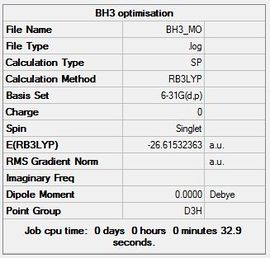
The file is linked to File:MOcheckpoint 72253.fchk
and DOI:10042/23358
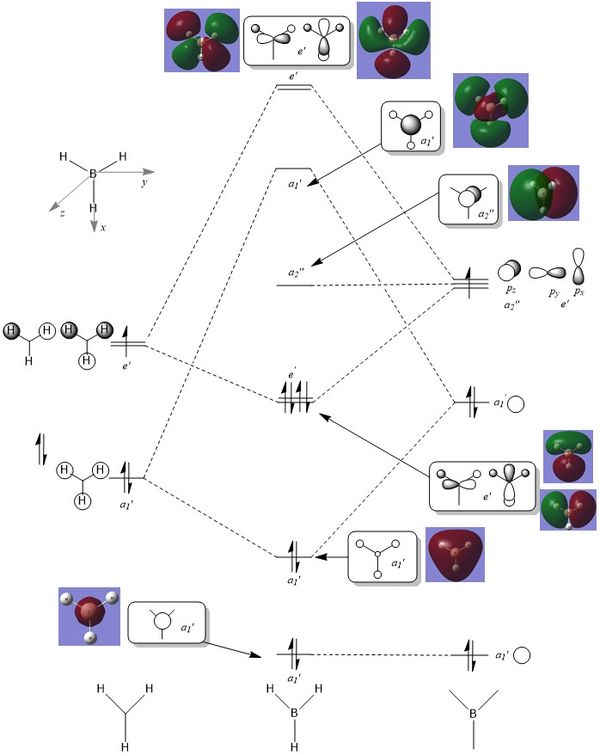
The computed molecular orbitals resemble the orbitals obtained from LCAO theory. They have the same orbital phase overlap and can therefore it can be assumed that the accuracy and usefulness of qualitative MO theory is valid.
NBO Analysis
NH3 Optimisation Practice
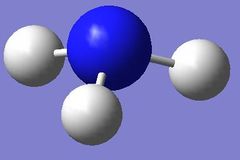
A molecule of NH3 was created and optimised: B3LYP, 6-31G(d,p), OPT.
The summary table (Figure 16) and item table are shown below along with the links to the Gaussian log file and D-Space.
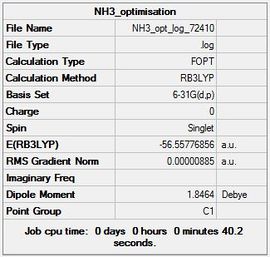
          Item               Value     Threshold  Converged?
 Maximum Force            0.000024     0.000450     YES
 RMS     Force            0.000012     0.000300     YES
 Maximum Displacement     0.000079     0.001800     YES
 RMS     Displacement     0.000053     0.001200     YES
File:NH3 opt log 72410.log and DOI:10042/23410
Frequency Analysis
A frequency analysis was carried out for NH3 using the previously optimised molecule. B3LYP, 6-31G(d,p), Frequency.
The file is linked to here File:NH3 freq log 72413.log and here DOI:10042/23411
The summary table (Figure 17) is shown below along with the low frequencies and item table:
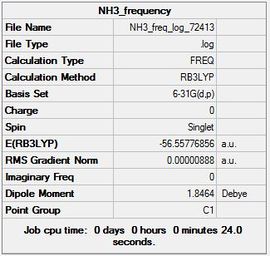
          Item               Value     Threshold  Converged?
 Maximum Force            0.000021     0.000450     YES
 RMS     Force            0.000009     0.000300     YES
 Maximum Displacement     0.000077     0.001800     YES
 RMS     Displacement     0.000039     0.001200     YES
 Low frequencies ---  -30.7764   -0.0017   -0.0008    0.0011   20.3142   28.2484
 Low frequencies --- 1089.5557 1694.1237 1694.1868
From the frequency analysis it can be seen that there are no negative values.
Population Analysis
With the same optimised molecule a population analysis was carried out B3LYP, 6-31G(d,p), Energy; linked to here File:NH3 opt energy log 72414.log and DOI:10042/23412 with the summary table (Figure 18) below:

Using the population analysis a molecular orbital diagram was obtained shown in Figure 19 below.
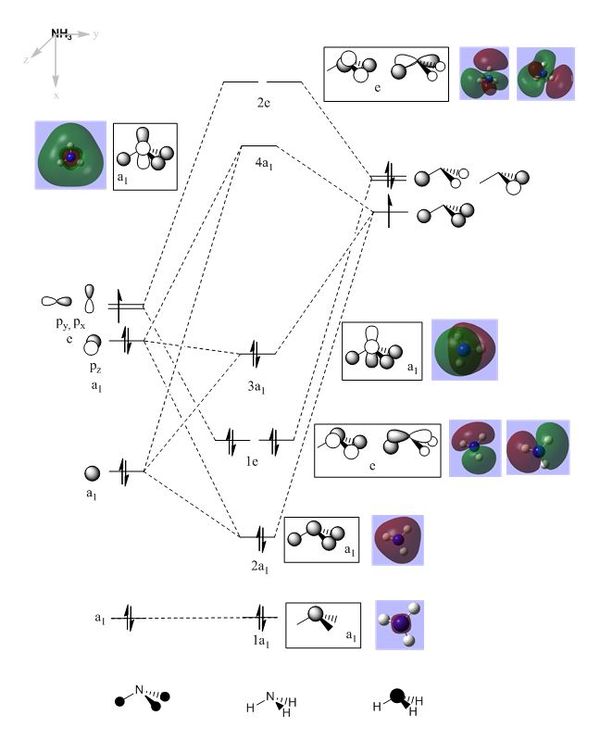
NBO Analysis
Using the log file from the population analysis and NBO analysis was carried out. Figure 20 shows the charge distribution of NH3 where red indicates negative charge and green positive charge. The charge range is from -1.125 to 1.125.
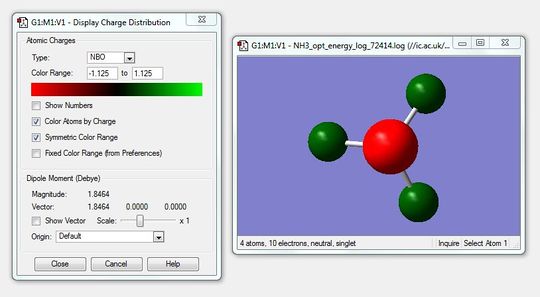
Next the colour atoms by charge function was disabled and the charge numbers were shown which is shown in the figure below.
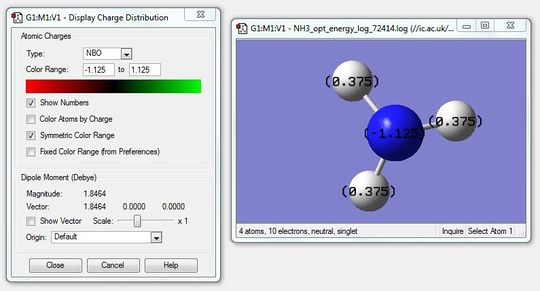
The specific charges for the hydrogens is 0.375 and -1.125 for the nitrogen atom.
NH3.BH3
The last task for Part 1 was to create a molecule of Ammonia-Borane, optimise and analyse this molecule.

3-21G Basis Set
An initial calculation of B3LYP, 3-21G, OPT was carried out giving the following results.
The link to the file is here File:NH3 BH3 opt log 72424.log and DOI:10042/23413 10042/23413
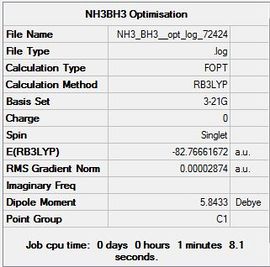
          Item               Value     Threshold  Converged?
 Maximum Force            0.000082     0.000450     YES
 RMS     Force            0.000030     0.000300     YES
 Maximum Displacement     0.000585     0.001800     YES
 RMS     Displacement     0.000204     0.001200     YES
6-31G(d,p)
Next using the optimised molecule an optimisation using a higher basis set was done; B3LYP, 6-31G(d,p), OPT.
The Gaussian log file can be found here File:NH3 BH3 6 31G dp opt log 72427.log and DOI:10042/23414

          Item               Value     Threshold  Converged?
 Maximum Force            0.000150     0.000450     YES
 RMS     Force            0.000041     0.000300     YES
 Maximum Displacement     0.001104     0.001800     YES
 RMS     Displacement     0.000331     0.001200     YES
Frequency Analysis
The 6-31G(d,p) optimised molecule was then used to carry out a frequency analysis and the file can be found here File:NH3 Bh3 freq log 72429.log and here DOI:10042/23415
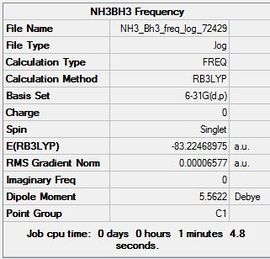
          Item               Value     Threshold  Converged?
 Maximum Force            0.000297     0.000450     YES
 RMS     Force            0.000066     0.000300     YES
 Maximum Displacement     0.001600     0.001800     YES
 RMS     Displacement     0.000475     0.001200     YES
  Low frequencies ---   -9.7439   -0.0007   -0.0005    0.0004   10.2232   23.6187
 Low frequencies ---  263.7041  631.1551  637.3494
The positive low frequencies show that a minimum was obtained.
Population Analysis
Lastly a population analysis was carried out using the optimised 6-31G(d,p) molecule to give the following results linked to here File:NH3 BH3 pop log 72430.log and DOI:10042/23416 10042/23416
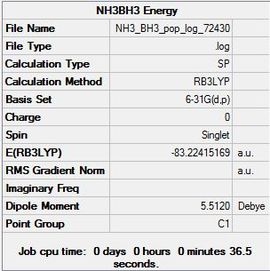
Dissociation Energy
| Molecule | Energy (a.u.) | Energy (kJ/mol) |
|---|---|---|
| BH3 | -26.61532252 | -69878.53 |
| NH3 | -56.55776856 | -148492.43 |
| NH3.BH3 | -83.22468986 | 218506.44 |
To obtain the association energy the following formula is used:
∆E = E(NH3.BH3) - [E(NH3) + E(BH3)]
= E(-83.22468986) - [(-56.55776856) + (-26.61532252)]
= -0.05159878 a.u.
Converting this to kJ/mol gives 135.47260721 kJ/mol = -135.47 kJ/mol
Comparing this to the literature value of -172.1 kJ/mol [4] it can be seen that there is some difference however it is around the right ballmark.
Part 2:
Lewis Acids and Bases
For the second part of these computational labs, Mini Project 1 was chosen: Lewis Acids and Bases. In this part of the project the molecule Al2Cl4Br2 will be looked at along with its conformers, vibrations and molecular orbitals. Any the Al2Cl4Br2 can be calculated as a complex between two neutral AlCl2Br monomers where one is a lewis acid and the other a lewis base discrepancies may be due to poor treatment of non-local correlation effects in the DFT method used. This prevents weak interactions like Van der Waals forces to be treated correctly. [5]
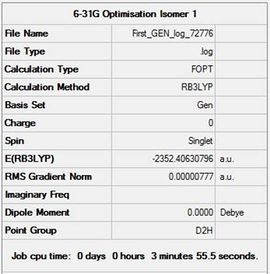
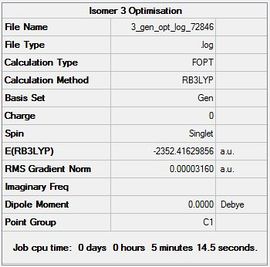
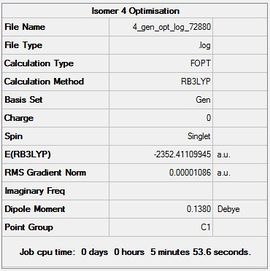
The first task was to determine the four possible isomers that could be formed from the AlCl2Br monomers. These are shown in the table below along with the symmetry of each isomer and energy details. Chlorine atoms are shown in green, red for Bromine and pink for Aluminium.
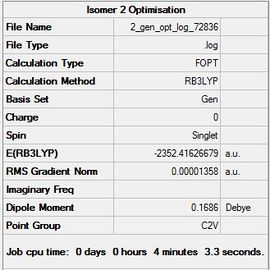
The energies for each isomer have been computed below using a full basis set 6-31G(d,p) for Al and Cl and a pseudo-potential LanL2dZdp for Br. A B3LYP, 3-21G, OPT was done for all four isomers followed by B3LYP, 6-31G(d,p), OPT calculation. The optimised molecules were then used to do a GEN method calculation incorporating the basis sets and pseudo potentials and the was file edited to enter the following:
 Al 0
6-31G(d,p)
****
Cl 0
6-31G(d,p)
****
Br 0
LanL2DZ
****

Br 0
LanL2DZ
| Molecule | Image | Summary Table | Item Table | Energies (a.u.) | Energies (kJ/mol) | Link |
|---|---|---|---|---|---|---|
| Isomer 1 | 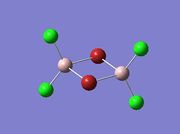 |
 |
Item Value Threshold Converged? Maximum Force 0.000029 0.000450 YES RMS Force 0.000011 0.000300 YES Maximum Displacement 0.000682 0.001800 YES RMS Displacement 0.000283 0.001200 YES |
-2352.40630796 | -6176243.23 | File:First GEN log 72776.log |
| Isomer 2 | 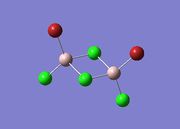 |
 |
Item Value Threshold Converged? Maximum Force 0.000015 0.000450 YES RMS Force 0.000009 0.000300 YES Maximum Displacement 0.000801 0.001800 YES RMS Displacement 0.000229 0.001200 YES |
-2352.41626679 | -6176269.38 | File:2 gen opt log 72836.log |
| Isomer 3 | 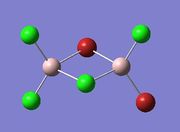 |
 |
Item Value Threshold Converged? Maximum Force 0.000050 0.000450 YES RMS Force 0.000018 0.000300 YES Maximum Displacement 0.000377 0.001800 YES RMS Displacement 0.000166 0.001200 YES |
-2352.41629856 | -6176269.46 | File:3 gen opt log 72846.log |
| Isomer 4 | 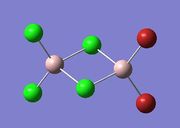 |
 |
Item Value Threshold Converged? Maximum Force 0.000017 0.000450 YES RMS Force 0.000009 0.000300 YES Maximum Displacement 0.000307 0.001800 YES RMS Displacement 0.000119 0.001200 YES |
-2352.41109945 | -6176255.81 | File:4 gen opt log 72880.log |
The isomer with the lowest energy has the bromine atoms trans and terminal therefore looking at isomer 3; Trans-BrClAl(µ-Cl2)AlClBr. Table (b) shows the energies of all four isomers determined relative to isomer 3.
| Isomer | (Actual) kJ/mol | Relative (kJ/mol) |
|---|---|---|
| 1 | -6176243.23 | 26.23 |
| 2 | -6176269.38 | 0.08 |
| 3 | -6176269.46 | 0.00 |
| 4 | -6176255.81 | 13.65 |
From table (b) it can be seen that the two isomers that have chlorine as the bridging atoms have the lowest energies. When the two bromine atoms are trans this is slightly more stable than when they are cis. The two isomers that have Bromine atoms bridging are evidently more unstable. This can be explained by the fact that Bromine is larger than Chlorine and so its orbitals are more diffuse which results in poorer orbital overlap and hence weaker bonding. This makes the isomers with bridging Bromines less stable shown by table (b).
Dissociation Energy
To determine the dissociation energy the optimisation energy of the monomer had to be first computed.
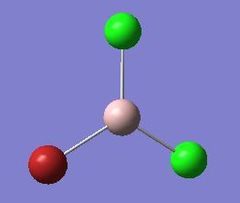
The summary table (Figure b) along with the item table are shown below.
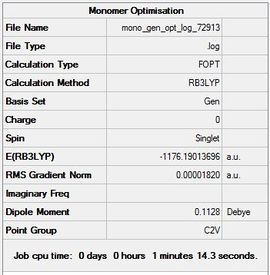
          Item               Value     Threshold  Converged?
 Maximum Force            0.000039     0.000450     YES
 RMS     Force            0.000025     0.000300     YES
 Maximum Displacement     0.000285     0.001800     YES
 RMS     Displacement     0.000166     0.001200     YES
The link for the Guassian log file and D-Space can be found here File:Mono gen opt log 72913.log and DOI:10042/23947
Using Isomer 3 from Table (a) the dissociation was found using the following formula:
= E(NH3.BH3) - [E(NH3) + E(BH3)] ∆E = 2E(AlCl2Br) - E(Al2Cl4Br2)
= 2(-1176.19013696) - (-2352.41629856)
= 0.036026 a.u.
Converting this to kJ/mol gives 94.5862702 kJ/mol = 94.59 kJ/mol
A literature value for the dissociation energy of Al2Cl4Br2 could not be found. But looking at the dissociation energy for the most similar dimer Al2Cl6; 113 kJ/mol [5] this value is rather similar. From this it can be concluded that the product is more stable than its isolated monomers.
Frequency Analysis
| Molecule | Spectra | Comment | Low Frequency Table |
|---|---|---|---|
| Isomer 1 | 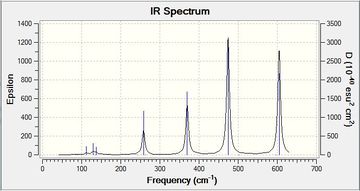 |
From the total 18 vibrations for this isomer only 8 vibrations are active that show up in the IR spectrum. From these 8 only 4 have distinct intensities. | Low frequencies --- -23.9106 -22.6771 -15.3948 -7.3106 0.0019 0.0032 Low frequencies --- 0.0034 65.8477 85.9750File:1 freq log 72951.log |
| Isomer 2 | 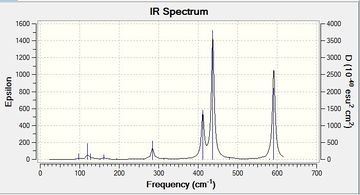 |
This is similarly symmetric to isomer 1 and has 3 distinctly active peaks which may imply that it is more symmetric. However, in total there are 10 peaks that have some sort of intensity | Low frequencies --- -25.7868 -21.0524 -19.3198 -14.4191 -0.0011 0.0035 Low frequencies --- 0.0043 47.1161 77.7813File:2 freq log 72954.log |
| Isomer 3 | 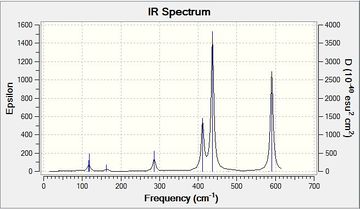 |
A symmetric molecule showing three large peaks and six smaller ones that are not really distinguishable. | Low frequencies --- -25.3151 -22.3453 -19.2122 -6.5745 -0.0015 -0.0005 Low frequencies --- 0.0023 40.1569 71.6131File:3 freq log 72955.log |
| Isomer 4 | 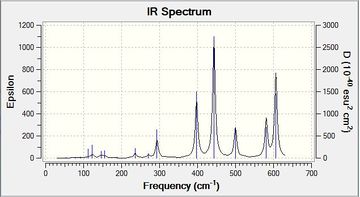 |
From the number of peaks present in this spectrum it can be seen that this is the least symmetric of the four isomers. All 18 vibrations are active showing that there is some sort of change in dipole moment with every stretch or bend. | Low frequencies --- -24.1985 -20.9538 -17.4655 -0.0013 0.0009 0.0025 Low frequencies --- 7.6735 54.3100 79.8419File:4 freq log 72957.log |
| Monomer | 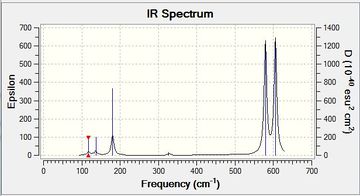 |
As the monomer is not a very symmetrical molecule all six vibrations are present in the spectrum. | Low frequencies --- -31.5387 -25.9612 -8.0279 0.0042 0.0045 0.0052 Low frequencies --- 117.5383 136.5428 180.6703File:Mono freq log 72958.log |
It can be seen from table (c) that the more symmetric isomers have fewer peaks present in their spectra. For an IR band to be active there needs to be a change in the dipole moment. With 18 vibrational modes in total and only three of them for instance being observed shows just how symmetrical the molecule is. Spectrums for Isomers 2 and 3 are almost identical with the difference of 1 peak. In Isomer 2 the two Bromine atoms are cis while in Isomer 3 they are trans.
Al-Br Bond Stretching Vibration
| Isomer 1 | Isomer 2 | Isomer 3 | Isomer 4 | Monomer | |||||
|---|---|---|---|---|---|---|---|---|---|
| Frequency | Infrared | Frequency | Infrared | Frequency | Infrared | Frequency | Infrared | Frequency | Infrared |
| 258.18 | 75.8524 | 284.32 | 38.3345 | 286.16 | 39.8774 | 293.19 | 47.0844 | 180.35 | 33.0531 |
| 369.75 | 156.0354 | 411.56 | 149.9983 | 411.42 | 150.2253 | 397.55 | 149.8244 | 579.05 | 179.9883 |
| 474.18 | 366.4689 | 436.91 | 416.9660 | 436.94 | 417.7253 | 443.24 | 304.8588 | 605.08 | 183.8922 |
| 604.71 | 328.1262 | 591.54 | 310.2036 | 590.46 | 315.9892 | 499.78 | 78.4055 | - | - |
| - | - | - | - | - | - | 580.88 | 100.3510 | - | - |
| - | - | - | - | - | - | 606.16 | 219.9539 | - | - |
In Isomer 1 the Bromines are both bridging and therefore from table (d) it can be seen that it has the lowest frequency (shown in bold) and assumed to be around 247cm-1[6]. In the other three isomers where the Bromines are terminal or for Isomer 4 where one is terminal and one is bridging it can be seen that they have much higher frequencies. The literature value for this stretch is around 489cm-1[6]. Higher stretching frequencies indicate stronger bonds. This shows that the terminal Al-Br bonds are much stronger than the bridging Al-Br bonds. The lower bridging frequency can also be explained by the fact that Bromine is heavier than Chlorine and therefore will not vibrate as fast as an Al-Cl bond due to having a higher reduced mass and therefore decreasing the frequency.
Molecular Orbitals
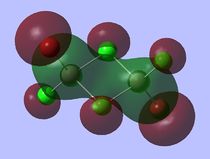
A core orbital is an orbital that is not involved in the bonding. For this molecule it is mainly the s and d orbitals. The p orbitals are mainly bonding and involved in reactivity where the orbtials interact with one another for instance where the electrons are delocalised over both bromine and chlorine atoms enabling them to interact with one another.
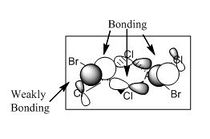
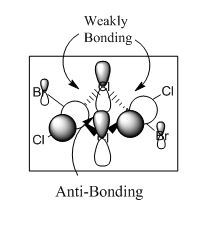
For the next part of this mini-project the occupied non-core molecular orbitals were visualised for the lowest energy isomer which was isomer 3. From the 82 molecular orbitals present five will be looked at in more detail (Table 4). The calculation was run by using the optimised isomer 3 (link given above) and going to 'Edit', 'MOs', 'New MOs' and loading the checkpoint file. The orbtial diagrams have been organised from the most bonding to the most anti-bonding.
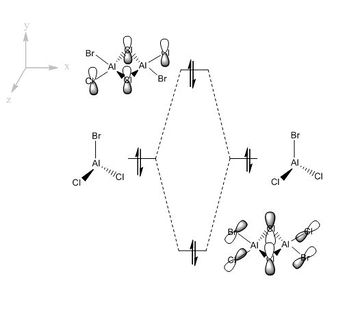
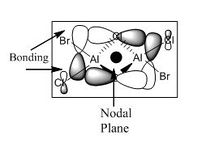
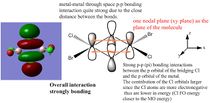
Figure (c) shows a slice of the MO diagram showing the bonding and anti-bonding orbitals for one of the atomic orbital sets.
Conclusion
At the end of this project it can be assumed that the molecules discussed have been successfully optimised and analysed. A clearer understanding of Gaussian and GaussView has been obtained and this knowledge can be applied to future studies. By optimising molecules a stable structure was created, which is the structure that is found in the gas-phase. This has then allowed further analysis such as population and frequency analysis to be carried out. By looking at the molecular orbitals it can be concluded that the quality and accuracy of qualitative molecular orbital theory is high and can be related to linear combination of atomic orbital theory.
In the second part of this lab course the GaussView was used to look at Al2Cl4Br2. It was concluded that the lowest energy dimer was more stable than its monomers and the symmetry of the four isomers was looked into in relation to the IR spectrums. The position of the Bromines and whether they were terminal or bridging had an impact on the energy levels and frequencies discussed above.
References
<references> [1] |- [2] |- [3] |- [4] |- [5] |- [6]
- ↑ 1.0 1.1 M.R. Hartman, J.J. Rush, T.J. Udovic, R.C. Bowman and S.J. Hwang; J. Solid State Chem.; 2007; 180; 1298-1305
- ↑ 2.0 2.1 J.Glasier, G. Johansson.; Acta Chemica Scandinavica; A 36 (1982); 36; 125-135
- ↑ 3.0 3.1 A. F. Holleman, E. Wiberg, N. Wiberg; Inorganic Chemistry; Academic Press; 2001; 1760
- ↑ 4.0 4.1 Y. K. Shaulov, G. O. Shmyreva, V. S. Tubyanskaya; Zhurnal Fizicheskoi Khimii; 1966; 40; 122-124
- ↑ 5.0 5.1 5.2 L. Bernasconi, P. A. Madden, M. Wilson; Phys. Chem. Comm.; 2002; 5; 1-11
- ↑ 6.0 6.1 6.2 M. Ystenese, N. Westberg, B. K. Ehrhardt; Spectrochimica Acta; 1995; 51; 1017-1029

