Rep:Mod:hl36112
Bonding and Molecular Orbitals in Main Group Chemistry
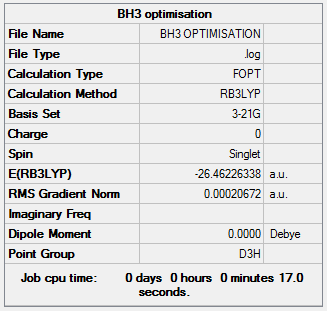
BH3Optimisation 3-21G
A molecule of BH3 was created on Gaussview and then optimised. The optimisation file is linked to here.
The following table displays the summary of the calculations performed on the molecule.
The item table shows that optimisation has converged.
        Item             Value        Threshold    Converged?
Maximum Force            0.000413     0.000450     YES
RMS     Force            0.000271     0.000300     YES
Maximum Displacement     0.001610     0.001800     YES
RMS     Displacement     0.001054     0.001200     YES
Predicted change in Energy=-1.071764D-06
Optimization completed.
-- Stationary point found.
The bond lengths and bond angles of BH3 can be calculated and are as follows:
B-H Bond length= 1.19 Å
H-B-H angle= 120.0°
Total energy= -24.46226338 a.u.
BH3Optimisation 6-31G
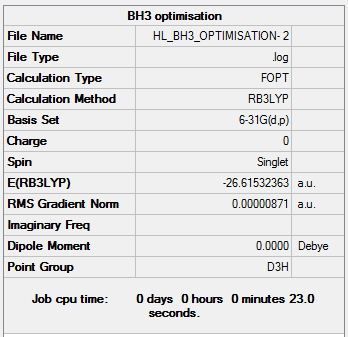
The BH3 molecule was then optimised with the 6-31G basis-set.
The optimisation file is linked to here.
The following table diplays the summary of the calculations performed on the molecule.
The item table shows that the optimisation has converged.
        Item             Value        Threshold    Converged?
Maximum Force            0.000017     0.000450     YES
RMS     Force            0.000011     0.000300     YES
Maximum Displacement     0.000068     0.001800     YES
RMS     Displacement     0.000045     0.001200     YES
Predicted change in Energy=-1.770138D-09
Optimization completed.
-- Stationary point found.
The bond lengths and bond angles have been calculated:
B-H Bond length= 1.19 Å
H-B-H Bond angle= 120.0°
Total energy= -26.61532363 a.u.
GaBr3Optimisation
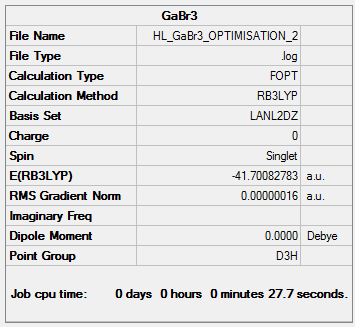
A molecule of GaBr3 was created and then optimised.
The GaBr3 optimisation in the chemical database "D-space" is linked here https://spectradspace.lib.imperial.ac.uk:8443/dspace/handle/10042/25195
The following table shows the summary of the calculations performed on the molecule.
The item table shows that the optimisation has converged.
        Item             Value        Threshold    Converged?
 Maximum Force            0.000000     0.000450     YES
 RMS     Force            0.000000     0.000300     YES
 Maximum Displacement     0.000003     0.001800     YES
 RMS     Displacement     0.000002     0.001200     YES
 Predicted change in Energy=-1.282687D-12
 Optimization completed.
    -- Stationary point found.
The bond length and angles are displayed below:
Ga-Br Bond length= 2.35 Å
Br-Ga-Br Bond angle= 120.0°
Ga-Br Bond length (literature value)= 2.24 Å [1]
The literature bond length is relatively close to the calculated value, implying that the optimisation has been successful.
BBr3Optimisation
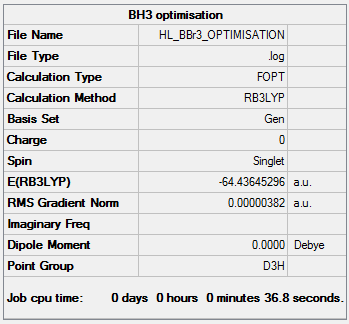
An optimisation was performed on a molecule of BBr3. The optimisation file is linked to https://spectradspace.lib.imperial.ac.uk:8443/dspace/handle/10042/25220
The table below shows the summary of the optimisation.
The item shows that the optimisation has converged.
        Item         Value    Threshold Converged?
Maximum Force        0.000008 0.000450  YES
RMS     Force        0.000005 0.000300  YES
Maximum Displacement 0.000036 0.001800  YES
RMS     Displacement 0.000023 0.001200  YES
Predicted change in Energy=-4.026995D-10
Optimization completed.
-- Stationary point found.
The bond lengths and angles have been calculated:
B-Br Bond length= 1.93 Å
Br-B-Br Bond angle= 120.0°
Results Analysis
| Molecule | Bond length/Å |
|---|---|
| BH3 3-21G | 1.19 |
| BH3 6-31G | 1.19 |
| BBr3 | 1.93 |
| GaBr3 | 2.35 |
By comparing the bond lengths of B-H and B-Br, it can be seen that changing the ligand alters the bond length. The bond length is greater for B-Br than B-H. This is due to a number of factors. As bromine is larger than hydrogen, its orbitals are more diffuse, therefore the overlap of orbitals is less and hence the bond is weaker and longer. Also, bromine is more electronegative than hydrogen. Therefore, increasing the bond polarity and hence it would be expected to be a strong bond. However, the reduced orbital overlap overrides this.
Looking at the bond lengths of B-Br and Ga-Br, it is known that different central atoms cause different bond lengths. The bond length for Ga-Br is greater than that of B-Br. Both bromine and gallium are in group 13 so they both have the same number of valence electrons. However, Ga is further down the periodic table and this results in the orbitals of gallium being more diffuse. Therefore there is poorer overlap between it and Br. Meaning that the bond is weaker. As bond length is inversely proportional to bond strength, the Ga-Br bond is longer than the B-Br bond.
A bond is an attraction between atoms to form a stable molecule. There are different types of chemical bond such as covalent, iconic and metallic. A bond can also be looked at through valence bond theory. This looks at the interaction of atomic orbitals. Sometimes gaussview does not display a line for a bond because it is not a physical entity. And hence there is still an interaction between the atoms even if a physical line is not shown.
BH3Frequency Analysis
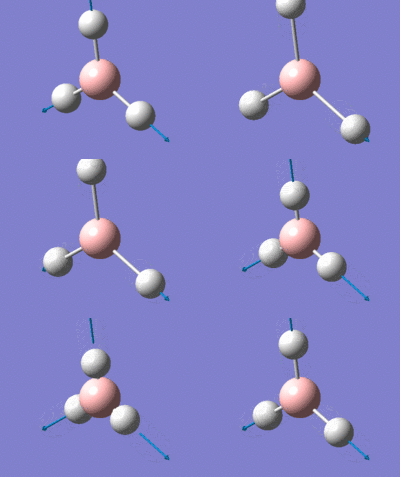
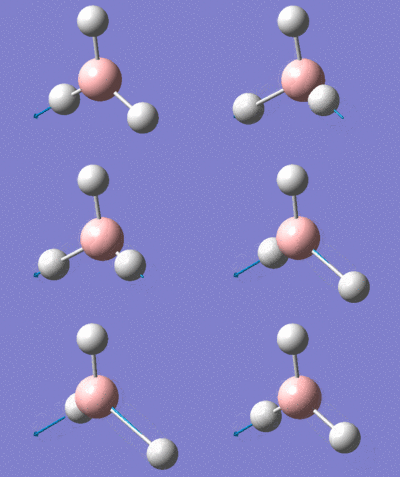
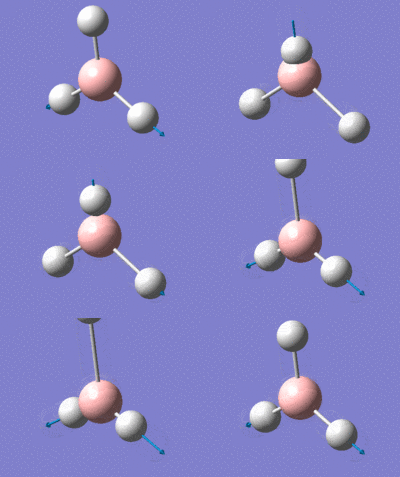
A frequency analysis was performed on the optimised BH3 molecule.
The frequency analysis is linked to here
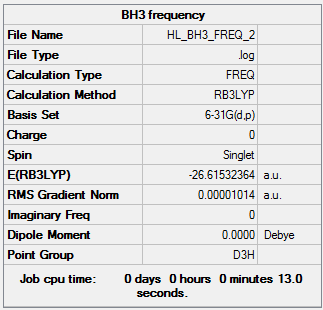
The table below shows the summary of the calculations performed:
The low frequencies are shown below:
Low frequencies --- -0.4110 -0.0120 0.0008 12.1945 12.2014 15.5644

Low frequencies --- 1163.0658 1213.2003 1213.2005
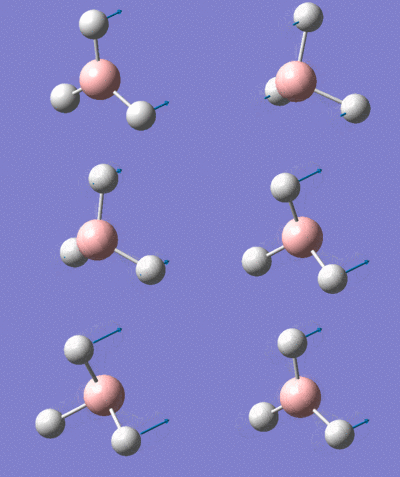
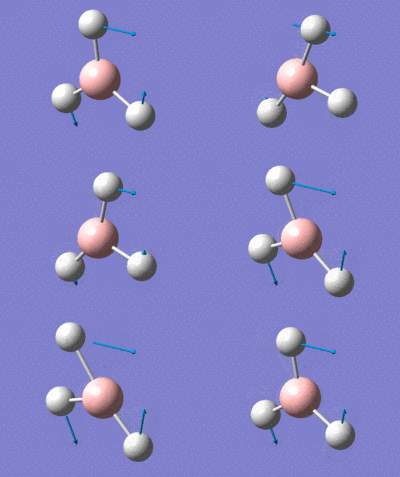
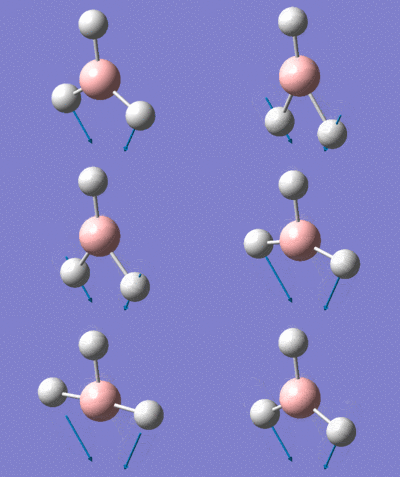
The following table displays a summary of the molecular vibrations of BH3.
BH3 IR spectrum:
In the IR spectrum there are only 3 peaks shown, however there are 6 vibrations. Looking at the frequency column of the table it can be seen that there are 2 sets of degenerate frequencies at 1213.20 cm-1 and 2751.37 cm-1. Therefore, there will only be one peak seen on the spectrum at these points. The third peak shown on the spectrum will be at 1163.07 cm-1. There will be no peak present at 2582.26 cm-1 due to the intensity being 0. This vibration does not result in a change in dipole motion and hence is IR inactive.
GaBr3Frequency Analysis
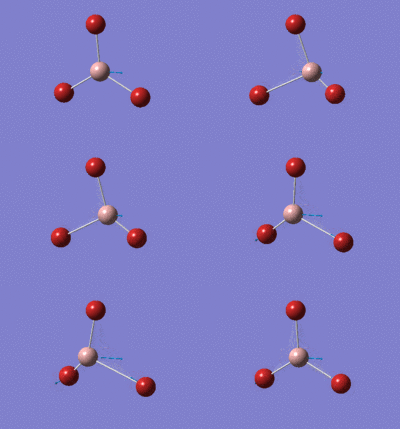
A frequency analysis was also performed on the GaBr3 optimised molecule.
The frequency is linked to https://spectradspace.lib.imperial.ac.uk:8443/dspace/handle/10042/25327
The low frequencies are displayed below:
Low frequencies --- -0.5252 -0.5247 -0.0024 -0.0010 0.0235 1.2010

Low frequencies --- 76.3744 76.3753 99.6982
The following table displays a summary of the molecular vibrations of the GaBr3 molecule:
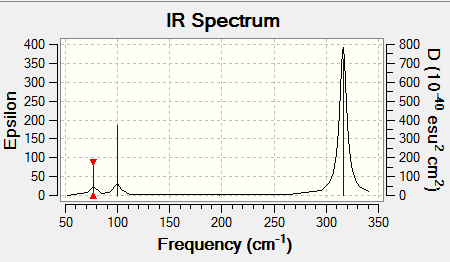
The GaBr3 IR spectrum:
Vibrational Frequency Analysis
| Mode | BH3 | GaBr3 |
|---|---|---|
| 1 | 1163 | 76 |
| 2 | 1213 | 76 |
| 3 | 1213 | 100 |
| 4 | 2582 | 197 |
| 5 | 2715 | 316 |
| 6 | 2715 | 316 |
From the table of frequencies, it can be seen that the frequencies for GaBr3 are a lot lower than those for BH3. As frequency is inversely proportional to reduced mass, the molecule with a higher mass will have a lower frequency and hence GaBr3 has lower frequencies than BH3. Frequency is also proportional to the force constant of a bond. This means that a stronger bond will have a higher frequency. The Ga-Br bonds are weaker and longer than the B-H bonds. This is because gallium and bromine are larger atoms than boron and hydrogen, hence their orbitals are more diffuse meaning a reduced overlap. Therefore a weaker bond means a lower frequency.
The IR spectra are very similar in shape but at different frequencies. Both spectra have 3 peaks even though there are 6 vibrational modes. Two peaks display the two sets of degenerate frequencies. The other peaks represent the 1163 cm-1 and 100 cm-1 frequencies on the two separate spectra. The frequencies with 0 intensity are not displayed on the spectra.
For BH3 the symmetry of vibrational modes in numerical order from 1-6 is: A2" E' E' A1' E' E'. For GaBr3 the order is: E' E' A2" A1' E' E'. The mode of A2" symmetry has moved to a higher frequency for the GaBr3 molecule. This is because this vibration requires more energy than the two degenerate E' modes (1 and 2) for this molecule. In the A2" mode for GaBr3 the gallium atom is moving in and out of plane. In the A2" mode for the BH3 the H atoms are moving in and out of the plane. Therefore more energy is required to move the heavier Ga atom.
The same method and basis set must always be used for the optimisation and frequency analysis questions. If not then the results would not be valid and would not mean anything. The same method and basis-set also has to be used when comparing two different molecules. A frequency analysis is useful as it allows us to find the minimum structure for a specific basis set. The "low frequencies" represent the vibrations of the centre of mass of the molecule.
Molecular Orbitals of BH3
A population analysis was performed on the BH3 molecule.
The BH3 energy calculation is linked to https://spectradspace.lib.imperial.ac.uk:8443/dspace/handle/10042/25336
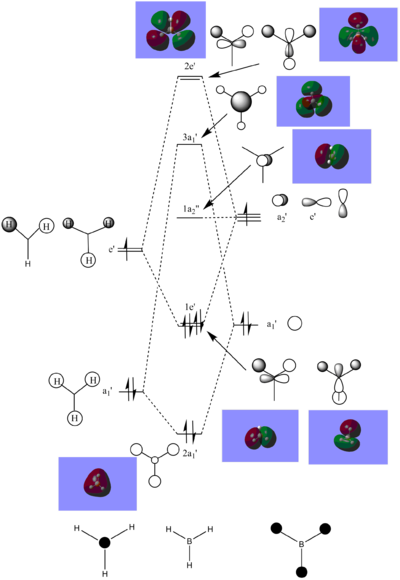
The following diagram diplays the BH3 MO diagram with images of the MOs.
The real MOs correspond to the LCAOs and therefore can be easily determined. Therefore, suggesting that qualitative MO theory is useful and reasonably accurate to portray the shapes of a molecules MOs. Because BH3 is a basic molecule, the MOs maybe easier to determine and hence for more complicated molecules, the MOs will also become more complicated.
NH3
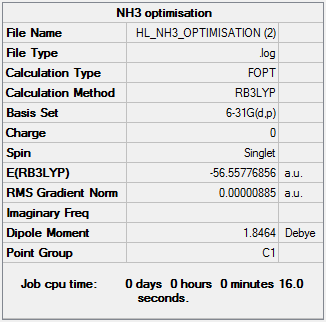
A molecule of ammonia was created and optimised. A frequency analysis was then performed followed by a population analysis.
The optimisation is linked to here.
         Item             Value        Threshold  Converged?
 Maximum Force            0.000024     0.000450     YES
 RMS     Force            0.000012     0.000300     YES
 Maximum Displacement     0.000079     0.001800     YES
 RMS     Displacement     0.000053     0.001200     YES
 Predicted change in Energy=-1.629718D-09
 Optimization completed.
    -- Stationary point found.
The frequency analysis is linked to here.
Low frequencies --- -30.6847 -0.0012 0.0008 0.0018 20.2705 28.3113

Low frequencies --- 1089.5554 1694.1245 1694.1864
The energy calculation is linked to https://spectradspace.lib.imperial.ac.uk:8443/dspace/handle/10042/25344
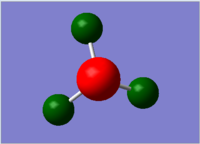
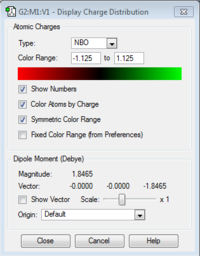
A natural bond order analysis was finally performed. The following images display the charge distribution and atomic charges respectively.
The atomic charge for N= -1.125 and for H= +0.375
NH3BH3
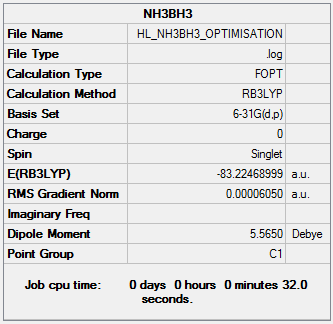
A molecule of NH3BH3 was created and then optimised.
The optimisation is linked to here.
Item               Value     Threshold  Converged?
 Maximum Force            0.000128     0.000450     YES
 RMS     Force            0.000057     0.000300     YES
 Maximum Displacement     0.000631     0.001800     YES
 RMS     Displacement     0.000304     0.001200     YES
 Predicted change in Energy=-1.626456D-07
 Optimization completed.
    -- Stationary point found.
A frequency analysis was then performed.
The frequency is linked to here
Low frequencies ---   -0.0014   -0.0014   -0.0011   18.1969   22.7466   41.1907

Low frequencies ---  266.2630  632.3248  639.2321
Association Energies
E(NH3)= -56.55776856 a.u.
E(BH3)= -26.61532363 a.u.
E(NH3BH3)= -83.22468999 a.u.
ΔE=E(NH3BH3)-[E(NH3)+E(BH3)]
ΔE= -0.0515978 a.u.
ΔE= -135.78 kJ/mol
Mini Project: Lewis Acids and Bases
The Lewis acids and bases mini project looks at the isomers of the Al2Cl4Br2 dimer made from AlCl2Br monomers. The dimer forms as it is more stable than than the monomer structure. Energy calculations have been performed to reinstate this fact. In the dimer, bromine and chlorine atoms form bridges joining the two aluminium atoms. The bridging bonds are dative covalent bonds where the bromine or chlorine atoms donate a pair of electrons to the aluminium to form a bond. The following project looks at the stability of isomers,the vibrational frequencies and the molecular orbitals of the dimer.
Optimisation
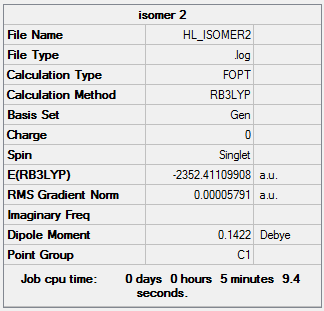
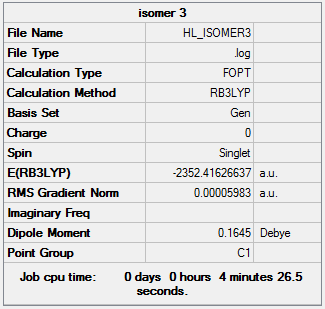
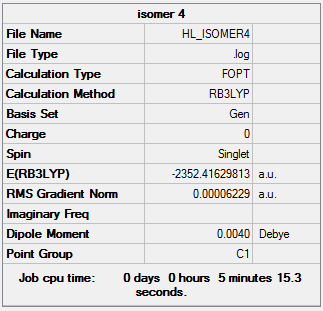
The following Al2Cl4Br2 isomers were optimised to find the energy.
| Isomer | Relative Energy/kJ/mol |
|---|---|
 Isomer 1 Isomer 1 |
26.29 |
 Isomer 2 Isomer 2 |
13.68 |
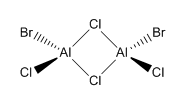 Isomer 3 Isomer 3 |
0.08 |
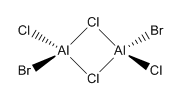 Isomer 4 Isomer 4 |
0.00 |
The relative energies of each isomer were calculated and it was discovered that the most stable isomer is that with the two bromine atoms in a terminal position, trans to each other. It can also be seen from the relative energies that the isomer which is least stable is the one where Br takes the place of the bridging ligands. Bromine is larger than chlorine and hence its orbitals are more diffuse. This means a reduced overlap in orbitals and a weaker interaction. Therefore when bromine is in the bridging position, the bridging bonds will be weaker and longer making the isomer less stable. The larger size of bromine also indicates that the isomer that will be most stable will be that which separates the bromine atoms as much as possible. Hence in the trans position the bromine atoms are as far away as possible preventing steric repulsions. The stability increases with the removal of bromine from the bridging positions.
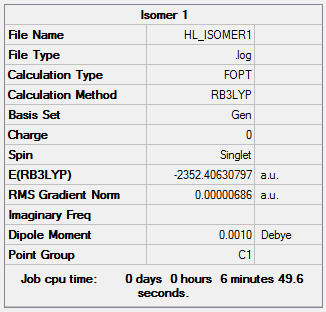
The optimisation of isomer 1 can be found here https://spectradspace.lib.imperial.ac.uk:8443/dspace/handle/10042/25585
Item Value Threshold Converged?
Maximum Force 0.000014 0.000450 YES
RMS Force 0.000006 0.000300 YES
Maximum Displacement 0.000324 0.001800 YES
RMS Displacement 0.000136 0.001200 YES
Predicted change in Energy=-6.037184D-09
Optimization completed.
-- Stationary point found.
The following table displays the bond lengths and angles for isomer 1:
| Bond length/Bond Angle | Value |
|---|---|
| terminal Cl-Al length | 2.09 Å |
| bridging Br-Al length | 2.49 Å |
| ClAlCl angle | 121.8° |
| ClAlBr angle | 109.8° |
| BrAlBr angle | 91.739° |
The optimisation of isomer 2 can be found here https://spectradspace.lib.imperial.ac.uk:8443/dspace/handle/10042/25591
 Item Value Threshold Converged?
Maximum Force 0.000187 0.000450 YES
RMS Force 0.000045 0.000300 YES
Maximum Displacement 0.001540 0.001800 YES
RMS Displacement 0.000650 0.001200 YES
Predicted change in Energy=-2.717186D-07
Optimization completed.
-- Stationary point found.
The following table shows the bond lengths and angles for isomer 2:
| Bond length/Bond angle | Value |
|---|---|
| terminal Cl-Al length | 2.09 Å |
| terminal Br-Al length | 2.28 Å |
| bridging Cl-Al length | 2.30 Å |
| bridging Br-Al length | 2.49 Å |
| ClAlBr angle | 121.5° |
| BrAlBr angle | 110.8° |
| ClAlbridgingCl angle | 109.5° |
| bridgingBrAlCl angle | 110.2° |
| bridgingBrAlbridgingCl angle | 90.9° |
| AlClAl angle | 93.3° |
| AlBrAl angle | 84.8° |
The optimisation of isomer 3 can be found here https://spectradspace.lib.imperial.ac.uk:8443/dspace/handle/10042/25597
Item Value Threshold Converged?
Maximum Force 0.000181 0.000450 YES
RMS Force 0.000038 0.000300 YES
Maximum Displacement 0.000869 0.001800 YES
RMS Displacement 0.000370 0.001200 YES
Predicted change in Energy=-1.948359D-07
Optimization completed.
-- Stationary point found.
The following table displays the bond lengths and angles for isomer 3:
| Bond length/bond angle | Value |
|---|---|
| terminal Cl-Al length | 2.09 Å |
| terminal Br-Al length | 2.27 Å |
| bridging Cl-Al length | 2.30 Å |
| ClAlBr angle | 121.5° |
| ClAlCl angle | 109.8° |
| BrAlCl angle | 110.6° |
| AlClAl angle | 89.8° |
The optimisation of isomer 4 can be found here https://spectradspace.lib.imperial.ac.uk:8443/dspace/handle/10042/25596
Item Value Threshold Converged?
Maximum Force 0.000187 0.000450 YES
RMS Force 0.000039 0.000300 YES
Maximum Displacement 0.000968 0.001800 YES
RMS Displacement 0.000385 0.001200 YES
Predicted change in Energy=-2.220828D-07
Optimization completed.
-- Stationary point found.
The following table displays the bond lengths and angles of isomer 4:
| Bond length/Bond angle | Value |
|---|---|
| terminal Br-Al | 2.27 Å |
| terminal Cl-Al | 2.09 Å |
| bridging Cl-Al | 2.30 Å |
| BrAlCl | 121.5° |
| BrAlCl | 110.5° |
| ClAlCl | 109.9° |
Dissociation Energy
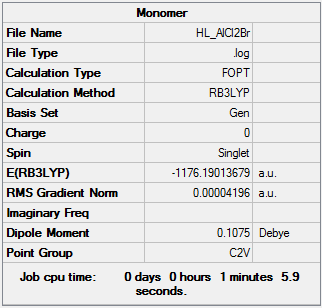
The dissociation energy of the above reaction has been calculated.
The optimisation of AlCl2Br can be found here https://spectradspace.lib.imperial.ac.uk:8443/dspace/handle/10042/25710
 Item Value Threshold Converged?
Maximum Force 0.000136 0.000450 YES
RMS Force 0.000073 0.000300 YES
Maximum Displacement 0.000681 0.001800 YES
RMS Displacement 0.000497 0.001200 YES
Predicted change in Energy=-7.984392D-08
Optimization completed.
-- Stationary point found.
E(Al2Cl4Br2)=-2352.41629813 a.u.
E(AlCl2Br)= -1176.19013679 a.u.
ΔE=[2E(AlCl2Br)]-E(Al2Cl4Br2)
ΔE= 0.3602455 a.u.
ΔE= 94.80kJ/mol
As the dissociation energy is a positive value it demonstrates that the Al2Cl4Br2 dimer is more stable that the AlCl2Br monomer. Therefore reinstating the fact that the dimer conformation is preferred over the monomer. The monomers are electron deficient and hence forming a dimer releases energy resulting in a more stable dimer structure.
Frequency Analysis
The frequency analysis for isomer 1 can be found here https://spectradspace.lib.imperial.ac.uk:8443/dspace/handle/10042/25610
Low frequencies --- -5.2071 -5.0200 -3.2443 -0.0043 -0.0041 -0.0032
Low frequencies --- 14.8193 63.2847 86.0895
The frequency analysis for isomer 2 can be found here https://spectradspace.lib.imperial.ac.uk:8443/dspace/handle/10042/25614
Low frequencies --- -0.0005 0.0006 0.0010 0.5447 1.8762 4.0784
Low frequencies --- 17.4185 55.9430 80.0624
The frequency analysis for isomer 3 can be found here https://spectradspace.lib.imperial.ac.uk:8443/dspace/handle/10042/25615
Low frequencies --- -3.5998 -1.5088 -0.0026 -0.0017 0.0013 2.0438
Low frequencies --- 17.2806 50.9379 78.5608
The frequency analysis for isomer 4 can be found here https://spectradspace.lib.imperial.ac.uk:8443/dspace/handle/10042/25616
Low frequencies --- -4.4021 -0.0029 -0.0014 0.0008 2.0463 2.5622
Low frequencies --- 18.2571 49.1166 73.0080
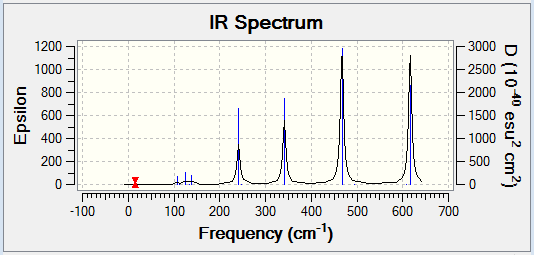
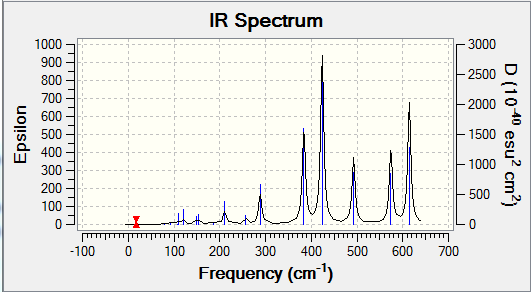
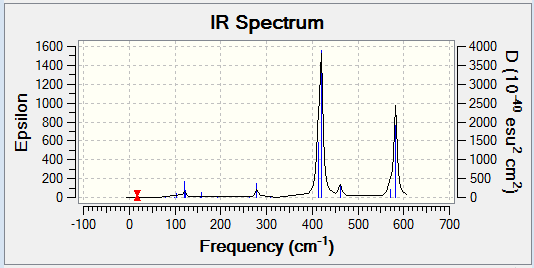
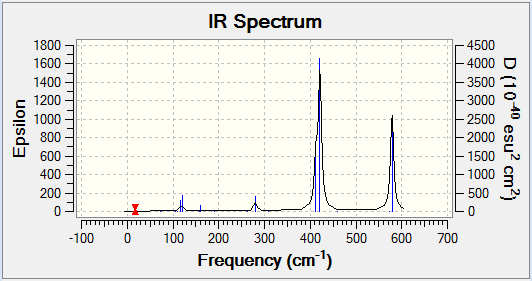
Computational chemistry allows for the vibrational frequencies that are not IR active to be calculated. In order for an IR band to be active, a change in dipole moment must occur when the vibration takes place. Therefore a more symmetrical isomer will show less peaks on an IR spectrum. This is because there will be fewer vibrational modes that cause a change in dipole moment and so are IR inactive. More symmetrical molecules will also result in more degenerate frequencies, as the different vibrational modes will still result in the same change in dipole moment and hence less peaks are shown. Isomer 2 is the least symmetrical molecule and it can be seen on its IR spectrum that there are more peaks. Therefore, there are more IR active vibrational modes.
The following table displays the stretching frequencies for the Al-Br bonds. In isomer 1 the bromine atoms are bridging where as in isomers 3 and 4 the bromine atoms are terminal. It can be seen from the data that when bromine is bridging the stretching frequencies are lower than those for the terminal bromine. As bromine is larger than chlorine, its orbitals are more diffuse and hence orbital overlap is reduced. This means that Al-Br bonds are longer than Al-Cl bonds. In the bridging position the Al-Br bonds are even longer as the interaction is weaker. Weaker bonds result in a lower stretching frequency as less energy is required for the vibration.
| Isomer 1 | Isomer 2 | Isomer 3 | Isomer 4 | ||||
|---|---|---|---|---|---|---|---|
| Mode | Frequency /cm-1 |
Mode | Frequency /cm-1 |
Mode | Frequency /cm-1 |
Mode | Frequency /cm-1 |
| 11 | 197 | 10 | 186 | 15 | 420 | 15 | 421 |
| 12 | 241 | 11 | 211 | 16 | 461 | 16 | 459 |
| 13 | 248 | 14 | 384 | 17 | 570 | 17 | 574 |
| 14 | 341 | 15 | 424 | 18 | 582 | 18 | 579 |
| 16 | 493 | ||||||
| 17 | 574 | ||||||
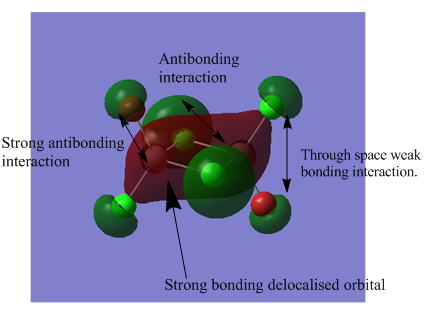
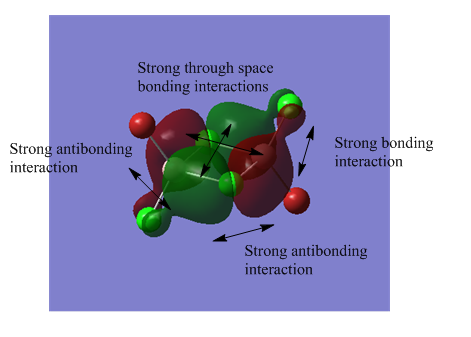
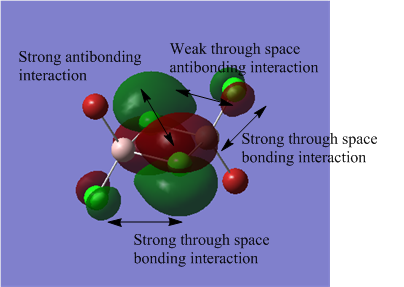
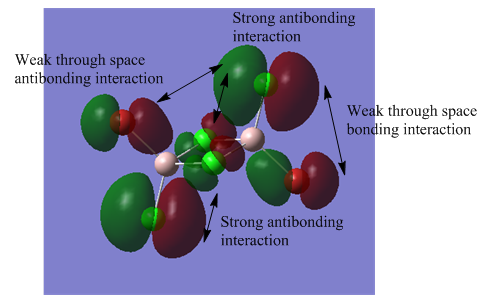
Molecular Orbital Analysis
The MO analysis file can be found here https://spectradspace.lib.imperial.ac.uk:8443/dspace/handle/10042/25655
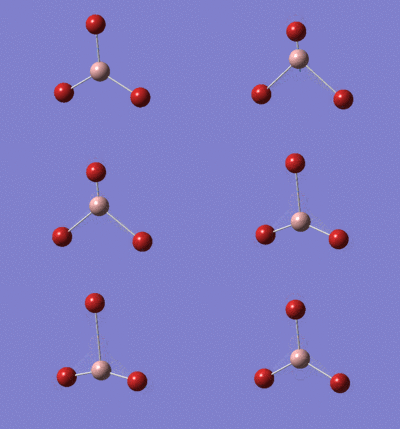
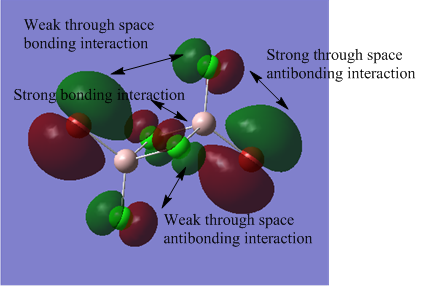
The above images of occupied non-core MOs range from highly bonding to highly antibonding from left to right down the page. The MOs become less delocalised in this order as well.
| MO | Nodes |
|---|---|
| 38 | 6 |
| 39 | 6 |
| 44 | 4 |
| 49 | 6 |
| 54 | 6 |
The nodes are at the centre of the atoms' atomic p orbitals where there is no electron density.
Conclusion
From analysing the 4 isomers of the Al2Cl4Br2 molecule, it has been determined that the isomer that is most stable is the one in which the Br atoms are terminal and trans to each other. The least stable isomer has the Br atoms in the bridging positions. It has also been proven that a dimer structure is favourable over the monomer of AlCl2Br, due to energy given out when the dimer is formed. From the frequency analysis, it can be seen that the Al-Br bonds have lower frequencies when the bromine atoms are bridging. Due to a weaker interaction, meaning a weaker bond. Finally, an MO analysis shows how the MOs vary between highly bonding and highly antibonding.

