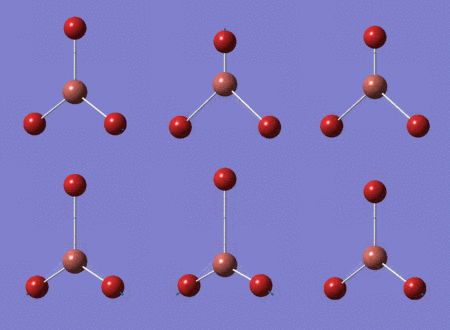
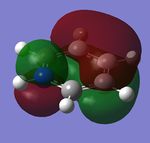
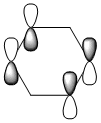
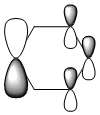
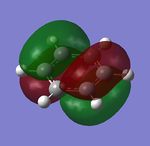
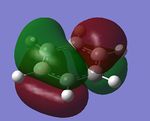
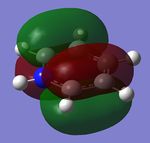
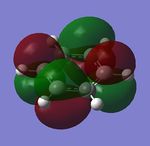
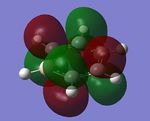
Rep:Mod:hl1910
Introduction
Computational chemistry started in around 1960s when theoretical calculations using computer became plausible and quantum theories were well established.[1] It has since been widely used in the chemistry industry as comparisons[2] or alternatives to experimental chemistry. With computational chemistry, energies, conformations, simulation of large molecules, computation of MO pictures, acquisition of the thermodynamic and kinetic data of active, hazardous compounds etc... can be done which are not achievable using experimental methods.
In this computational lab course, Gaussview 5.0 was used to create and analyse small molecules such as borane. Analysis such as optimisation, frequency, NBO were done using the density functional theory (DFT) method in Gaussview. DFT is the main technique used[3] nowadays in computational chemistry. Various basis sets, especially 6-31G (d,p), were used throughout the course as it compromises both accuracy and time consumption.
Basic calculations & Analysis
The main objective of this section of the lab course is to allow us to familiarise using Gaussview by carrying out analysis of small molecules: BH3, TlBr3, BBr3, NH3 and NH3BH3.
BH3
Optimisation
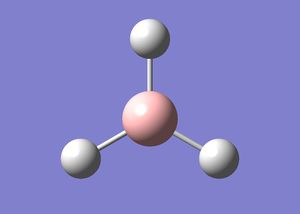
Optimising a molecule in Gaussview involves two main step: Firstly, solving the Schrodinger equation for the electron density and the energy; Secondly, solving the position of nuclei by constantly changing it's position to find the lowest energy geometry.
BH3 was created in Gaussview and the three B-H bonds were set to 1.5Å.
The molecule is then optimised using a combination of Density functional theory (DFT) and Becke, three-parameter, Lee-Yang-Parr (B3LYP) as the method. This combination is widely used although some there are some arguments about its accuracy in some cases. [4][5]
The basis set: 3-21G
Although less accurate but this basis set allows calculations to be made very quickly. In addition, borane is a small and symmetrical therefore reasonable results can be obtained using this approach.
The optimised BH3 .log file can be accessed here
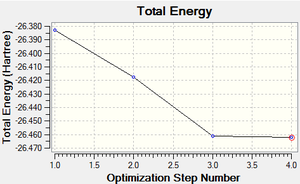
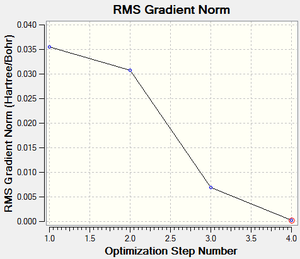
Fig 2, from step 3 to step 4, the total energy plot shows that the energy of BH3 molecule tending towards a constant value, i.e. approaching the lowest energy structure. The lowering in total energy shows that the computer was trying to find the equilibrium position between the nuclei and electrons by solving the Schrodinger equation. Fig 3 shows the root mean square gradient for each step; as number of steps increases, the gradient tends towards 0. 0 gradient signifies that a stable structure of the molecule is found. Fig 3 indicates that the stable structure is yet to be computed. A more accurate approach will be discussed later during the course.
Table 1 shows the calculation summary of the optimisation of BH3
| Table 1: BH3 optimisation summary | ||||
|---|---|---|---|---|
| ||||
| File type | .log | |||
| Calculation type | FOPT | |||
| Calculation method | RB3YLP | |||
| Basis set | 3-21G | |||
| Final energy | -26.46226338 a.u. | |||
| RMS gradient | 0.00020672 a.u. | |||
| Dipole moment | 0.00 Debye | |||
| Point group | D3h | |||
| Job cpu time | 24.0 sec | |||
| B-H bond length | 1.19 Å | |||
| H-B-H bond angle | 120.0o | |||
The item table was extracted from the raw .log file generated from Gaussview. It shows that the placement of the optimisation was converged, stationary point was found and the optimisation was successful.
        Item               Value     Threshold  Converged?
Maximum Force            0.000413     0.000450     YES
RMS     Force            0.000271     0.000300     YES
Maximum Displacement     0.001610     0.001800     YES
RMS     Displacement     0.001054     0.001200     YES
Predicted change in Energy=-1.071764D-06
Optimization completed.
   -- Stationary point found.
                          ----------------------------
                          !   Optimized Parameters   !
                          ! (Angstroms and Degrees)  !
--------------------------                            --------------------------
! Name  Definition              Value          Derivative Info.                !
--------------------------------------------------------------------------------
! R1    R(1,2)                  1.1935         -DE/DX =    0.0004              !
! R2    R(1,3)                  1.1935         -DE/DX =    0.0004              !
! R3    R(1,4)                  1.1935         -DE/DX =    0.0004              !
! A1    A(2,1,3)              120.0            -DE/DX =    0.0                 !
! A2    A(2,1,4)              120.0            -DE/DX =    0.0                 !
! A3    A(3,1,4)              120.0            -DE/DX =    0.0                 !
! D1    D(2,1,4,3)            180.0            -DE/DX =    0.0                 !
--------------------------------------------------------------------------------
GradGradGradGradGradGradGradGradGradGradGradGradGradGradGradGradGradGrad
Optimisation using a better basis set
Optimisation using the basis set 3-21G is good in giving us a rough structure but for more accurate measurements, we need to use a higher level basis set such as 6-31G(d,p)
Optimisation using 6-31G(d,p)
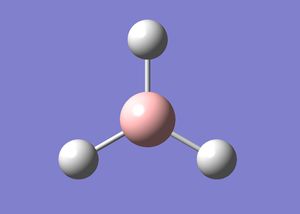
DFT, B3LYP, 6-31G(d,p) was used in addition to the 3-21G optimised BH3
The further optimised BH3 .log file can be accessed here
Table 2 shows the calculation summary of the optimisation of BH3 using 6-31G(d,p) basis set, although the energy seemed to be lower than using 3-21G basis set but we can never compare the results obtained using a different basis sets. Comparison of the energy can only be made when the identical basis set is used for every single atoms in the molecule.
| Table 2: BH3 optimisation summary | ||||
|---|---|---|---|---|
| ||||
| File type | .log | |||
| Calculation type | FOPT | |||
| Calculation method | RB3YLP | |||
| Basis set | 6-31G(d,p) | |||
| Final energy | -26.61532363 a.u. | |||
| RMS gradient | 0.00000235 a.u. | |||
| Dipole moment | 0.00 Debye | |||
| Point group | D3h | |||
| Job cpu time | 4.0 sec | |||
| B-H bond length | 1.19 Å | |||
| H-B-H bond angle | 120.0o | |||
The item table extracted from Gaussview showed that the placement of the optimisation was converged, stationary point was found and the optimisation was successful.
        Item               Value     Threshold  Converged?
Maximum Force            0.000005     0.000450     YES
RMS     Force            0.000003     0.000300     YES
Maximum Displacement     0.000019     0.001800     YES
RMS     Displacement     0.000012     0.001200     YES
Predicted change in Energy=-1.304899D-10
Optimization completed.
   -- Stationary point found.
                          ----------------------------
                          !   Optimized Parameters   !
                          ! (Angstroms and Degrees)  !
--------------------------                            --------------------------
! Name  Definition              Value          Derivative Info.                !
--------------------------------------------------------------------------------
! R1    R(1,2)                  1.1923         -DE/DX =    0.0                 !
! R2    R(1,3)                  1.1923         -DE/DX =    0.0                 !
! R3    R(1,4)                  1.1923         -DE/DX =    0.0                 !
! A1    A(2,1,3)              120.0            -DE/DX =    0.0                 !
! A2    A(2,1,4)              120.0            -DE/DX =    0.0                 !
! A3    A(3,1,4)              120.0            -DE/DX =    0.0                 !
! D1    D(2,1,4,3)            180.0            -DE/DX =    0.0                 !
--------------------------------------------------------------------------------
GradGradGradGradGradGradGradGradGradGradGradGradGradGradGradGradGradGrad
Frequency analysis
The optimised BH3 using basis set 6-31G(d,p) was used for frequency analysis.
The .log file for this analysis of BH3 can be accessed here
| Table 3: BH3 frequency summary | |
|---|---|
| File type | .log |
| Calculation type | FREQ |
| Calculation method | RB3YLP |
| Basis set | 6-31G(d,p) |
| Final energy | -26.61532363 a.u. |
| RMS gradient | 0.00000237 a.u. |
| Dipole moment | 0.00 Debye |
| Point group | D3h |
| Job cpu time | 4.0 sec |
| B-H bond length | 1.19 Å |
| H-B-H bond angle | 120.0o |
The item table extracted from Gaussview showed that the placement of the frequency analysis was converged, stationary point was found and the frequency analysis was successful.
        Item               Value     Threshold  Converged?
Maximum Force            0.000005     0.000450     YES
RMS     Force            0.000002     0.000300     YES
Maximum Displacement     0.000019     0.001800     YES
RMS     Displacement     0.000009     0.001200     YES
Predicted change in Energy=-1.323374D-10
Optimization completed.
   -- Stationary point found.
GradGradGradGradGradGradGradGradGradGradGradGradGradGradGradGradGradGrad
The low frequencies are extracted from Gaussview. The "zero" frequencies are within +/- 15cm-1 indicates the frequency analysis was done with reasonable accuracy. The "real" frequencies are positive. Therefore the frequency analysis was successful.
Low frequencies ---   -0.9033   -0.7343   -0.0054    6.7375   12.2491   12.2824
Low frequencies --- 1163.0003 1213.1853 1213.1880
Vibrataional analysis
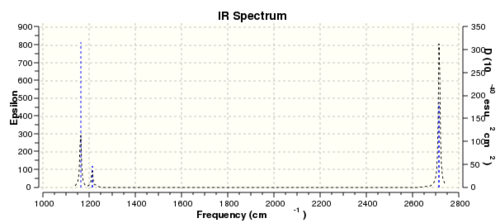
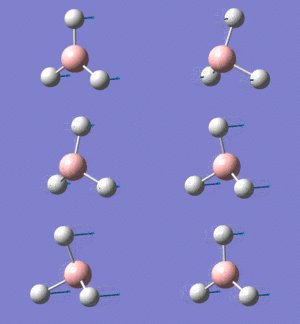
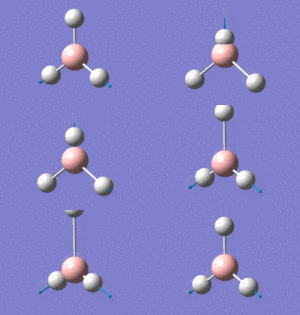
Fig 5 shows the infrared spectrum of BH3 generated by Gaussview. Only 3 peaks are observed instead of 6 (number of vibrational modes) because 2 (out of 6) peaks are overlapped due to similar frequencies (1213 cm-1, 2715 cm-1). The peak at 2582cm-1 corresponds to totally symmetric stretch of borane . Since the dipole moment for the totally symmetric stretch is unchanged, it's unsurprising that it has zero intensity, signifying that it's not observed in the spectrum.
Population analysis
The .chk file of the optimised BH3 with basis set 6-31G(d,p) was used for population analysis.
The .log and .chk file for this analysis was published in D-space and can be accessed here additional keyword: pop=full; NBO type: full
| Table 5: BH3 population analysis summary | |
|---|---|
| File type | .log |
| Calculation type | SP |
| Calculation method | RB3YLP |
| Basis set | 6-31G(d,p) |
| Final energy | -26.61532363 a.u. |
| Dipole moment | 0.00 Debye |
| Point group | D3h |
| Job cpu time | 10.6 sec |
| B-H bond length | 1.19 Å |
| H-B-H bond angle | 120.0o |
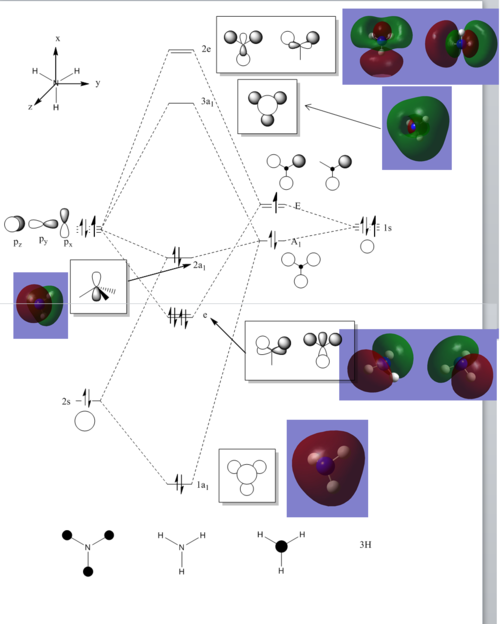
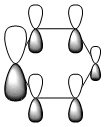
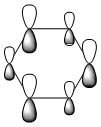
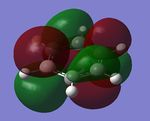
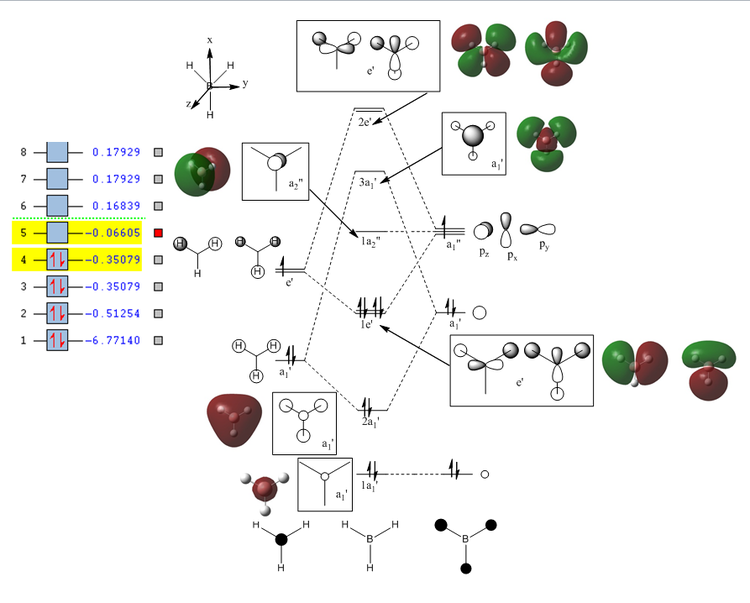
The MO diagram and the LCAOs were drawn using Chemdraw Pro 12.0. Fig 6 shows the comparison between LCAOs and computed MOs from Gaussview. We can see that the LCAOs assembles closely to the "real" MOs in terms of the positions and polarity of the electron density. With the spaces between the LCAOs filled up, they could give us an pretty good approximation of the "real" shape of the electron density. Therefore LCAO method is an accurate and useful qualitative method for approximating the real MOs.
TlBr3
Optimisation
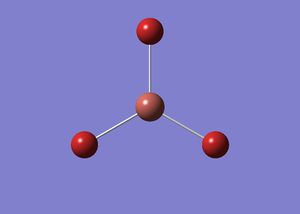
Unlike previous optimisations, a very tight symmetry (0.0001) of point group D3h was applied to the TlBr3 optimisation. In addition, instead of using 6-31G(d,p), the pseudo potential, LanL2DZ, was set as the basis set.
The optimisation was carried out using high performance computer (HPC) and the optimised TlBr3 .log file was published in D-space here
The computed Tl-Br bond length was longer than the literature value of 2.52Å [6]
| Table 6: TlBr3 optimisation summary | |||
|---|---|---|---|
|
| |||
| File type | .log | ||
| Calculation type | FOPT | ||
| Calculation method | RB3YLP | ||
| Basis set | LanL2DZ | ||
| Final energy | -91.21812851 a.u. | ||
| RMS gradient | 0.00000090 a.u. | ||
| Dipole moment | 0.00 Debye | ||
| Point group | D3h | ||
| Job cpu time | 19.2 sec | ||
| Tl-Br bond length | 2.65 Å | ||
| Br-Tl-Br bond angle | 120.0o | ||
The item table extracted from Gaussview showed that the placement of the optimisation was converged, stationary point was found and the optimisation was successful.
        Item               Value     Threshold  Converged?
Maximum Force            0.000002     0.000450     YES
RMS     Force            0.000001     0.000300     YES
Maximum Displacement     0.000022     0.001800     YES
RMS     Displacement     0.000014     0.001200     YES
Predicted change in Energy=-6.084008D-11
Optimization completed.
   -- Stationary point found.
                          ----------------------------
                          !   Optimized Parameters   !
                          ! (Angstroms and Degrees)  !
--------------------------                            --------------------------
! Name  Definition              Value          Derivative Info.                !
--------------------------------------------------------------------------------
! R1    R(1,2)                  2.651          -DE/DX =    0.0                 !
! R2    R(1,3)                  2.651          -DE/DX =    0.0                 !
! R3    R(1,4)                  2.651          -DE/DX =    0.0                 !
! A1    A(2,1,3)              120.0            -DE/DX =    0.0                 !
! A2    A(2,1,4)              120.0            -DE/DX =    0.0                 !
! A3    A(3,1,4)              120.0            -DE/DX =    0.0                 !
! D1    D(2,1,4,3)            180.0            -DE/DX =    0.0                 !
--------------------------------------------------------------------------------
GradGradGradGradGradGradGradGradGradGradGradGradGradGradGradGradGradGrad
Frequency analysis
The optimised TlBr3 using basis set LanL2DZ was used for this frequency analysis.
The .log file for this analysis was published in D-space and can be accessed here
| Table 7: TlBr3 frequency summary | |
|---|---|
| File type | .log |
| Calculation type | FREQ |
| Calculation method | RB3YLP |
| Basis set | LanL2DZ |
| Final energy | -91.21812851 a.u. |
| RMS gradient | 0.00000090 a.u. |
| Dipole moment | 0.00 Debye |
| Point group | D3h |
| Job cpu time | 15.2 sec |
| B-H bond length | 2.65 Å |
| H-B-H bond angle | 120.0o |
The item table extracted from Gaussview showed that the placement of the frequency analysis was converged, stationary point was found and the frequency analysis was successful.
        Item               Value     Threshold  Converged?
Maximum Force            0.000002     0.000450     YES
RMS     Force            0.000001     0.000300     YES
Maximum Displacement     0.000022     0.001800     YES
RMS     Displacement     0.000011     0.001200     YES
Predicted change in Energy=-5.660901D-11
Optimization completed.
   -- Stationary point found.
GradGradGradGradGradGradGradGradGradGradGradGradGradGradGradGradGradGrad
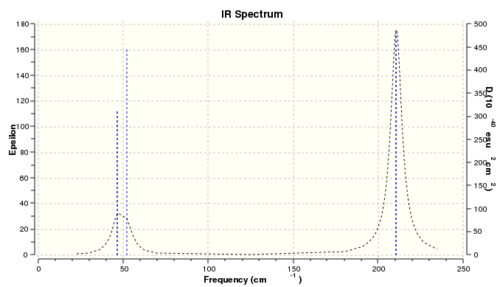
The low frequencies are extracted from Gaussview. The "zero" frequencies are within +/- 15cm-1 indicates the frequency analysis was done with reasonable accuracy. The "real" frequencies are positive. Therefore the frequency analysis was successful.
Low frequencies ---   -3.4213   -0.0026   -0.0004    0.0015    3.9367    3.9367
Low frequencies ---   46.4289   46.4292   52.1449
The lowest "real" frequency is 46.43 cm-1
Vibrational analysis
BBr3
Optimisation
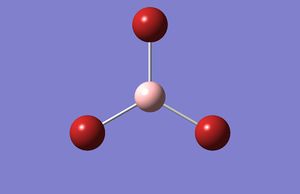
For the optimisation of BBr3, basis set Gen was used. However, different basis set / pseudo potential was specified to different atoms: 6-31G(d,p) for boron, LanL2DZ for the two bromine.
The .log file for the optimised BBr3 can be accessed here
| Table 9: BBr3 optimisation summary | |||
|---|---|---|---|
|
| |||
| File type | .log | ||
| Calculation type | FOPT | ||
| Calculation method | RB3YLP | ||
| Basis set | Gen | ||
| Final energy | -64.43645296 a.u. | ||
| RMS gradient | 0.00000382 a.u. | ||
| Dipole moment | 0.00 Debye | ||
| Point group | D3h | ||
| Job cpu time | 18.2 sec | ||
| B-Br bond length | 1.93 Å | ||
| Br-B-Br bond angle | 120.0o | ||
The item table extracted from Gaussview showed that the placement of the optimisation was converged, stationary point was found and the optimisation was successful.
       Item               Value     Threshold  Converged?
Maximum Force            0.000008     0.000450     YES
RMS     Force            0.000005     0.000300     YES
Maximum Displacement     0.000036     0.001800     YES
RMS     Displacement     0.000023     0.001200     YES
Predicted change in Energy=-4.026780D-10
Optimization completed.
   -- Stationary point found.
                          ----------------------------
                          !   Optimized Parameters   !
                          ! (Angstroms and Degrees)  !
--------------------------                            --------------------------
! Name  Definition              Value          Derivative Info.                !
--------------------------------------------------------------------------------
! R1    R(1,2)                  1.934          -DE/DX =    0.0                 !
! R2    R(1,3)                  1.934          -DE/DX =    0.0                 !
! R3    R(1,4)                  1.934          -DE/DX =    0.0                 !
! A1    A(2,1,3)              120.0            -DE/DX =    0.0                 !
! A2    A(2,1,4)              120.0            -DE/DX =    0.0                 !
! A3    A(3,1,4)              120.0            -DE/DX =    0.0                 !
! D1    D(2,1,4,3)            180.0            -DE/DX =    0.0                 !
--------------------------------------------------------------------------------
GradGradGradGradGradGradGradGradGradGradGradGradGradGradGradGradGradGrad
Structural comparison of BH3, BBr3, and TlBr3
| Table 10: Comparison of the bond length between BH3, BBr3, and TlBr33 | |
|---|---|
| Molecule | Bond length Å |
| BH3 | 1.19 |
| BBr3 | 1.93 |
| TlBr3 | 2.65 |
The difference in bond length of the above molecules arises from the fact that boron, bromine and thallium have different sizes, number of electrons and therefore their atomic orbitals are also very different. The strength of electronic interaction is highly dependent on the extent of orbital overlap. Boron and hydrogen are both small and are capable of interacting strongly using their low lying s-orbital to form low energy MOs. Consequently B-H bond length in BH3 is short. On the other hand, bromine is much larger and its outer orbital is large and diffused. B-Br interaction might not be favourable considering its poor overlap integral but due to the electron deficient nature of boron, bonding is possible although the bond length is considerable longer than that of borane.
The central atom plays an important role in bonding and the reactivity of the molecule. For instance, small centre boron combining with large bromide ion might result in electron repulsion between Br and neighbour Br ions causing the B-Br bond to lengthen.
Thallium is also on group 3 but it's 4 rows apart from boron in the periodic table. Large and diffused orbitals means the interaction is weak and the bond length is long.
In some occasions, Gaussview doesn't show the bond because the atomic orbital overlap / interactions between atoms are too weak for Gaussian to recognize it as a bond. Weak bonds might be exceeding the pre-defined value in Gaussian, and therefore are not shown. However it doesn't mean that they don't exist.
Frequency comparison of TlBr3 and BH3
| Table 11: Comparison of IR frequencies between BH3 and TlBr3 | |||||
|---|---|---|---|---|---|
| Vibrational mode | BH3 (cm-1) | Intensity | Vibrataional mode | TlBr3(cm-1) | Intensity |
| 1 | 1163.00 (a2") | 92.55 | 1 (e') | 46.43 | 3.69 |
| 2 | 1213.19 (e') | 14.06 | 2 (e') | 46.43 | 3.69 |
| 3 | 1213.19 (e') | 14.06 | 3 (a2") | 52.14 | 5.85 |
| 4 | 2582.26 (a1') | 00.00 | 4 (a1') | 165.27 | 00.00 |
| 5 | 2715.43 (e') | 126.33 | 5 (e') | 210.69 | 25.48 |
| 6 | 2715.43 (e') | 126.32 | 6 (e') | 210.69 | 25.48 |
Using E = hv/λ , the calculated difference in energy was between BH3 and TlBr3 was high (~0.13eV - ~0.32eV), in other words, it takes alot more energy to stretch or bend BH3. The high wave number also reinforces the idea discussed above that both boron and hydrogen are small and have a strong interaction.
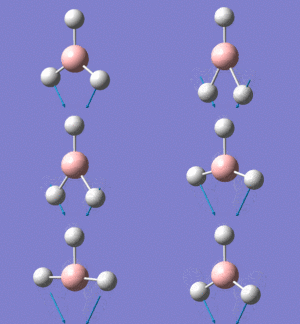
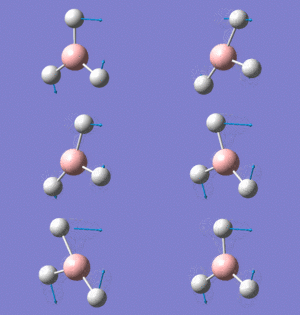
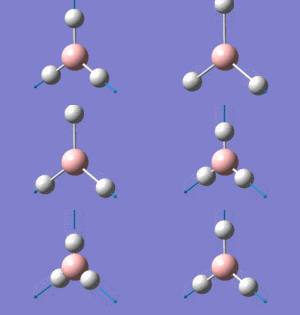
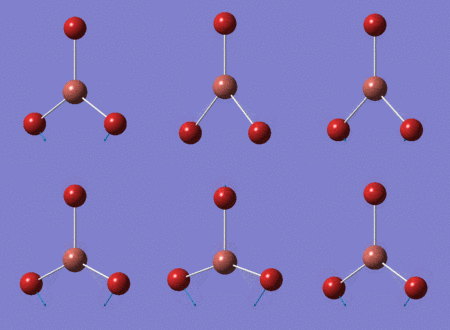
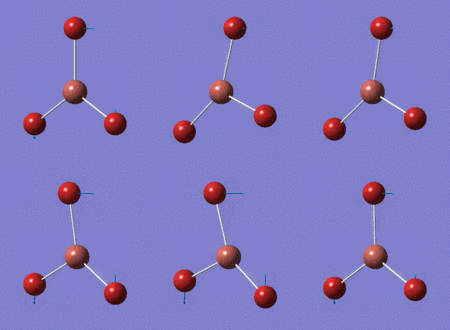
The reordering of vibrational modes (a2") reveals that more energy is needed to move the centre Tl atom in TlBr3. By looking at the computed animation, indeed, the displacement of centre (very heavy) Thallium atom vibrational mode 3 is higher than mode 1. It makes sense that the heavier the object, the more energy is required to move it.
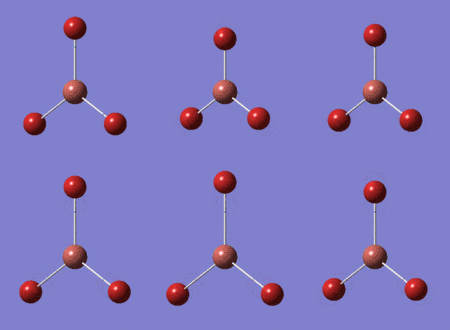
As both molecules possess D3h point group symmetry, we'd expect them to have certain similarities in the IR graphs. The computed animations in above sections have already shown that both molecules do have similar bending / stretching motions. The vibrational frequency from table 11 confirms that both have 2 sets of identical wavenumbers and intensity. The only difference is that the percentage difference between the highest & the second highest intensities is more distinct for heavier atoms.
By simplifying the vibrational motion of molecules into a two molecule, simple harmonic motion, it becomes very clear that the vibrational frequency is indirectly proportion to the square root of the reduced mass. Therefore the heavier the atoms, the lower the vibrational frequecy. ( v = 1/2πc*(k/μ)^0.5 ) where c = speed of light, k = force constant, μ = reduced mass
The two modes that lie fairly close together, the a1' and e' modes, are higher in energy than the other two which also lie fairly close together, a2" and e' modes, because a1' and e' modes are stretching modes whereas the other pair is bending mode. Generally it takes up more energy to stretch a molecule than bending it therefore in infra-red spectra, the bending mode are also identified in the lower wavenumber regions.
Discussions
There are alot of basis set to choose from in Gaussview but the same method and basis set is always used for both optimisation & frequency analysis. Basis set is a set of functions used to solve the Schrodinger equation and different sets uses combination of various approximations and hence have different degree of accuracy. It's best to keep the method and basis set consistent because using one basis set for optimisation and the other for frequency analysis may lead to miscalculation or losing out some of the factors in the basis set. Consequently, results cannot be compared directly and the errors involved in calculation will become unclear.
Frequency analysis not only act as an indication of the accuracy of the optimisation but also allow us to model and compare the vibrational motion of molecules and IR spectrum with experimental data.
Low frequencies represents the number of degrees of freedom a molecule possess, 3N-6 in general and 3N-5 for linear molecules. In Gaussview, the "-6" part is showed in the low frequencies part of the raw .log file.
NBO analysis of NH3
Before performing NBO analysis on NH3, the molecule was optimised, frequency analysis was done to ensure minimum energy is obtained and population analysis is done to obtain the MO of NH3
Optimisation of NH3
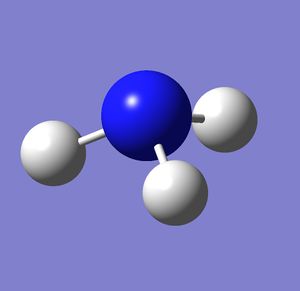
NH3 was optimised using the standard DFT, B3LYP, 6-31G(d,p) method.
The .log file can be accessed here
| Table 12: NH3 optimisation summary | |||
|---|---|---|---|
|
| |||
| File type | .log | ||
| Calculation type | FOPT | ||
| Calculation method | RB3YLP | ||
| Basis set | 6-31G(d,p) | ||
| Final energy | -56.55776863 a.u. | ||
| RMS gradient | 0.00000289 a.u. | ||
| Dipole moment | 0.00 Debye | ||
| Point group | C3v | ||
| Job cpu time | 8.0 sec | ||
| N-H bond length | 1.02 Å | ||
| H-N-H bond angle | 105.7o | ||
The item table extracted from Gaussview showed that the placement of the optimisation was converged, stationary point was found and the optimisation was successful.
        Item               Value     Threshold  Converged?
Maximum Force            0.000005     0.000450     YES
RMS     Force            0.000003     0.000300     YES
Maximum Displacement     0.000010     0.001800     YES
RMS     Displacement     0.000007     0.001200     YES
Predicted change in Energy=-7.830710D-11
Optimization completed.
   -- Stationary point found.
                          ----------------------------
                          !   Optimized Parameters   !
                          ! (Angstroms and Degrees)  !
--------------------------                            --------------------------
! Name  Definition              Value          Derivative Info.                !
--------------------------------------------------------------------------------
! R1    R(1,2)                  1.018          -DE/DX =    0.0                 !
! R2    R(1,3)                  1.018          -DE/DX =    0.0                 !
! R3    R(1,4)                  1.018          -DE/DX =    0.0                 !
! A1    A(2,1,3)              105.7463         -DE/DX =    0.0                 !
! A2    A(2,1,4)              105.7463         -DE/DX =    0.0                 !
! A3    A(3,1,4)              105.7463         -DE/DX =    0.0                 !
! D1    D(2,1,4,3)           -111.867          -DE/DX =    0.0                 !
--------------------------------------------------------------------------------
GradGradGradGradGradGradGradGradGradGradGradGradGradGradGradGradGradGrad
Frequency analysis
.log file of the frequency analysis of NH3 can be assessed here

| Table 13: NH3 frequency summary | |
|---|---|
| File type | .log |
| Calculation type | FREQ |
| Calculation method | RB3YLP |
| Basis set | 6-31G(d,p) |
| Final energy | -56.55776863 a.u. |
| RMS gradient | 0.00000281 a.u. |
| Dipole moment | 1.85 Debye |
| Point group | C3 |
| Job cpu time | 6.0 sec |
| N-H bond length | 1.02 Å |
| H-B-H bond angle | 105.7o |
| Table 14: NH3 absorption frequency | ||
|---|---|---|
| Vibrational mode | Frequency (cm-1 | Intensity |
| 1 | 1089.66 | 145.45 |
| 2 | 1694.17 | 13.56 |
| 3 | 1694.17 | 13.56 |
| 4 | 3461.07 | 1.06 |
| 5 | 3589.55 | 0.2701 |
| 6 | 3589.55 | 0.2702 |
The item table extracted from Gaussview showed that the placement of the optimisation was converged, stationary point was found and the optimisation was successful.
        Item               Value     Threshold  Converged?
Maximum Force            0.000005     0.000450     YES
RMS     Force            0.000003     0.000300     YES
Maximum Displacement     0.000011     0.001800     YES
RMS     Displacement     0.000006     0.001200     YES
Predicted change in Energy=-8.408692D-11
Optimization completed.
   -- Stationary point found.
GradGradGradGradGradGradGradGradGradGradGradGradGradGradGradGradGradGrad
Low frequencies ---  -11.6313  -11.5960   -0.0028    0.0243    0.1402   25.5608
Low frequencies --- 1089.6620 1694.1733 1694.1736
As the "zero" frequency is not within +/- 15cm-1, various other methods, such as optimising the molecule using 3-21G basis set then 6-31G basis set before performing frequency analysis on the molecule, however the "zero frequency" only went further away from the +/- 15cm-1 benchmark. Therefore, this method was kept for best accuracy and for consistency between measurements.
Population analysis
.log file of the population analysis of NH3 can be assessed here
Method: DFT, B3YLP, 6-31G(d,p)
additional keyword: pop=full; NBO type: full
| Table 15: NH3 population analysis | ||
|---|---|---|
| MO | Simulated image | Energy |
| 1 | 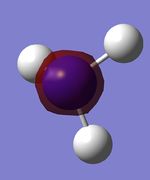 |
-14.31 |
| 2 | 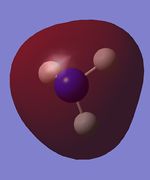 |
-0.84 |
| 3 | 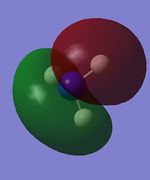 |
-0.45 |
| 4 | 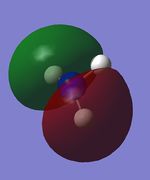 |
-0.45 |
| 5 (HOMO) | 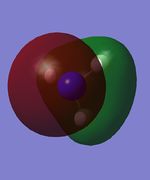 |
-0.25 |
| 6 (LUMO) |  |
0.08 |
NH3 MO diagram
With simple molecules like ammonia, the LCAO gives a good if not excellent approximation to the real MO. Similar to the MO diagram of borane, 3 hydrogens were first combined to for 2 energy levels, a1 and e. 3H LCAO is then combined with N to form the final MO diagram. The difference arises from the fact that nitrogen is bent and energy level 2a1 is no longer a non-bonding orbital.
Charge distribution
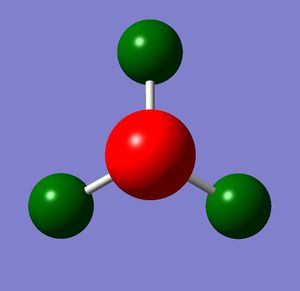
Natural bond orbital analysis (NBO analysis) was done by using the .log file from the population analysis. The red side of the colour spectrum represents negative charge and the green side vice versa. The colour range is set from -1.00 to 1.00 for convenience of future comparisons.
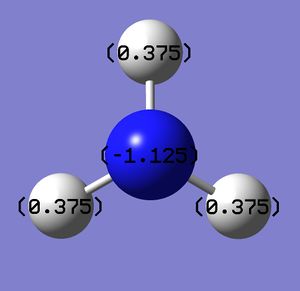
Nitrogen: -1.125
Hydrogen: 0.375
NH3BH3
Another useful feature of computational chemistry is to working out the association energy of a particular molecule, in this case, ammonia borane. Since we've already calculate the energy of ammonia and borane respectively, the difference in energy between ammonia borane and it's constituent molecules is the association energy. In this section, we're going to use the standard procedure to obtain the energy of ammonia borane and calculate the difference.
Optimisation
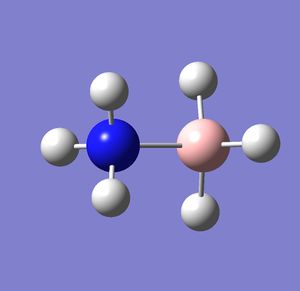
NH3BH3 was optimised using the standard DFT, B3LYP, 6-31G(d,p) method.
The .log file can be accessed here
| Table 16: NH3BH3 optimisation summary | |||
|---|---|---|---|
|
| |||
| File type | .log | ||
| Calculation type | FOPT | ||
| Calculation method | RB3YLP | ||
| Basis set | 6-31G(d,p) | ||
| Final energy | -83.22468918 a.u. | ||
| RMS gradient | 0.00006806 a.u. | ||
| Dipole moment | 5.57 Debye | ||
| Point group | C1 | ||
| Job cpu time | 50.0 sec | ||
| N-H bond length | 1.02 Å | ||
| H-N-H bond angle | 107.9o | ||
| B-H bond length | 1.21 Å | ||
| H-B-H bond angle | 113.9o | ||
| N-B bond length | 1.67 Å | ||
The item table extracted from Gaussview showed that the placement of the optimisation was converged, stationary point was found and the optimisation was successful.
        Item               Value     Threshold  Converged?
Maximum Force            0.000137     0.000450     YES
RMS     Force            0.000063     0.000300     YES
Maximum Displacement     0.000606     0.001800     YES
RMS     Displacement     0.000336     0.001200     YES
Predicted change in Energy=-1.994001D-07
Optimization completed.
   -- Stationary point found.
                          ----------------------------
                          !   Optimized Parameters   !
                          ! (Angstroms and Degrees)  !
--------------------------                            --------------------------
! Name  Definition              Value          Derivative Info.                !
--------------------------------------------------------------------------------
! R1    R(1,7)                  1.0186         -DE/DX =   -0.0001              !
! R2    R(2,7)                  1.0186         -DE/DX =   -0.0001              !
! R3    R(3,7)                  1.0186         -DE/DX =   -0.0001              !
! R4    R(4,8)                  1.2101         -DE/DX =   -0.0001              !
! R5    R(5,8)                  1.2101         -DE/DX =   -0.0001              !
! R6    R(6,8)                  1.2101         -DE/DX =   -0.0001              !
! R7    R(7,8)                  1.668          -DE/DX =   -0.0001              !
! A1    A(1,7,2)              107.87           -DE/DX =    0.0                 !
! A2    A(1,7,3)              107.8652         -DE/DX =    0.0                 !
! A3    A(1,7,8)              111.0329         -DE/DX =    0.0                 !
! A4    A(2,7,3)              107.8697         -DE/DX =    0.0                 !
! A5    A(2,7,8)              111.0286         -DE/DX =    0.0                 !
! A6    A(3,7,8)              111.0291         -DE/DX =    0.0                 !
! A7    A(4,8,5)              113.8693         -DE/DX =    0.0                 !
! A8    A(4,8,6)              113.8721         -DE/DX =    0.0                 !
! A9    A(4,8,7)              104.6003         -DE/DX =    0.0                 !
! A10   A(5,8,6)              113.8747         -DE/DX =    0.0                 !
! A11   A(5,8,7)              104.6003         -DE/DX =    0.0                 !
! A12   A(6,8,7)              104.5984         -DE/DX =    0.0                 !
! D1    D(1,7,8,4)           -179.9867         -DE/DX =    0.0                 !
! D2    D(1,7,8,5)            -59.9892         -DE/DX =    0.0                 !
! D3    D(1,7,8,6)             60.0135         -DE/DX =    0.0                 !
! D4    D(2,7,8,4)            -59.9839         -DE/DX =    0.0                 !
! D5    D(2,7,8,5)             60.0136         -DE/DX =    0.0                 !
! D6    D(2,7,8,6)           -179.9837         -DE/DX =    0.0                 !
! D7    D(3,7,8,4)             60.0161         -DE/DX =    0.0                 !
! D8    D(3,7,8,5)           -179.9864         -DE/DX =    0.0                 !
! D9    D(3,7,8,6)            -59.9837         -DE/DX =    0.0                 !
--------------------------------------------------------------------------------
GradGradGradGradGradGradGradGradGradGradGradGradGradGradGradGradGradGrad
Frequency analysis
The .log file can be accessed here
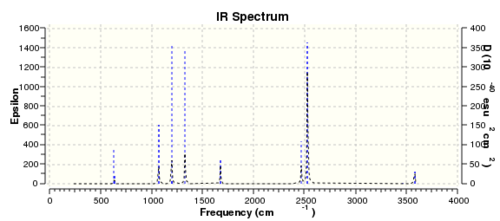
| Table 17: NH3BH3 frequency summary | |
|---|---|
| File type | .log |
| Calculation type | FREQ |
| Calculation method | RB3YLP |
| Basis set | 6-31G(d,p) |
| Final energy | -83.22468918 a.u. |
| RMS gradient | 0.00006808 a.u. |
| Dipole moment | 5.57 Debye |
| Point group | C1 |
| Job cpu time | 39.0 sec |
| N-H bond length | 1.02 Å |
| H-N-H bond angle | 107.9o |
| B-H bond length | 1.21 Å |
| H-B-H bond angle | 113.9o |
| N-B bond length | 1.67 Å |
Low frequencies ---    0.0011    0.0014    0.0015   17.1522   22.5654   38.8803
Low frequencies ---  265.8760  632.3784  639.0714
Although there's no negative frequencies in the "real" frequencies section but the unusually high "zero" frequencies, a few different basis sets were tried however, they gave even higher "zero" frequencies value. Considering that the highest "zero" frequency consist of ~15% of the lowest "real" frequency, care must be taken when using this data set for further analysis.
Association energy
The calculated energies for the BH3, NH3 and NH3BH3 are as follow:
E(BH3)= -26.61532363 a.u.
E(NH3)= -56.55776863 a.u.
E(NH3BH3)= -83.22468918 a.u.
Association energy: ΔE = E(NH3BH3) - (E(BH3) - E(NH3) = -83.22468918 - (-56.55776863 -26.61532363) = -0.05159692 a.u.
1 a.u. = 2625.50 kJ/mol
= -135.47 kJ/mol
Mini project
Investigating aromaticity
In this mini project, we're going to investigate the effects of substituting hetero-atoms on benzene ring. Four molecules were computed, benzene, boratabenzene, pyridinium and borazine. Standard procedures throughout the first part of the course is used (i.e. DFT, B3LYP, 6-31G (d,p) as the method & basis set; perform optimisation, frequency, population and NBO analysis.
The charge distribution and MO is then compared between the four aromatic compounds.
Benzene
Optimisation
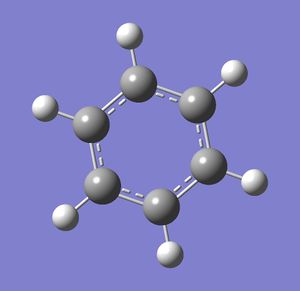
Benzene was optimised using the standard DFT, B3LYP, 6-31G(d,p) method.
The .log file can be accessed via D-space here
| Table 18: Benzene optimisation summary | |||
|---|---|---|---|
|
| |||
| File type | .log | ||
| Calculation type | FOPT | ||
| Calculation method | RB3YLP | ||
| Basis set | 6-31G(d,p) | ||
| Final energy | -232.25820551 a.u. | ||
| RMS gradient | 0.00009549 a.u. | ||
| Dipole moment | 0.00 Debye | ||
| Point group | C1 | ||
| Job cpu time | 1 min 19.8 sec | ||
| C-C bond length | 1.40 Å | ||
| C-C-C bond angle | 120.0o | ||
| C-H bond length | 1.09 Å | ||
The item table extracted from Gaussview showed that the placement of the optimisation was converged, stationary point was found and the optimisation was successful.
        Item               Value     Threshold  Converged?
Maximum Force            0.000212     0.000450     YES
RMS     Force            0.000085     0.000300     YES
Maximum Displacement     0.000991     0.001800     YES
RMS     Displacement     0.000315     0.001200     YES
Predicted change in Energy=-5.157454D-07
Optimization completed.
   -- Stationary point found.
                          ----------------------------
                          !   Optimized Parameters   !
                          ! (Angstroms and Degrees)  !
--------------------------                            --------------------------
! Name  Definition              Value          Derivative Info.                !
--------------------------------------------------------------------------------
! R1    R(1,2)                  1.3963         -DE/DX =    0.0001              !
! R2    R(1,6)                  1.3961         -DE/DX =    0.0002              !
! R3    R(1,7)                  1.0861         -DE/DX =    0.0002              !
! R4    R(2,3)                  1.3961         -DE/DX =    0.0002              !
! R5    R(2,8)                  1.0861         -DE/DX =    0.0002              !
! R6    R(3,4)                  1.3963         -DE/DX =    0.0001              !
! R7    R(3,9)                  1.086          -DE/DX =    0.0002              !
! R8    R(4,5)                  1.3961         -DE/DX =    0.0002              !
! R9    R(4,10)                 1.086          -DE/DX =    0.0002              !
! R10   R(5,6)                  1.3963         -DE/DX =    0.0001              !
! R11   R(5,11)                 1.0861         -DE/DX =    0.0002              !
! R12   R(6,12)                 1.0861         -DE/DX =    0.0002              !
! A1    A(2,1,6)              119.9972         -DE/DX =    0.0                 !
! A2    A(2,1,7)              119.9949         -DE/DX =    0.0                 !
! A3    A(6,1,7)              120.0079         -DE/DX =    0.0                 !
! A4    A(1,2,3)              120.0079         -DE/DX =    0.0                 !
! A5    A(1,2,8)              119.9881         -DE/DX =    0.0                 !
! A6    A(3,2,8)              120.004          -DE/DX =    0.0                 !
! A7    A(2,3,4)              119.9948         -DE/DX =    0.0                 !
! A8    A(2,3,9)              120.0086         -DE/DX =    0.0                 !
! A9    A(4,3,9)              119.9966         -DE/DX =    0.0                 !
! A10   A(3,4,5)              119.9972         -DE/DX =    0.0                 !
! A11   A(3,4,10)             119.9934         -DE/DX =    0.0                 !
! A12   A(5,4,10)             120.0094         -DE/DX =    0.0                 !
! A13   A(4,5,6)              120.0083         -DE/DX =    0.0                 !
! A14   A(4,5,11)             120.0014         -DE/DX =    0.0                 !
! A15   A(6,5,11)             119.9904         -DE/DX =    0.0                 !
! A16   A(1,6,5)              119.9946         -DE/DX =    0.0                 !
! A17   A(1,6,12)             120.0106         -DE/DX =    0.0                 !
! A18   A(5,6,12)             119.9948         -DE/DX =    0.0                 !
! D1    D(6,1,2,3)             -0.0059         -DE/DX =    0.0                 !
! D2    D(6,1,2,8)            180.0023         -DE/DX =    0.0                 !
! D3    D(7,1,2,3)           -180.01           -DE/DX =    0.0                 !
! D4    D(7,1,2,8)             -0.0019         -DE/DX =    0.0                 !
! D5    D(2,1,6,5)             -0.0055         -DE/DX =    0.0                 !
! D6    D(2,1,6,12)          -179.9972         -DE/DX =    0.0                 !
! D7    D(7,1,6,5)           -180.0013         -DE/DX =    0.0                 !
! D8    D(7,1,6,12)             0.007          -DE/DX =    0.0                 !
! D9    D(1,2,3,4)              0.0117         -DE/DX =    0.0                 !
! D10   D(1,2,3,9)           -179.9914         -DE/DX =    0.0                 !
! D11   D(8,2,3,4)            180.0036         -DE/DX =    0.0                 !
! D12   D(8,2,3,9)              0.0005         -DE/DX =    0.0                 !
! D13   D(2,3,4,5)             -0.0062         -DE/DX =    0.0                 !
! D14   D(2,3,4,10)          -180.0059         -DE/DX =    0.0                 !
! D15   D(9,3,4,5)            179.9969         -DE/DX =    0.0                 !
! D16   D(9,3,4,10)            -0.0028         -DE/DX =    0.0                 !
! D17   D(3,4,5,6)             -0.0051         -DE/DX =    0.0                 !
! D18   D(3,4,5,11)           180.0058         -DE/DX =    0.0                 !
! D19   D(10,4,5,6)          -180.0055         -DE/DX =    0.0                 !
! D20   D(10,4,5,11)            0.0054         -DE/DX =    0.0                 !
! D21   D(4,5,6,1)              0.011          -DE/DX =    0.0                 !
! D22   D(4,5,6,12)           180.0027         -DE/DX =    0.0                 !
! D23   D(11,5,6,1)          -179.9999         -DE/DX =    0.0                 !
! D24   D(11,5,6,12)           -0.0082         -DE/DX =    0.0                 !
--------------------------------------------------------------------------------
GradGradGradGradGradGradGradGradGradGradGradGradGradGradGradGradGradGrad
Frequency analysis
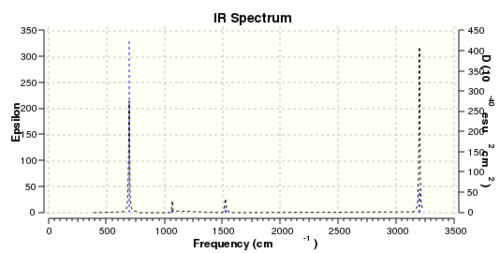
The files for the frequency analysis was published in D-space
and can be accessed here
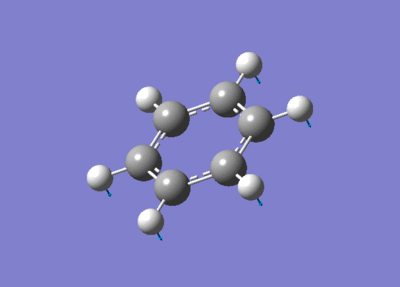
Fig 17 shows the computed IR spectrum of Benzene, it's worth noting out that although it has more than 30 different types of bending and stretching motion but most of them have zero intensities hence explaining the lack of peaks in the IR spectrum.
| Table 19: Benzene frequency summary | |
|---|---|
| File type | .log |
| Calculation type | FREQ |
| Calculation method | RB3YLP |
| Basis set | 6-31G(d,p) |
| Final energy | -232.25820551 a.u. |
| RMS gradient | 0.00009549 a.u. |
| Dipole moment | 0.00 Debye |
| Point group | C1 |
| Job cpu time | 4 min 10.4 sec |
| C-C bond length | 1.40 Å |
| C-C-C bond angle | 120.0o |
| C-H bond length | 1.09 Å |
        Item               Value     Threshold  Converged?
Maximum Force            0.000195     0.000450     YES
RMS     Force            0.000095     0.000300     YES
Maximum Displacement     0.001064     0.001800     YES
RMS     Displacement     0.000381     0.001200     YES
Predicted change in Energy=-5.065853D-07
Optimization completed.
   -- Stationary point found.
GradGradGradGradGradGradGradGradGradGradGradGradGradGradGradGradGradGrad
Low frequencies ---  -17.2788  -14.5868   -9.6527   -0.0009   -0.0008   -0.0007
Low frequencies ---  413.7971  414.4697  620.8545
One of the "zero" frequencies is not within +/- 15cm-1, 17cm-1 is reasonably small and with only 4% of the lowest "real" frequencies are positive. The frequency analysis as a whole can be considered as successful.
Population and NBO analysis
The .chk file from the optimised benzene is used to compute for the population analysis .chk and .log files can be accessed here
Method: DFT, B3YLP, 6-31G(d,p)
additional keyword: pop=full; NBO type: full
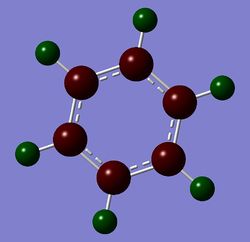
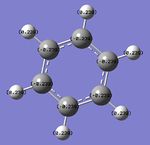
The colour range of the charge distribution is restricted to -1.00 to 1.00
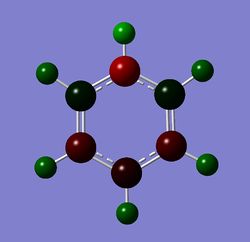
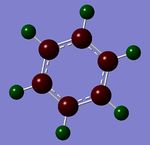
As expected carbon atoms in benzene are more electronegative therefore possess a more negative charge distribution.
MO diagram of benzene
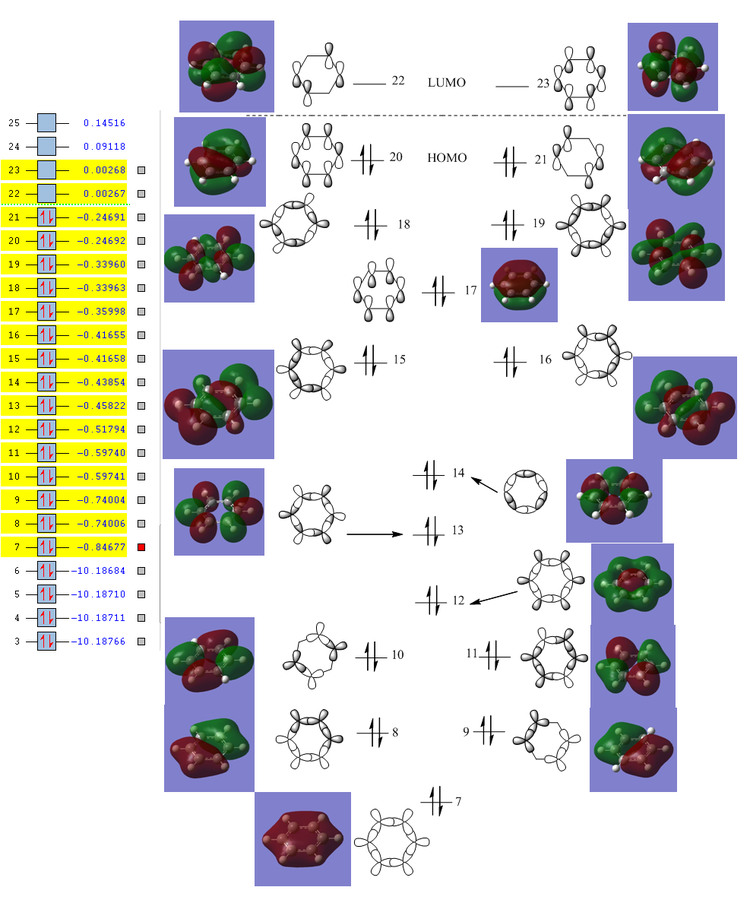
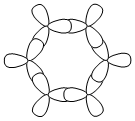
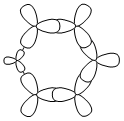
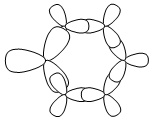
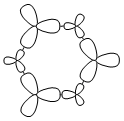
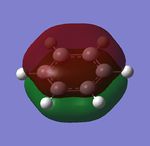
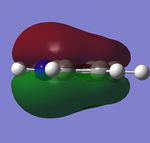
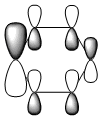
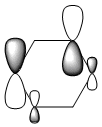
The MO of benzene was computed using Gaussview the MO diagram was created by interpreting the MOs and work backwards to create the LCAOs. The first 6 MOs were omitted because it's not the "centre" part of the diagram (i.e. they consist of 1s orbitals which doesn't contribute to the aromatic system).
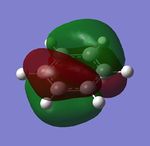
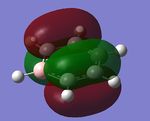
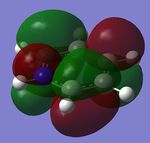
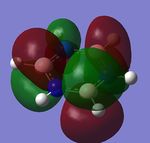
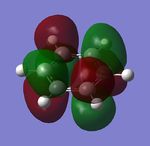
Instead of showing the individual sigma and pi orbitals, the s-orbital was combined with the pi orbital in carbon, forming sp2 hybridised orbitals. The LCAO of sp2 hybridised orbitals show a much better fit to the computed MOs. In addition, for a delocalised ring system, the carbon in benzene must be sp2 hybridised, which is shown in the "(Occupancy) Bond orbital/ Coefficients/ Hybrids" section below, where in most carbons, ~33% of electron density comes from s-orbitals and ~67% comes from p-orbitals. It's worth noting that MO number 17, 20, 21, 22 and 23 can be interpreted as "pi totally bonding MO".
From the "Summary of Natural Population Analysis", we can see that the charge distribution is essentially the same for each carbon atom in benzene (-0.239).
Summary of Natural Population Analysis:

                                      Natural Population
               Natural  -----------------------------------------------
   Atom  No    Charge         Core      Valence    Rydberg      Total
-----------------------------------------------------------------------
     C    1   -0.23852      1.99910     4.22611    0.01331     6.23852
     C    2   -0.23855      1.99910     4.22613    0.01331     6.23855
     C    3   -0.23854      1.99910     4.22613    0.01331     6.23854
     C    4   -0.23852      1.99910     4.22611    0.01331     6.23852
     C    5   -0.23855      1.99910     4.22613    0.01331     6.23855
     C    6   -0.23854      1.99910     4.22613    0.01331     6.23854
     H    7    0.23854      0.00000     0.76003    0.00144     0.76146
     H    8    0.23853      0.00000     0.76003    0.00144     0.76147
     H    9    0.23854      0.00000     0.76002    0.00144     0.76146
     H   10    0.23854      0.00000     0.76003    0.00144     0.76146
     H   11    0.23853      0.00000     0.76003    0.00144     0.76147
     H   12    0.23854      0.00000     0.76002    0.00144     0.76146
=======================================================================
  * Total *    0.00000     11.99462    29.91690    0.08847    42.00000
      (Occupancy)   Bond orbital/ Coefficients/ Hybrids
---------------------------------------------------------------------------------
    1. (1.98096) BD ( 1) C   1 - C   2
               ( 50.00%)   0.7071* C   1 s( 35.19%)p 1.84( 64.77%)d 0.00(  0.04%)
                                          -0.0001  0.5932 -0.0078  0.0006 -0.7508
                                          -0.0048 -0.2875 -0.0354 -0.0001  0.0000
                                           0.0092  0.0000  0.0000  0.0138 -0.0109
               ( 50.00%)   0.7071* C   2 s( 35.19%)p 1.84( 64.77%)d 0.00(  0.04%)
                                          -0.0001  0.5932 -0.0078  0.0006  0.7645
                                           0.0260  0.2488 -0.0245  0.0000  0.0000
                                           0.0116  0.0000  0.0000  0.0119 -0.0109
    2. (1.98097) BD ( 1) C   1 - C   6
               ( 50.00%)   0.7071* C   1 s( 35.20%)p 1.84( 64.76%)d 0.00(  0.04%)
                                          -0.0001  0.5933 -0.0079  0.0006  0.1669
                                           0.0342  0.7864  0.0103  0.0000  0.0000
                                           0.0045  0.0000  0.0000 -0.0160 -0.0109
               ( 50.00%)   0.7071* C   6 s( 35.20%)p 1.84( 64.76%)d 0.00(  0.04%)
                                          -0.0001  0.5933 -0.0079  0.0006 -0.1263
                                           0.0282 -0.7940 -0.0219  0.0000  0.0000
                                           0.0073  0.0000  0.0000 -0.0149 -0.0109
    3. (1.66532) BD ( 2) C   1 - C   6
               ( 50.00%)   0.7071* C   1 s(  0.00%)p 1.00( 99.96%)d 0.00(  0.04%)
                                           0.0000  0.0000  0.0000  0.0000 -0.0001
                                           0.0000  0.0000  0.0000  0.9997 -0.0133
                                           0.0000 -0.0066  0.0183  0.0000  0.0000
               ( 50.00%)   0.7071* C   6 s(  0.00%)p 1.00( 99.96%)d 0.00(  0.04%)
                                           0.0000  0.0000  0.0000  0.0000 -0.0001
                                           0.0000  0.0000  0.0000  0.9997 -0.0133
                                           0.0000 -0.0128 -0.0147  0.0000  0.0000
    4. (1.98305) BD ( 1) C   1 - H   7
               ( 62.04%)   0.7876* C   1 s( 29.58%)p 2.38( 70.39%)d 0.00(  0.04%)
                                          -0.0003  0.5437  0.0126 -0.0010  0.6377
                                          -0.0111 -0.5450  0.0095  0.0000  0.0000
                                          -0.0164  0.0000  0.0000  0.0026 -0.0105
               ( 37.96%)   0.6161* H   7 s( 99.95%)p 0.00(  0.05%)
                                           0.9997  0.0014 -0.0173  0.0148  0.0000
    5. (1.98098) BD ( 1) C   2 - C   3
               ( 50.00%)   0.7071* C   2 s( 35.21%)p 1.84( 64.76%)d 0.00(  0.04%)
                                          -0.0001  0.5933 -0.0079  0.0006 -0.6244
                                          -0.0331  0.5064 -0.0135  0.0000  0.0000
                                          -0.0165  0.0000  0.0000  0.0011 -0.0109
               ( 50.00%)   0.7071* C   3 s( 35.20%)p 1.84( 64.76%)d 0.00(  0.04%)
                                          -0.0001  0.5933 -0.0079  0.0006  0.5977
                                          -0.0082 -0.5377 -0.0348 -0.0001  0.0000
                                          -0.0161  0.0000  0.0000  0.0041 -0.0109
    6. (1.66534) BD ( 2) C   2 - C   3
               ( 50.00%)   0.7071* C   2 s(  0.00%)p 1.00( 99.96%)d 0.00(  0.04%)
                                           0.0000  0.0000  0.0000  0.0000  0.0000
                                           0.0000  0.0000  0.0000  0.9997 -0.0133
                                           0.0000 -0.0064  0.0184  0.0000  0.0000
               ( 50.00%)   0.7071* C   3 s(  0.00%)p 1.00( 99.96%)d 0.00(  0.04%)
                                           0.0000  0.0000  0.0000  0.0000  0.0001
                                           0.0000  0.0000  0.0000  0.9997 -0.0133
                                           0.0000  0.0192 -0.0034  0.0000  0.0000
    7. (1.98305) BD ( 1) C   2 - H   8
               ( 62.04%)   0.7876* C   2 s( 29.57%)p 2.38( 70.39%)d 0.00(  0.04%)
                                           0.0003 -0.5436 -0.0126  0.0010  0.1529
                                          -0.0027  0.8248 -0.0144  0.0000  0.0000
                                          -0.0060  0.0000  0.0000  0.0155  0.0105
               ( 37.96%)   0.6161* H   8 s( 99.95%)p 0.00(  0.05%)
                                          -0.9997 -0.0014 -0.0042 -0.0224  0.0000
    8. (1.98096) BD ( 1) C   3 - C   4
               ( 50.00%)   0.7071* C   3 s( 35.19%)p 1.84( 64.77%)d 0.00(  0.04%)
                                          -0.0001  0.5932 -0.0078  0.0006  0.1264
                                          -0.0282  0.7940  0.0218  0.0000  0.0000
                                           0.0073  0.0000  0.0000 -0.0149 -0.0109
               ( 50.00%)   0.7071* C   4 s( 35.19%)p 1.84( 64.77%)d 0.00(  0.04%)
                                          -0.0001  0.5932 -0.0078  0.0006 -0.1669
                                          -0.0342 -0.7865 -0.0103  0.0000  0.0000
                                           0.0045  0.0000  0.0000 -0.0160 -0.0109
    9. (1.98305) BD ( 1) C   3 - H   9
               ( 62.04%)   0.7876* C   3 s( 29.58%)p 2.38( 70.38%)d 0.00(  0.04%)
                                           0.0003 -0.5437 -0.0126  0.0010  0.7908
                                          -0.0138  0.2798 -0.0049 -0.0001  0.0000
                                          -0.0105  0.0000  0.0000 -0.0129  0.0105
               ( 37.96%)   0.6161* H   9 s( 99.95%)p 0.00(  0.05%)
                                          -0.9997 -0.0014 -0.0215 -0.0076  0.0000
   10. (1.98098) BD ( 1) C   4 - C   5
               ( 50.00%)   0.7071* C   4 s( 35.20%)p 1.84( 64.76%)d 0.00(  0.04%)
                                          -0.0001  0.5933 -0.0079  0.0006  0.7508
                                           0.0048  0.2875  0.0354 -0.0001  0.0000
                                           0.0092  0.0000  0.0000  0.0138 -0.0109
               ( 50.00%)   0.7071* C   5 s( 35.20%)p 1.84( 64.76%)d 0.00(  0.04%)
                                          -0.0001  0.5933 -0.0079  0.0006 -0.7645
                                          -0.0260 -0.2487  0.0245  0.0000  0.0000
                                           0.0116  0.0000  0.0000  0.0119 -0.0109
   11. (1.66533) BD ( 2) C   4 - C   5
               ( 50.00%)   0.7071* C   4 s(  0.00%)p 1.00( 99.96%)d 0.00(  0.04%)
                                           0.0000  0.0000  0.0000  0.0000  0.0000
                                           0.0000  0.0001  0.0000  0.9997 -0.0133
                                           0.0000  0.0191 -0.0037  0.0000  0.0000
               ( 50.00%)   0.7071* C   5 s(  0.00%)p 1.00( 99.96%)d 0.00(  0.04%)
                                           0.0000  0.0000  0.0000  0.0000  0.0000
                                           0.0000  0.0000  0.0000  0.9997 -0.0133
                                           0.0000 -0.0125 -0.0149  0.0000  0.0000
   12. (1.98305) BD ( 1) C   4 - H  10
               ( 62.04%)   0.7876* C   4 s( 29.58%)p 2.38( 70.39%)d 0.00(  0.04%)
                                           0.0003 -0.5437 -0.0126  0.0010  0.6378
                                          -0.0111 -0.5449  0.0095  0.0000  0.0000
                                           0.0164  0.0000  0.0000 -0.0026  0.0105
               ( 37.96%)   0.6161* H  10 s( 99.95%)p 0.00(  0.05%)
                                          -0.9997 -0.0014 -0.0173  0.0148  0.0000
   13. (1.98096) BD ( 1) C   5 - C   6
               ( 50.00%)   0.7071* C   5 s( 35.20%)p 1.84( 64.76%)d 0.00(  0.04%)
                                          -0.0001  0.5932 -0.0078  0.0006  0.6244
                                           0.0330 -0.5064  0.0135  0.0001  0.0000
                                          -0.0165  0.0000  0.0000  0.0011 -0.0109
               ( 50.00%)   0.7071* C   6 s( 35.19%)p 1.84( 64.77%)d 0.00(  0.04%)
                                          -0.0001  0.5932 -0.0078  0.0006 -0.5978
                                           0.0082  0.5377  0.0347 -0.0001  0.0000
                                          -0.0161  0.0000  0.0000  0.0041 -0.0109
   14. (1.98305) BD ( 1) C   5 - H  11
               ( 62.04%)   0.7876* C   5 s( 29.57%)p 2.38( 70.39%)d 0.00(  0.04%)
                                          -0.0003  0.5436  0.0126 -0.0010  0.1531
                                          -0.0027  0.8248 -0.0143  0.0000  0.0000
                                           0.0060  0.0000  0.0000 -0.0155 -0.0105
               ( 37.96%)   0.6161* H  11 s( 99.95%)p 0.00(  0.05%)
                                           0.9997  0.0014 -0.0042 -0.0224  0.0000
   15. (1.98305) BD ( 1) C   6 - H  12
               ( 62.04%)   0.7876* C   6 s( 29.58%)p 2.38( 70.38%)d 0.00(  0.04%)
                                          -0.0003  0.5437  0.0126 -0.0010  0.7907
                                          -0.0138  0.2800 -0.0049  0.0000  0.0000
                                           0.0105  0.0000  0.0000  0.0129 -0.0105
               ( 37.96%)   0.6161* H  12 s( 99.95%)p 0.00(  0.05%)
                                           0.9997  0.0014 -0.0215 -0.0076  0.0000
Boratabenzene
Optimisation

Boratabenzene was optimised using the standard DFT, B3LYP, 6-31G(d,p) method.
The .log file can be accessed via D-space here
| Table 20: Boratabenzene optimisation summary | |||
|---|---|---|---|
|
| |||
| File type | .log | ||
| Calculation type | FOPT | ||
| Calculation method | RB3YLP | ||
| Basis set | 6-31G(d,p) | ||
| Charge | -1 | ||
| Final energy | -219.02052984 a.u. | ||
| RMS gradient | 0.00015840 a.u. | ||
| Dipole moment | 2.85 Debye | ||
| Point group | C1 | ||
| Job cpu time | 2 min 26.0 sec | ||
| B-C bond length | 1.51 Å | ||
| C-B-C bond angle | 115.1o | ||
| B-H bond length | 1.22 Å | ||
| C-H bond length | 1.10 Å | ||
The item table extracted from Gaussview showed that the placement of the optimisation was converged, stationary point was found and the optimisation was successful.
        Item               Value     Threshold  Converged?
Maximum Force            0.000159     0.000450     YES
RMS     Force            0.000069     0.000300     YES
Maximum Displacement     0.000878     0.001800     YES
RMS     Displacement     0.000326     0.001200     YES
Predicted change in Energy=-6.589451D-07
Optimization completed.
   -- Stationary point found.
                          ----------------------------
                          !   Optimized Parameters   !
                          ! (Angstroms and Degrees)  !
--------------------------                            --------------------------
! Name  Definition              Value          Derivative Info.                !
--------------------------------------------------------------------------------
! R1    R(1,2)                  1.4053         -DE/DX =   -0.0001              !
! R2    R(1,5)                  1.3989         -DE/DX =    0.0                 !
! R3    R(1,6)                  1.0968         -DE/DX =    0.0001              !
! R4    R(2,3)                  1.4053         -DE/DX =   -0.0001              !
! R5    R(2,7)                  1.0916         -DE/DX =   -0.0001              !
! R6    R(3,4)                  1.3989         -DE/DX =    0.0                 !
! R7    R(3,8)                  1.0968         -DE/DX =    0.0001              !
! R8    R(4,9)                  1.097          -DE/DX =   -0.0001              !
! R9    R(4,12)                 1.5137         -DE/DX =    0.0001              !
! R10   R(5,11)                 1.097          -DE/DX =   -0.0001              !
! R11   R(5,12)                 1.5138         -DE/DX =    0.0001              !
! R12   R(10,12)                1.2185         -DE/DX =    0.0                 !
! A1    A(2,1,5)              122.138          -DE/DX =    0.0001              !
! A2    A(2,1,6)              117.4354         -DE/DX =    0.0                 !
! A3    A(5,1,6)              120.4266         -DE/DX =   -0.0002              !
! A4    A(1,2,3)              120.4508         -DE/DX =   -0.0001              !
! A5    A(1,2,7)              119.7734         -DE/DX =    0.0001              !
! A6    A(3,2,7)              119.7758         -DE/DX =    0.0001              !
! A7    A(2,3,4)              122.1395         -DE/DX =    0.0001              !
! A8    A(2,3,8)              117.4371         -DE/DX =    0.0                 !
! A9    A(4,3,8)              120.4234         -DE/DX =   -0.0002              !
! A10   A(3,4,9)              115.9493         -DE/DX =    0.0001              !
! A11   A(3,4,12)             120.0806         -DE/DX =   -0.0001              !
! A12   A(9,4,12)             123.9701         -DE/DX =   -0.0001              !
! A13   A(1,5,11)             115.9535         -DE/DX =    0.0001              !
! A14   A(1,5,12)             120.0812         -DE/DX =   -0.0001              !
! A15   A(11,5,12)            123.9654         -DE/DX =   -0.0001              !
! A16   A(4,12,5)             115.1098         -DE/DX =    0.0                 !
! A17   A(4,12,10)            122.4482         -DE/DX =    0.0                 !
! A18   A(5,12,10)            122.4419         -DE/DX =    0.0                 !
! D1    D(5,1,2,3)              0.0057         -DE/DX =    0.0                 !
! D2    D(5,1,2,7)            180.0027         -DE/DX =    0.0                 !
! D3    D(6,1,2,3)            180.0038         -DE/DX =    0.0                 !
! D4    D(6,1,2,7)              0.0008         -DE/DX =    0.0                 !
! D5    D(2,1,5,11)          -180.0018         -DE/DX =    0.0                 !
! D6    D(2,1,5,12)            -0.001          -DE/DX =    0.0                 !
! D7    D(6,1,5,11)             0.0002         -DE/DX =    0.0                 !
! D8    D(6,1,5,12)           180.001          -DE/DX =    0.0                 !
! D9    D(1,2,3,4)             -0.0074         -DE/DX =    0.0                 !
! D10   D(1,2,3,8)           -180.0016         -DE/DX =    0.0                 !
! D11   D(7,2,3,4)           -180.0044         -DE/DX =    0.0                 !
! D12   D(7,2,3,8)              0.0014         -DE/DX =    0.0                 !
! D13   D(2,3,4,9)            180.0049         -DE/DX =    0.0                 !
! D14   D(2,3,4,12)             0.0042         -DE/DX =    0.0                 !
! D15   D(8,3,4,9)             -0.0011         -DE/DX =    0.0                 !
! D16   D(8,3,4,12)          -180.0018         -DE/DX =    0.0                 !
! D17   D(3,4,12,5)             0.0005         -DE/DX =    0.0                 !
! D18   D(3,4,12,10)         -180.0            -DE/DX =    0.0                 !
! D19   D(9,4,12,5)          -180.0003         -DE/DX =    0.0                 !
! D20   D(9,4,12,10)           -0.0008         -DE/DX =    0.0                 !
! D21   D(1,5,12,4)            -0.002          -DE/DX =    0.0                 !
! D22   D(1,5,12,10)         -180.0015         -DE/DX =    0.0                 !
! D23   D(11,5,12,4)          179.9989         -DE/DX =    0.0                 !
! D24   D(11,5,12,10)          -0.0006         -DE/DX =    0.0                 !
--------------------------------------------------------------------------------
GradGradGradGradGradGradGradGradGradGradGradGradGradGradGradGradGradGrad
Frequency analysis
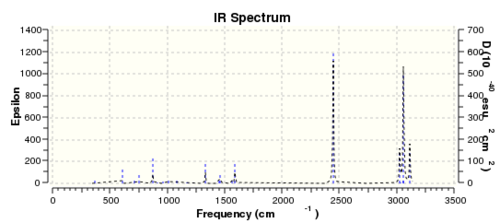
Same method and procedures as benzene was done and published via D-space here
| Table 21: Boratabenzene frequency summary | |
|---|---|
| File type | .log |
| Calculation type | FREQ |
| Calculation method | RB3YLP |
| Basis set | 6-31G(d,p) |
| Charge | -1 |
| Final energy | -219.02052984 a.u. |
| RMS gradient | 0.00015840 a.u. |
| Dipole moment | 2.85 Debye |
| Point group | C1 |
| Job cpu time | 4 min 7.9 sec |
| B-C bond length | 1.51 Å |
| C-B-C bond angle | 115.1o |
| B-H bond length | 1.22 Å |
| C-H bond length | 1.10 Å |
        Item               Value     Threshold  Converged?
Maximum Force            0.000434     0.000450     YES
RMS     Force            0.000158     0.000300     YES
Maximum Displacement     0.000887     0.001800     YES
RMS     Displacement     0.000394     0.001200     YES
Predicted change in Energy=-7.191454D-07
Optimization completed.
   -- Stationary point found.
GradGradGradGradGradGradGradGradGradGradGradGradGradGradGradGradGradGrad
Low frequencies ---  -13.1275   -0.0006   -0.0006    0.0008   15.0447   18.1653
Low frequencies ---  371.3454  404.2334  565.2534
One of the "zero" frequencies is not within +/- 15cm-1, 18cm-1 is reasonably small and with only 5% of the lowest "real" frequencies are positive. The frequency analysis as a whole can be considered as successful.
Population & NBO analysis
The .chk file from the optimised boratabenzene is used to compute for the population analysis .chk and .log files can be accessed here
Method: DFT, B3YLP, 6-31G(d,p)
additional keyword: pop=full; NBO type: full
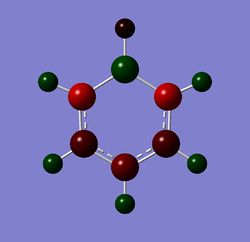
The colour range of the charge distribution is restricted to -1.00 to 1.00
Charge distribution by number
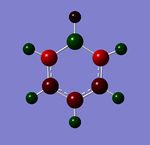
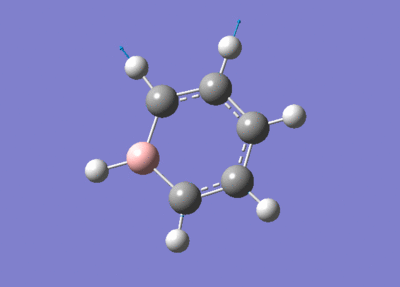
The pink atom represents boron atom, despite being negatively charged, the charge distribution shows that boron is quite positive relative to other atoms in the molecule, therefore we can say that the -ve charge in actually resonating within the ring. Although from the Gaussview image, resonance doesn't reach the boron meaning that there's no way the negative charge could be resonated, however, as we've mentioned in the "Structural comparison of BH3, BBr3, and TlBr3" section that when the bond is too weak and exceeds the pre-set limit in Gaussview, the program doesn't show the bond despite it being present. We can tell from the high negative value of the C ortho and para to boron that -ve charge has been resonated according the the Wheland intermediate diagram shown below.

From the Summary below, we can see that the natural charge for the carbon are no longer the same, as expected.
Summary of Natural Population Analysis:

                                      Natural Population
               Natural  -----------------------------------------------
   Atom  No    Charge         Core      Valence    Rydberg      Total
-----------------------------------------------------------------------
     C    1   -0.25043      1.99910     4.23720    0.01412     6.25043
     C    2   -0.33984      1.99907     4.32693    0.01384     6.33984
     C    3   -0.25041      1.99910     4.23719    0.01412     6.25041
     C    4   -0.58795      1.99901     4.57715    0.01178     6.58795
     C    5   -0.58790      1.99901     4.57711    0.01178     6.58790
     H    6    0.17906      0.00000     0.81832    0.00262     0.82094
     H    7    0.18564      0.00000     0.81237    0.00200     0.81436
     H    8    0.17906      0.00000     0.81832    0.00262     0.82094
     H    9    0.18380      0.00000     0.81402    0.00218     0.81620
     H   10   -0.09642      0.00000     1.09588    0.00054     1.09642
     H   11    0.18380      0.00000     0.81402    0.00218     0.81620
     B   12    0.20160      1.99906     2.78774    0.01160     4.79840
=======================================================================
  * Total *   -1.00000     11.99436    29.91625    0.08939    42.00000
Pyridinium
Optimisation
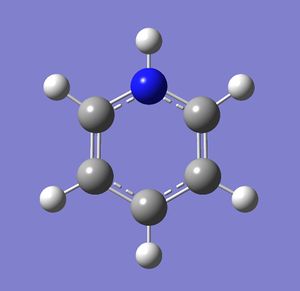
Pyridinium was optimised using the standard DFT, B3LYP, 6-31G(d,p) method.
The .log file can be accessed via D-space here
| Table 22: Pyridinium optimisation summary | |||
|---|---|---|---|
|
| |||
| File type | .log | ||
| Calculation type | FOPT | ||
| Calculation method | RB3YLP | ||
| Basis set | 6-31G(d,p) | ||
| Charge | 1 | ||
| Final energy | -248.66807396 a.u. | ||
| RMS gradient | 0.00003894 a.u. | ||
| Dipole moment | 1.8727 Debye | ||
| Point group | C1 | ||
| Job cpu time | 2 min 28.8 sec | ||
| N-C bond length | 1.51 Å | ||
| C-N-C bond angle | 123.3o | ||
| N-H bond length | 1.02 Å | ||
| C-H bond length | 1.08 Å | ||
The item table extracted from Gaussview showed that the placement of the optimisation was converged, stationary point was found and the optimisation was successful.
       Item               Value     Threshold  Converged?
Maximum Force            0.000065     0.000450     YES
RMS     Force            0.000023     0.000300     YES
Maximum Displacement     0.000826     0.001800     YES
RMS     Displacement     0.000176     0.001200     YES
Predicted change in Energy=-6.972574D-08
Optimization completed.
   -- Stationary point found.
                          ----------------------------
                          !   Optimized Parameters   !
                          ! (Angstroms and Degrees)  !
--------------------------                            --------------------------
! Name  Definition              Value          Derivative Info.                !
--------------------------------------------------------------------------------
! R1    R(1,2)                  1.3988         -DE/DX =    0.0                 !
! R2    R(1,5)                  1.3838         -DE/DX =    0.0                 !
! R3    R(1,6)                  1.0835         -DE/DX =    0.0                 !
! R4    R(2,3)                  1.3988         -DE/DX =    0.0                 !
! R5    R(2,7)                  1.0852         -DE/DX =    0.0                 !
! R6    R(3,4)                  1.3839         -DE/DX =    0.0                 !
! R7    R(3,8)                  1.0835         -DE/DX =    0.0                 !
! R8    R(4,9)                  1.0832         -DE/DX =    0.0                 !
! R9    R(4,12)                 1.3523         -DE/DX =    0.0001              !
! R10   R(5,11)                 1.0832         -DE/DX =    0.0                 !
! R11   R(5,12)                 1.3524         -DE/DX =    0.0                 !
! R12   R(10,12)                1.0169         -DE/DX =    0.0                 !
! A1    A(2,1,5)              119.0827         -DE/DX =    0.0                 !
! A2    A(2,1,6)              121.496          -DE/DX =   -0.0001              !
! A3    A(5,1,6)              119.4213         -DE/DX =    0.0                 !
! A4    A(1,2,3)              120.0549         -DE/DX =    0.0                 !
! A5    A(1,2,7)              119.9711         -DE/DX =    0.0                 !
! A6    A(3,2,7)              119.974          -DE/DX =    0.0                 !
! A7    A(2,3,4)              119.082          -DE/DX =    0.0                 !
! A8    A(2,3,8)              121.4988         -DE/DX =   -0.0001              !
! A9    A(4,3,8)              119.4192         -DE/DX =    0.0001              !
! A10   A(3,4,9)              123.9297         -DE/DX =    0.0                 !
! A11   A(3,4,12)             119.2363         -DE/DX =    0.0                 !
! A12   A(9,4,12)             116.834          -DE/DX =    0.0                 !
! A13   A(1,5,11)             123.9327         -DE/DX =    0.0                 !
! A14   A(1,5,12)             119.2354         -DE/DX =    0.0                 !
! A15   A(11,5,12)            116.8319         -DE/DX =    0.0                 !
! A16   A(4,12,5)             123.3088         -DE/DX =    0.0                 !
! A17   A(4,12,10)            118.3463         -DE/DX =    0.0                 !
! A18   A(5,12,10)            118.345          -DE/DX =    0.0                 !
! D1    D(5,1,2,3)              0.0006         -DE/DX =    0.0                 !
! D2    D(5,1,2,7)           -180.0023         -DE/DX =    0.0                 !
! D3    D(6,1,2,3)            180.0015         -DE/DX =    0.0                 !
! D4    D(6,1,2,7)             -0.0014         -DE/DX =    0.0                 !
! D5    D(2,1,5,11)          -180.0005         -DE/DX =    0.0                 !
! D6    D(2,1,5,12)             0.0021         -DE/DX =    0.0                 !
! D7    D(6,1,5,11)            -0.0014         -DE/DX =    0.0                 !
! D8    D(6,1,5,12)           180.0012         -DE/DX =    0.0                 !
! D9    D(1,2,3,4)             -0.0024         -DE/DX =    0.0                 !
! D10   D(1,2,3,8)           -180.0018         -DE/DX =    0.0                 !
! D11   D(7,2,3,4)            180.0005         -DE/DX =    0.0                 !
! D12   D(7,2,3,8)              0.0012         -DE/DX =    0.0                 !
! D13   D(2,3,4,9)            180.0002         -DE/DX =    0.0                 !
! D14   D(2,3,4,12)             0.0015         -DE/DX =    0.0                 !
! D15   D(8,3,4,9)             -0.0004         -DE/DX =    0.0                 !
! D16   D(8,3,4,12)           180.0008         -DE/DX =    0.0                 !
! D17   D(3,4,12,5)             0.0014         -DE/DX =    0.0                 !
! D18   D(3,4,12,10)         -180.001          -DE/DX =    0.0                 !
! D19   D(9,4,12,5)           180.0025         -DE/DX =    0.0                 !
! D20   D(9,4,12,10)            0.0001         -DE/DX =    0.0                 !
! D21   D(1,5,12,4)            -0.0032         -DE/DX =    0.0                 !
! D22   D(1,5,12,10)         -180.0008         -DE/DX =    0.0                 !
! D23   D(11,5,12,4)         -180.0007         -DE/DX =    0.0                 !
! D24   D(11,5,12,10)           0.0016         -DE/DX =    0.0                 !
--------------------------------------------------------------------------------
GradGradGradGradGradGradGradGradGradGradGradGradGradGradGradGradGradGrad
Frequency analysis
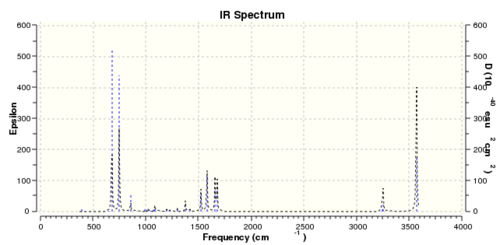
Same method and procedures as benzene was done and published via D-space here
| Table 23: Pyridinium frequency summary | |
|---|---|
| File type | .log |
| Calculation type | FREQ |
| Calculation method | RB3YLP |
| Basis set | 6-31G(d,p) |
| Charge | 1 |
| Final energy | -248.66807396 a.u. |
| RMS gradient | 0.00003897 a.u. |
| Dipole moment | 1.87 Debye |
| Point group | C1 |
| Job cpu time | 4 min 17.2 sec |
| N-C bond length | 1.51 Å |
| C-N-C bond angle | 123.3o |
| N-H bond length | 1.02 Å |
| C-H bond length | 1.08 Å |
        Item               Value     Threshold  Converged?
Maximum Force            0.000156     0.000450     YES
RMS     Force            0.000039     0.000300     YES
Maximum Displacement     0.000778     0.001800     YES
RMS     Displacement     0.000229     0.001200     YES
Predicted change in Energy=-7.500721D-08
Optimization completed.
   -- Stationary point found.
GradGradGradGradGradGradGradGradGradGradGradGradGradGradGradGradGradGrad
Low frequencies ---   -7.2115   -0.0007   -0.0005    0.0002   17.3444   18.5499
Low frequencies ---  392.4572  404.0614  620.4717
One of the "zero" frequencies is not within +/- 15cm-1, 19cm-1 is reasonably small and with only 5% of the lowest "real" frequencies are positive. The frequency analysis as a whole can be considered as successful.
Population & NBO analysis
The .chk file from the optimised pyridinium is used to compute for the population analysis .chk and .log files can be accessed here
Method: DFT, B3YLP, 6-31G(d,p)
additional keyword: pop=full; NBO type: full
The colour range of the charge distribution is restricted to -1.00 to 1.00
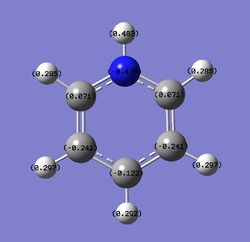
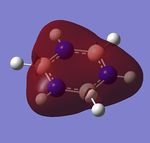
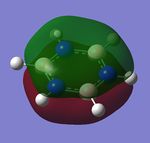
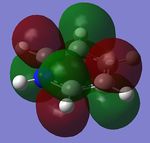
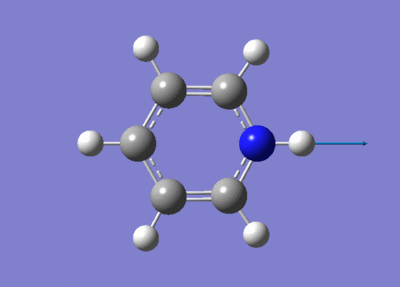
Charge distribution by number, blue atom represents nitrogen, which despite being +ve charged in its resonance structure, is actually the most negatively charged atom (-0.48)! It's also interesting to compare the H right next to Nitrogen and the C ortho and para to the nitrogen. As an isoelectronic molecule to benzene, pyridinium as a whole has +1 charge, and the +ve charge is resonated around the ring system, causing the C in its ortho and para position to be more positive than the remaining two C, as shown below Nitrogen being the most electronegative atom in pyridinium, will suck electron density from neighbour atoms hence the high charge distribution in the H next to N (+0.48) and also +0.071 from the C, experiencing the effect from resonance and the neighbouring effect.

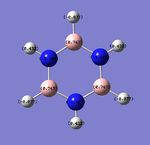
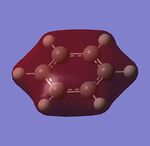
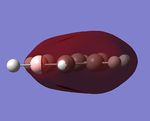
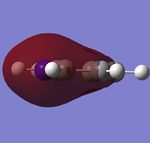
Borazine
Optimisation

Borazine was optimised using the standard DFT, B3LYP, 6-31G(d,p) method.
The .log file can be accessed via D-space here
| Table 24: Borazine optimisation summary | |||
|---|---|---|---|
|
| |||
| File type | .log | ||
| Calculation type | FOPT | ||
| Calculation method | RB3YLP | ||
| Basis set | 6-31G(d,p) | ||
| Charge | 0 | ||
| Final energy | -242.68459789 a.u. | ||
| RMS gradient | 0.00007128 a.u. | ||
| Dipole moment | 0.0003 Debye | ||
| Point group | C1 | ||
| Job cpu time | 3 min 13.9 sec | ||
| B-N bond length | 1.43 Å | ||
| N-H bond length | 1.01 Å | ||
| B-H bond length | 1.19 Å | ||
| N-B-N bond angle | 117.1o | ||
| B-N-B bond angle | 122.9o | ||
The item table extracted from Gaussview showed that the placement of the optimisation was converged, stationary point was found and the optimisation was successful.
        Item               Value     Threshold  Converged?
Maximum Force            0.000117     0.000450     YES
RMS     Force            0.000036     0.000300     YES
Maximum Displacement     0.000327     0.001800     YES
RMS     Displacement     0.000104     0.001200     YES
Predicted change in Energy=-1.206132D-07
Optimization completed.
   -- Stationary point found.
                          ----------------------------
                          !   Optimized Parameters   !
                          ! (Angstroms and Degrees)  !
--------------------------                            --------------------------
! Name  Definition              Value          Derivative Info.                !
--------------------------------------------------------------------------------
! R1    R(1,8)                  1.0097         -DE/DX =    0.0                 !
! R2    R(2,12)                 1.1949         -DE/DX =    0.0001              !
! R3    R(3,9)                  1.0097         -DE/DX =    0.0                 !
! R4    R(4,11)                 1.1949         -DE/DX =    0.0001              !
! R5    R(5,7)                  1.0097         -DE/DX =    0.0                 !
! R6    R(6,10)                 1.1949         -DE/DX =    0.0001              !
! R7    R(7,10)                 1.4307         -DE/DX =    0.0                 !
! R8    R(7,11)                 1.4307         -DE/DX =   -0.0001              !
! R9    R(8,10)                 1.4306         -DE/DX =    0.0                 !
! R10   R(8,12)                 1.4307         -DE/DX =   -0.0001              !
! R11   R(9,11)                 1.4307         -DE/DX =   -0.0001              !
! R12   R(9,12)                 1.4306         -DE/DX =    0.0                 !
! A1    A(5,7,10)             118.5554         -DE/DX =    0.0                 !
! A2    A(5,7,11)             118.5605         -DE/DX =    0.0                 !
! A3    A(10,7,11)            122.884          -DE/DX =    0.0                 !
! A4    A(1,8,10)             118.5621         -DE/DX =    0.0                 !
! A5    A(1,8,12)             118.5672         -DE/DX =    0.0                 !
! A6    A(10,8,12)            122.8707         -DE/DX =    0.0                 !
! A7    A(3,9,11)             118.5663         -DE/DX =    0.0                 !
! A8    A(3,9,12)             118.5598         -DE/DX =    0.0                 !
! A9    A(11,9,12)            122.8739         -DE/DX =    0.0                 !
! A10   A(6,10,7)             121.4339         -DE/DX =    0.0                 !
! A11   A(6,10,8)             121.4439         -DE/DX =    0.0                 !
! A12   A(7,10,8)             117.1222         -DE/DX =    0.0                 !
! A13   A(4,11,7)             121.4457         -DE/DX =    0.0                 !
! A14   A(4,11,9)             121.4367         -DE/DX =    0.0                 !
! A15   A(7,11,9)             117.1176         -DE/DX =    0.0                 !
! A16   A(2,12,8)             121.4314         -DE/DX =    0.0                 !
! A17   A(2,12,9)             121.437          -DE/DX =    0.0                 !
! A18   A(8,12,9)             117.1316         -DE/DX =    0.0                 !
! D1    D(5,7,10,6)            -0.0006         -DE/DX =    0.0                 !
! D2    D(5,7,10,8)           179.9989         -DE/DX =    0.0                 !
! D3    D(11,7,10,6)          179.9979         -DE/DX =    0.0                 !
! D4    D(11,7,10,8)           -0.0026         -DE/DX =    0.0                 !
! D5    D(5,7,11,4)             0.0008         -DE/DX =    0.0                 !
! D6    D(5,7,11,9)           180.0            -DE/DX =    0.0                 !
! D7    D(10,7,11,4)         -179.9977         -DE/DX =    0.0                 !
! D8    D(10,7,11,9)            0.0015         -DE/DX =    0.0                 !
! D9    D(1,8,10,6)             0.0011         -DE/DX =    0.0                 !
! D10   D(1,8,10,7)          -179.9984         -DE/DX =    0.0                 !
! D11   D(12,8,10,6)         -179.9993         -DE/DX =    0.0                 !
! D12   D(12,8,10,7)            0.0012         -DE/DX =    0.0                 !
! D13   D(1,8,12,2)            -0.0012         -DE/DX =    0.0                 !
! D14   D(1,8,12,9)           180.0007         -DE/DX =    0.0                 !
! D15   D(10,8,12,2)         -180.0008         -DE/DX =    0.0                 !
! D16   D(10,8,12,9)            0.0011         -DE/DX =    0.0                 !
! D17   D(3,9,11,4)            -0.0012         -DE/DX =    0.0                 !
! D18   D(3,9,11,7)           179.9995         -DE/DX =    0.0                 !
! D19   D(12,9,11,4)          180.0002         -DE/DX =    0.0                 !
! D20   D(12,9,11,7)            0.0009         -DE/DX =    0.0                 !
! D21   D(3,9,12,2)             0.0011         -DE/DX =    0.0                 !
! D22   D(3,9,12,8)          -180.0008         -DE/DX =    0.0                 !
! D23   D(11,9,12,2)          179.9997         -DE/DX =    0.0                 !
! D24   D(11,9,12,8)           -0.0022         -DE/DX =    0.0                 !
--------------------------------------------------------------------------------
GradGradGradGradGradGradGradGradGradGradGradGradGradGradGradGradGradGrad
Frequency analysis
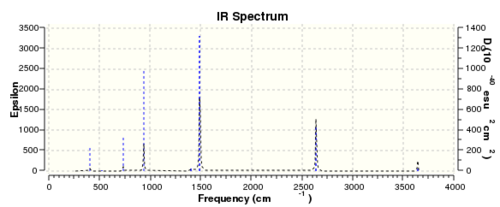
Same method and procedures as benzene was done and published via D-space here
| Table 23: Borazine frequency summary | |
|---|---|
| File type | .log |
| Calculation type | FREQ |
| Calculation method | RB3YLP |
| Basis set | 6-31G(d,p) |
| Charge | 0 |
| Final energy | -242.68459784 a.u. |
| RMS gradient | 0.00007134 a.u. |
| Dipole moment | 0.0003 Debye |
| Point group | C1 |
| Job cpu time | 4 min 18.0 sec |
| B-N bond length | 1.43 Å |
| N-H bond length | 1.01 Å |
| B-H bond length | 1.19 Å |
| N-B-N bond angle | 117.1o |
| B-N-B bond angle | 122.9o |
        Item               Value     Threshold  Converged?
Maximum Force            0.000206     0.000450     YES
RMS     Force            0.000071     0.000300     YES
Maximum Displacement     0.000379     0.001800     YES
RMS     Displacement     0.000137     0.001200     YES
Predicted change in Energy=-1.387607D-07
Optimization completed.
   -- Stationary point found.
GradGradGradGradGradGradGradGradGradGradGradGradGradGradGradGradGradGrad
Low frequencies ---  -11.2852    0.0002    0.0008    0.0012    8.9580   11.0023
Low frequencies ---  288.5034  290.4019  404.0144
The "zero" frequencies are within +/- 15cm-1 indicates the frequency analysis was done with reasonable accuracy. The "real" frequencies are positive. Therefore the frequency analysis was successful
Population & NBO analysis
The .chk file from the optimised benzene is used to compute for the population analysis .chk and .log files can be accessed here
Method: DFT, B3YLP, 6-31G(d,p)
additional keyword: pop=full; NBO type: full
The colour range of the charge distribution is restricted to -1.00 to 1.00
Charge distribution by number
Summary of Natural Population Analysis:

                                      Natural Population
               Natural  -----------------------------------------------
   Atom  No    Charge         Core      Valence    Rydberg      Total
-----------------------------------------------------------------------
     H    1    0.43199      0.00000     0.56573    0.00228     0.56801
     H    2   -0.07655      0.00000     1.07586    0.00069     1.07655
     H    3    0.43198      0.00000     0.56574    0.00228     0.56802
     H    4   -0.07654      0.00000     1.07585    0.00069     1.07654
     H    5    0.43197      0.00000     0.56575    0.00228     0.56803
     H    6   -0.07655      0.00000     1.07586    0.00069     1.07655
     N    7   -1.10239      1.99943     6.09818    0.00478     8.10239
     N    8   -1.10239      1.99943     6.09818    0.00478     8.10239
     N    9   -1.10238      1.99943     6.09818    0.00478     8.10238
     B   10    0.74696      1.99917     2.23867    0.01520     4.25304
     B   11    0.74697      1.99917     2.23865    0.01520     4.25303
     B   12    0.74693      1.99917     2.23869    0.01520     4.25307
=======================================================================
  * Total *    0.00000     11.99579    29.93532    0.06888    42.00000
Charge distribution comparison
Table 24 shows the charge distribution of four compounds, benzene, boratabenzene, pyridinium and borzine. All four molecules are isoelectronic, they all have 12 atoms and 42 electrons. Pink atom represents boron; blue represents nitrogen and grey is carbon. boratabenzene has an overall charge of -1 and pyridinium has an overall charge of +1.
Electronegativity: Boron: 2.0; Hydrogen: 2.1; Carbon: 2.5; Nitrogen: 3.0
- Benzene has 6 identical carbon and hydrogen atoms. The molecule is symmetrical and therefore each carbon / hydrogen atom is equally charge. Carbon is more electronegative than hydrogen therefore it has got -ve charge distribution.
- Boratabenzene is symmetry about σv and σh plane but it possess a much more electropositive atom: boron. Borane on its on, with only 6 valence electrons (not fulfilling the octet rule) is electron deficient. However, since boron is bonded to a pool of electron density(from the delocalised ring) and the molecule is positively charged, the relatively electropositive nature of boron means that electron density will be pushed away from it. As a result, its neighbour hydrogen is much more negatively charged compare to other hydrogens in the molecule (-0.096 compared to ~+0.18). The carbon on the ortho and para position are more negatively charged than meta position. As mentioned before, the wheland intermediate resonance form of boron shows that the addition negative charge is delocalised in the ring system. Ortho-carbon experience both electropositive electron pushing effect of boron and the negative charge's resonance effect, as a result, it is the most negatively charged in boratabenzene (-0.588).
- Pyridinium on the other hand, has a electronegative nitrogen atom attached. The ipso hydrogen's electron density is being sucked away, leaving it a much more positive charge distribution (+0.483 compared to ~+0.29 in other H-atoms.) Pyridinium is +1 charged. Similar but opposite effect to boratabenzene, the extra negative charge on pyridinium is resonated around the ring system; together with the electronegative effect of nitrogen, the ortho-carbon, followed by para-carbon has a greater -ve charge distribution.
- Borazine is symmetrical and has 3 N and 3 B to form a ring. Having identical nitrogens and borons signifies they possess identical charge. The whole molecule is neutral but unlike benzene, the hydrogens have different charges (-0.077 if next to a boron and 0.432 if next to a nitrogen). As expected, electropositive boron will push electron density towards hydrogen and electronegative nitrogen will pull electron density from hydrogen, giving the above values.
MO comparison
Four MOs presented in Table 25 are interpreted as pi totally bonding for benzene, boratabenzene, pyridinium and borazine. Although MO number 7 is sigma totally bonding but it is also included as it is the first "non-core" MO and when nitrogen / boron is present, it has got some interest features.
We first look at the energy of the MOs. Pyridinium has the lowest energy (most stable) followed by borazine then benzene and boratabenzene. It makes sense as we know that nitrogen being the most electronegative element amongst other elements present, it will lower the energy most because electrons are being held tighter (due to same shielding effect but more protons). One might argue that borazine has more nitrogen than pyridinium; that's absolutely true but on the other hand, borazine also have more boron present, raising the overall energy. Both effects effectively balance out, giving it similar energy to benzene.
One interesting fact from the computed MO is that MO 21 (HOMO) of boratabenzene actually has positive energy of ~0.01 a.u. (+26kJ/mol). Although I can't say that this is a large energy but there's a possibility that boratabenzene with an extra electron is unstable and will act as a lewis base to give off 2 electrons. On the other side of the argument, the positivly charged pyridinium has a large and -ve energy on its LUMO (-680kJ/mol!!). In fact, it's not until its 30th MO that the energy starts to become positive. Base on the energy of the MO along, we can predict that pyridinium is a very good lewis acid. The same applies to borazine although to a smaller extent.
We then look at the MO diagrams itselves. MO 17 from boratabenzene and pyridinium show a clear contrast. With a boron / nitrogen heteroatom, the "hamburger shaped MO" is clearly squashed on one side, indicating the boron is pushing electron density away and vice versa. This agrees with LCAO where the pi-orbital of boron is smaller because it has less electron density.
Lastly we'll discuss about the sigma total bonding. The reason it's interesting is because we would expect sigma orbital from hydrogen to contribute towards the overall MO 7. However, computed results show that some of the hydrogen(s) in boratabenzene, pyridinium and borazine doesn't contribute to the MO. There is no nodal plane therefore the lack of sigma contribution should not have caused by nodes in the MO. Although not shown here, but MO higher than MO 7 show that unless a nodal plane is present to block electron density from leaving the hydrogen, there's no electron density on the ipso hydrogen (in boratabenzene) or meta & para hydrogens (in pyridinium).
In short, electron density is sucked away from those hydrogen, either by the electropositive boron taking electron density away from hydrogen and pushing it to the more electronegative carbon or nitrogen is way too eletronegative (with a difference of 0.9) that it'll take electron density away from hydrogen, appearing that the meta & para H don't contribute to the overall sigma total bonding MO. The effect of both can be seen clearly in borazine, where there's a clear bite to the MO wherever boron is present.
Vibrational motion comparison
The IR spectra have not been discussed much in the previous sections of this course therefore I'd like to briefly explore the difference heteroatoms make to the vibrational motion of a 6 membered ring. It's worth pointing out that the "highest frequency motion" mentioned here represents the vibration motion of the highest epsilon infrared (or intensity) in Gaussview frequency analysis, not the highest 10-40esu2cm2 (electrostatic unit of charge square centimeter square, shown as dotted line in IR spectra)
In general, frequencies below 1600 cm-1 are caused by the bending motion of molecules and higher frequencies are from stretching motion. For a molecule with 12 atoms, we'd expect to see 30 peaks in the IR spectra (3N-6) where N = 12. Indeed, in the frequency analysis in Gaussview, 30 vibrational motions are computed but most of the have either low or zero intensity. If a vibrataional motion doesn't cause a change in dipole moment, it's not registered in the IR spectrum.
For a six membered ring, with the same symmetry, they all possess the same 30 vibrataional motions. The differences arise from heteroatoms having different masses and it takes more energy to move a heavier atom. The following equation can be used to measure quantitatively the effect of mass on vibrational frequencies: ( v = 1/2πc*(k/μ)^0.5 ) where c = speed of light, k = force constant, μ = reduced mass. (This equation is also mentioned in the previous section)
At first glance at the IR spectra, we can observe that benzene and borazine have much less number of peaks than boratabenzene or pyridinium. This is as expected because benzene and borazine much more symmetrical than the other two (Benzene: D6h; Borazine: D3h; Boratabenzene / pyridinium: C2v), alot of the vibrational motions don't appear in the spectra due to lack of change in dipole moment.
It's interesting that the highest intensity (158.4) IR absorption of pyridinium comes from the single ipso hydrogen stretching. Although not shown here but the second highest IR absorption (368.2, only 10 epsilon lower than the highest) of boratabenzene also comes from the single ipso hydrogen stretching. Although I couldn't come out with an exact explanation at the moment, but it's worth investigating this feature in the future. High intensity in IR means it's the easiest vibrational mode to occur therefore my rough guess would be that the ipso hydrogen is the lightest and easiest to move without having to involve bending or stretching motion from other atoms in the molecule. Together with the fact that moving this hydrogen will change the dipole moment of the molecule, the peak is seen in the IR spectrum. We can compare this with symmetrical molecules like benzene and borazine. Indeed, movement of a single hydrogen is not possible in both cases, from the computed frequency analysis, the lowest number of atoms involved in bending or stretching motion of benzene and borazine is 2 hydrogens.
Conclusion
Throughout the course, we've learnt to use Gaussview to create molecules and perform various techniques on the molecules: Optimisation, frequency, vibrational, population and natural bonding orbital analysis.
We first looked at simple molecules such as borane and learnt that different basis sets have their own advantages. Although we were told which method and basis set to use in this course but in the future, we'll have to be able to make judgements and decide which one is the most suitable by considering the speed and accuracy of the calculation.
By looking closely to the raw output data (.log files). No only can one tell whether the calculations has been successful or not, we can also perform frequency analysis and look at the "low frequencies" part of the .log file and tell the accuracy of the calculations.
We then computed different molecules including BBr3 and TlBr3 and compared their differences. HPC (high performance computer) is used in some of the calculations as a single computer has limited power and would take a considerable longer time to solve the equations for heavier / larger molecules. The use of HPC meant that calculations were quick (typically under 5 mins for molecules of these sizes). Thallium is toxic in nature - another advantage of using computational chemistry. Having computed molecules with similar atoms, we've use the theories and knowledge we've learnt so far to explain the data we obtained from the computer.
One of the useful features of Gaussview is that we could compute the real MOs by performing population analysis. We found out that the LCAOs (linear combination of atomic orbitals) agree closely with the computed "real" MOs; proving that the LCAO method is a very handy tool of approximating MOs when you don't have a computer.
In the second part of this course, we looked at the effect of heteroatoms on the charge distribution, molecular orbital and vibrataional motion of six membered rings, in particular, boratabenzene (-1 charge with one of the carbons substituted with boron); pyridinium (+1 charge of pyridine) and borazine (3 nitrogen and 3 boron on alternating positionsm, replacing the carbons) and compared the results with benzene. We discussed about the effect of difference in electronegativity of heteroatom playing a major role in changing the physical and chemical properties. In addition, we discussed about the effects of the extra charge on boratazene and pyridinium (considering the wheland intermediates resonance).
- charge distribution & molecular orbital: Boron is electropositive and will push electron density away. On the other hand, electronegative nitrogen will take-up electrondensity.
- vibrataional motion: Symmetry have a big effect on the the IR spectra. Having a heteroatom will reduce the symmetry of a six membered ring and fundamentally changes the way the molecule vibrates.
This course has been a very good introduction to computational chemistry, especially the use of Gaussview - we've learnt the basic techniques needed to be able to perform simple analysis and has opened up an alternative pathway to experimental chemistry for future research.
References
- ↑ E. Clementi, Theory and Applications of Computational Chemistry: The First Forty Years, 2005, Ch 6, p. 89
- ↑ Y. Gong, L. Andrews, Dalton Trans., 2011, 40, 11106-11114 DOI:10.1039/C1DT10725A
- ↑ S. A. Macgregor, Dalton Trans., 2011, 40, 11065 DOI:10.1039/C1DT90143E
- ↑ J. Paier, M. Marsman, G. Kresse, J. Chem. Phys., 2007, 127, 024103 DOI:10.1063/1.2747249
- ↑ H. Kruse, L. Goerigk, S. Grimme, J. Org. Chem., 2012, 77, 10824–10834 DOI:10.1021/jo302156p
- ↑ J. Blixt, J. Glaser, J. Mink, I. Persson, P. Persson, M. Sandstroem, J. Am. Chem. Soc., 1995, 117(18), 5089–5104 DOI:10.1021/ja00123a011

