Rep:Mod:hkysarah
Inorganic Computational Experiment Kwok Yan Ho CID: 00734384
Introduction
Computation studies is very important to solve complex problems that are impossible to analyse experimentally. It allows us to characterise the structure, study the energy of the compound and get the picture of a chemical reactions without carrying out a real experiment in the laboratory. Besides, it allows us to obtain different types of spectra for analysis and give us information on the electron density and molecular orbital diagram of the molecule. There are various types of calculation method which can be used to optimise the structure of the molecule. In this experiment, several molecules are discussed to understand their bonding and electrostatic interactions between atoms.
Part 1: Optimisation and Analysis of different molecules
Optimisation of BH3
3-21G Optimisation
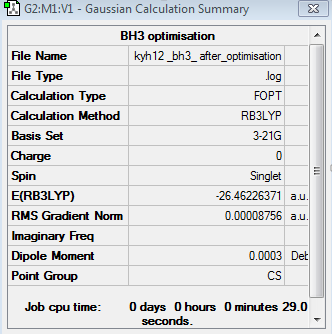
The optimisation of BH3 was done using 3-21G basis set. This basis set is determined by the bonding interaction of valence electrons, whilst the inner shell electrons are less important in this calculation. The optimisation can be found here Optimisation BH3 using 3-21G
| Bond | Bond Length (Å) | Bond | Bond Angle (o) |
|---|---|---|---|
| B1-H2 | 1.19 | H2-B1-H3 | 120.0 |
| B1-H3 | 1.19 | H2-B1-H4 | 120.0 |
| B1-H4 | 1.19 | H3-B1-H4 | 120.0 |
The point group of the optimised BH3 is Cs, not D3h. The gradient is 0.00008756 and the table above shows that the forces and displacement are successfully converged. Therefore, it proves that the optimisation is completed. The bond length is 1.19Å and the bond angle is 120o. Although the B-H bond lengths and bond angles in the optimised BH3 molecule are slightly different to the experimental values, the small deviations are acceptable[1],[2]. The optimisation process follows RB3LYP calculation methods using 3-21G basis set.
| The total energy curve of optimised BH3 | The Root Mean Square of optimised BH3 |
|---|---|
 |
|
| Optimised BH3 |
|---|
|
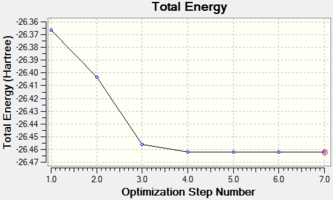
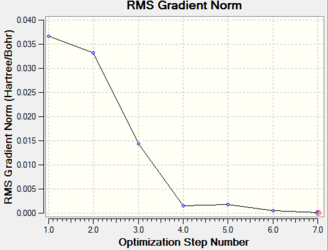
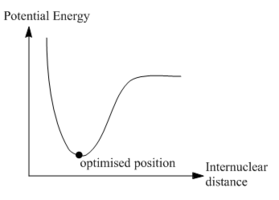
The total energy curve shows that the BH3 molecule travels along its potential energy surface until it reaches the minimum structure position. The root mean square gradient graph shows the gradient is gradually decreasing when approaching to the optimised position. The potential energy curve could be obtained from Born-Oppenheimer Approximation. In a diatomic system, if two nuclei are too close to each other, they will repel each other and the energy goes up. As the bond length stretches, it reaches the lowest potential energy and obtains the optimised position. The slope at this point should be very close to zero. As the bond length stretches further, the interaction between the nuclear and electron decreases and the energy goes up again until it reaches the plateau, resulting in the dissociation of molecule.
6-31G Optimisation
The optimisation of BH3 was done using 6-31G basis set. The optimisation can be found here Optimisation BH3 using 6-31G
| Summary | Convergency | Optimised Molecule | |||
|---|---|---|---|---|---|
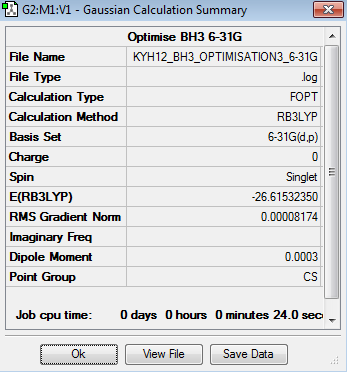 |
 Item               Value     Threshold  Converged?
 Maximum Force            0.000203     0.000450     YES
 RMS     Force            0.000098     0.000300     YES
 Maximum Displacement     0.000867     0.001800     YES
 RMS     Displacement     0.000415     0.001200     YES
 Predicted change in Energy=-1.436077D-07
 Optimization completed.
    -- Stationary point found.
|
|
| Bond | Bond Length (Å) | Bond | Bond Angle (o) |
|---|---|---|---|
| B1-H2 | 1.19 | H2-B1-H3 | 120.0 |
| B1-H3 | 1.19 | H2-B1-H4 | 120.0 |
| B1-H4 | 1.19 | H3-B1-H4 | 120.0 |
The bond length and bond angles are 1.19Å and 120o respectively, which are slightly deviated from the experimental value[1],[2], but this is acceptable. The total energy for 3-21G optimised BH3 molecule is -26.4622637au while the total energy for 6-31G optimised BH3 molecule is -26.6153235au.
Pseudo-potentials and basis-sets
Using pseudo-potentials for GaBr3 molecule
The optimisation of GaBr3 was done using LANL2DZ basis set. The pseudopotentials and medium basis set are suitable for larger molecule, like GaBr3, but it is not suitable for small molecule, such as BH3. Besides, pseudopotentials and medium basis set take longer time than 3-21G or 6-31G basis set. The optimisation can be found here Optimisation GaBr3 using LANL2DZ and the results were published on D-space DOI:10042/195219 .
| Summary | Convergency | Optimised Molecule | |||
|---|---|---|---|---|---|
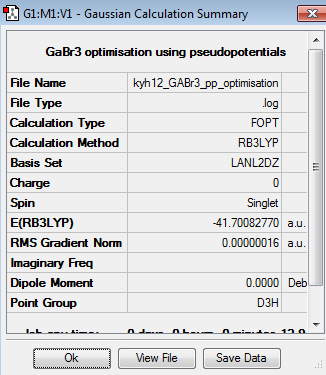 |
 Item               Value     Threshold  Converged?
 Maximum Force            0.000000     0.000450     YES
 RMS     Force            0.000000     0.000300     YES
 Maximum Displacement     0.000003     0.001800     YES
 RMS     Displacement     0.000002     0.001200     YES
 Predicted change in Energy=-1.307733D-12
 Optimization completed.
    -- Stationary point found.
|
|
| Bond | Bond Length (Å) | Bond | Bond Angle (o) |
|---|---|---|---|
| Ga1-Br2 | 2.35 | Br2-Ga1-Br3 | 120.0 |
| Ga1-Br3 | 2.35 | Br2-Ga1-Br4 | 120.0 |
| Ga1-Br4 | 2.35 | Br3-Ga1-Br4 | 120.0 |
The point group of the optimised GaBr3 molecule is D3h. The gradient is 0.00000016au, which is very close to zero. Besides, the table above shows that the forces and displacement are successfully converged. Therefore, it indicates the optimisation is successful. The computational Ga- Br bond length is 2.35Å and the Br-Ga-Br bond angle is 120o. Silva et. al reported that the experimental value of Ga- Br bond was 2.33Å[3]. Although the computational value is slightly deviated from the experimental value, it is not significant and can be neglected.
Using a mixture of basis-sets and pseudo-potentials to BBr3 molecule
The optimisation of BBr3 was done using the mixture of full basic set and pseudo-potential. In BBr3 molecule, boron is a light element which was optimised by 6-31G basis set. Alternatively, bromine ion is relatively heavier, so it was optimised by LANL2DZ basis set. The optimisation can be found here Optimisation BBr3 using LANL2DZ/6-31G(d,p) basis set and the results were published on D-space DOI:10042/195229 .
| Summary | Convergency | Optimised Molecule | |||
|---|---|---|---|---|---|
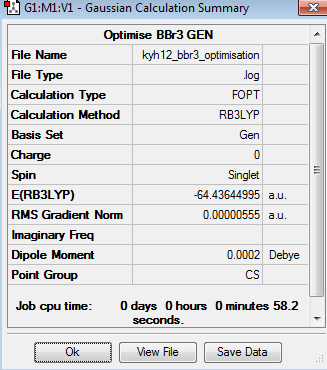 |
 Item               Value     Threshold  Converged?
 Maximum Force            0.000011     0.000450     YES
 RMS     Force            0.000007     0.000300     YES
 Maximum Displacement     0.000047     0.001800     YES
 RMS     Displacement     0.000031     0.001200     YES
 Predicted change in Energy=-6.946823D-10
 Optimization completed.
    -- Stationary point found.
|
|
| Bond | Bond Length (Å) | Bond | Bond Angle (o) |
|---|---|---|---|
| B1-Br2 | 1.93 | Br2-B1-Br3 | 120.0 |
| B1-Br3 | 1.93 | Br2-B1-Br4 | 120.0 |
| B1-Br4 | 1.93 | Br3-B1-Br4 | 120.0 |
The point group of the optimised BBr3 is Cs. The gradient is 0.00000019 and the table above shows that the forces and displacement are successfully converged. Therefore, it proves that the optimisation is completed. The bond length is 1.93Å and the bond angle is 120o. The experimental bond length and bond angle are 1.20 and 120o respectively[4],[5]. The computational value is slightly deviated from the experimental value which is acceptable.
Results and discussions
| Bond | Mean Bond Length (Å) | Bond | Mean Bond Angle (o) |
|---|---|---|---|
| B-H | 1.19 | H-B-H | 120.0 |
| Ga-Br | 2.35 | Br-Ga-Br | 120.0 |
| B-Br | 1.93 | Br-B-Br | 120.0 |
According to the results shown on table 9, the mean bond angles are the same for three different molecules. In contrast, the bond length varies as the ligand changes. As the size of the ligand increases, it increases the atomic radius and hence it moves further away from the centre atom to minimise the repulsive interaction. By comparing BH3 and BBr3 molecules, they both have boron as the centre atom, but the ligand is different. Therefore, the variation in bond length between these two molecules are greatly depended on the electronic environment of the ligands. H atom has one electrons while Br atom has 35 electrons, they both donate one outershell electron to the boron atom and form a new covalent bond. However, the outershell electron of H atom is from 1s orbital while the outershell electron of Br atom is from 4p orbitals, resulting in better orbital overlap between the 1s orbital of H atom and the 2p orbitals of boron, rather than the overlap between 4p orbitals of Br atom and boron atom. The mismatch of orbital size causes poor orbital overlap and hence it lengthens the bond. The Xd electronegativity of B, H and Br calculated by Xα method are 3.40, 7.97 and 7.24 respectively, indicating that B-H bond has larger electronegative difference than B-Br bond[6]. The larger the difference in electronegativity, the more polar the bond is, the stronger the bond will be. Hence, this proves that B-H bond is stronger than B-Br bond. Moreover, the bond energies of B-H and B-Br bond are reported to be 389 kJ/mol and 377 kJ/mol respectively, indicating that B-H bond is stronger than B-Br bond, which supports the explanation and computational results above [7],[8]
By comparing BBr3 and GaBr3 molecules, they both have the same ligand but different central atom. B atom has five electrons while Ga atom has 31 electrons; both of them are group 13 elements. B atom is more electron deficient than Ga atom, resulting in stronger B-Br bond than Ga-Br bond. Ga atom is much larger than B atom and hence it has longer atomic radius. Both Ga and Br atoms are very large, they will try to move further away from each other to minimise the electronic repulsion. Therefore, Ga-Br bond is longer than B-Br bond.
A chemical bond is the electrostatic interaction between two atoms, it depends on the electronic environment between the electrons and nuclei of the atoms. When the atom approach each other, they try to rearrange themselves to give the lowest energy conformation. Once they reach the lowest energy, they will bond together.
In most situation, triple bond is stronger than double bond and double bond is stronger than single bond. For example, the bond energies of C≡O, C=O and C-O bonds are 1070, 799 and 358 kJ/mol respectively[8]. However, some molecules do not follow this trend. Si-0 bond has bond energy 452 kJ/mol, which is considered as strong bond. In general, ionic bond has higher bonding energy than covalent bond. To conclude, triple bond is not necessary to be the strongest bond, it mainly depends on the electrostatic interaction between two atoms.
The chemical bond in Gaussview is the predefined value for bonds, so they appear as straight line. In reality, this is not true. When the optimisation in Gaussview does not fit into the given measurements, the bond will disappear or draw inaccurately.
Different analysis of BH3 and GaBr3
Frequency analysis for BH3
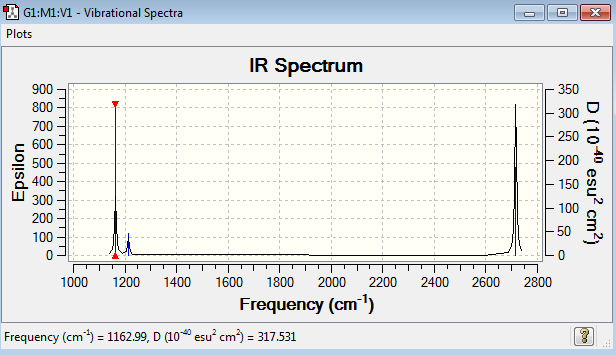
Frequency analysis represent the second derivation of the potential energy surface. If all the frequencies are positive, it indicates a minimum point on the potential energy surface. If one of the frequencies is negative, the transition state is obtained. If there are many negative frequencies, it means that the optimisation is not completed. The frequency analysis optimisation of BH3 was done using 6-31G basis set. The point group of this optimised BH3 molecule is fixed as D3h. The frequency analysis can be found here Frequency analysis of BH3
| Summary | Frequencies |
|---|---|
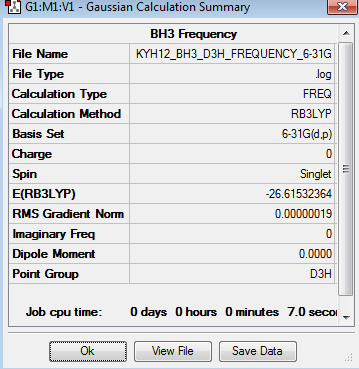 |
Low frequencies --- -9.5847 -9.5704 -0.1302 0.0007 0.5232 1.4156 Low frequencies --- 1162.9889 1213.1486 1213.1489 |
The six frequencies in the first column represent the value of ‘6’ in 3N-6, in which 3N-6 is non-linear vibrational degree of freedom. There are no negative frequencies shown in table 11, indicating the minimum point was obtained. The energy of the optimised BH3 in table 3 is -26.6153235au while the energy of the frequency analysis is -26.6153236au. The energy are close enough to confirm that the structure has not been changed during the frequency analysis.
| Mode | Vibration mode | Wavenumber (cm-1) | Intensity | IR active? | Type |
|---|---|---|---|---|---|
| 1 | 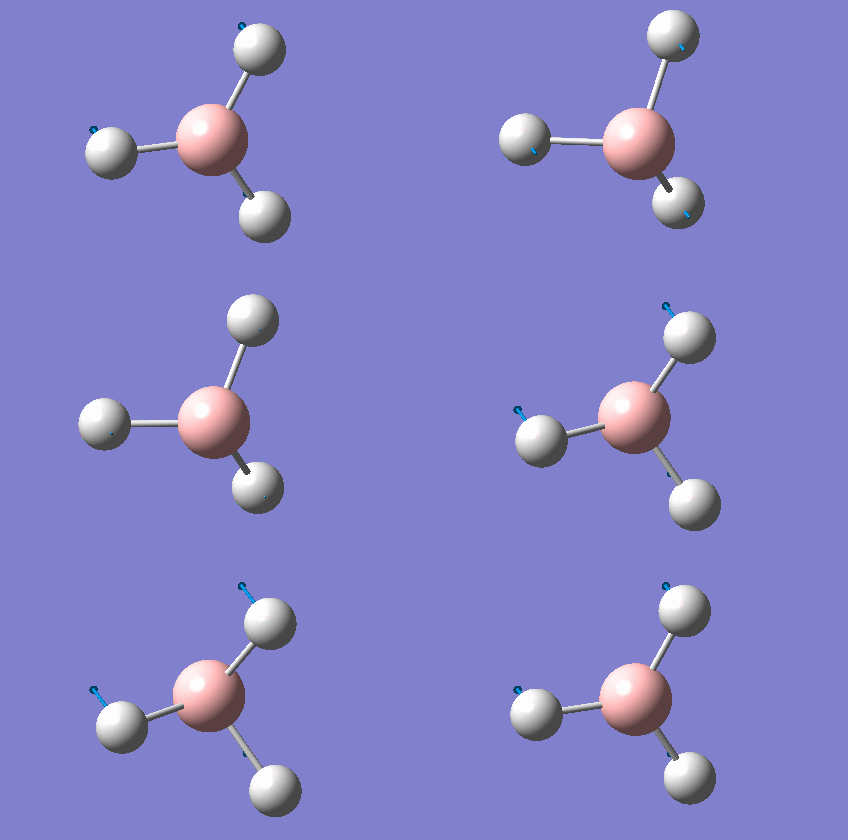 |
1163 | 93 | Yes | Bend |
| 2 | 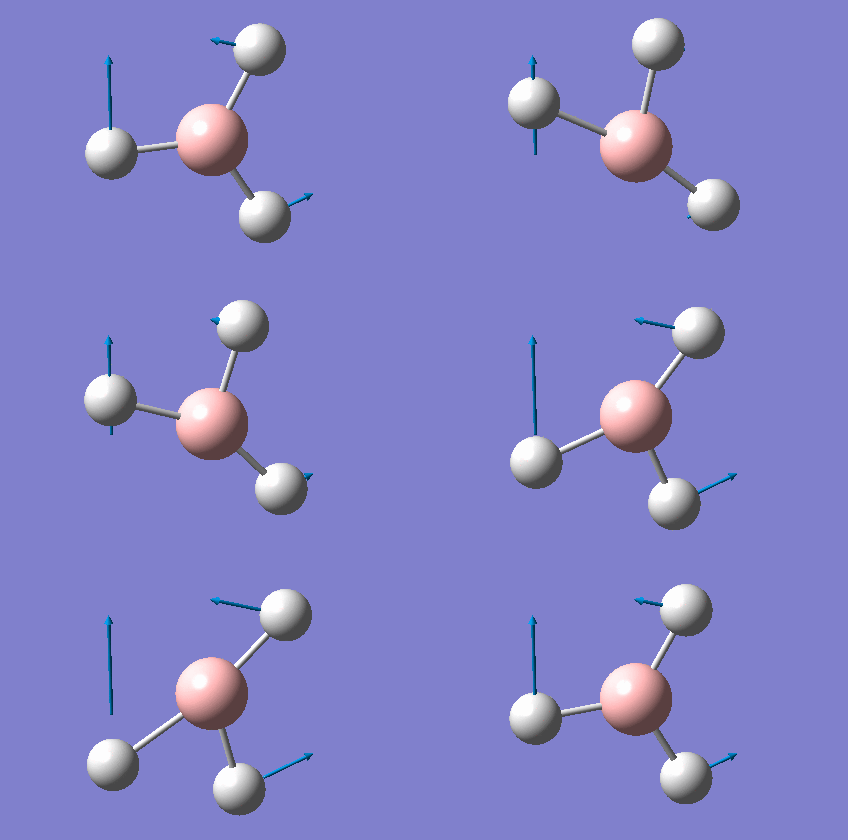 |
1213 | 14 | Very slightly | Bend |
| 3 | 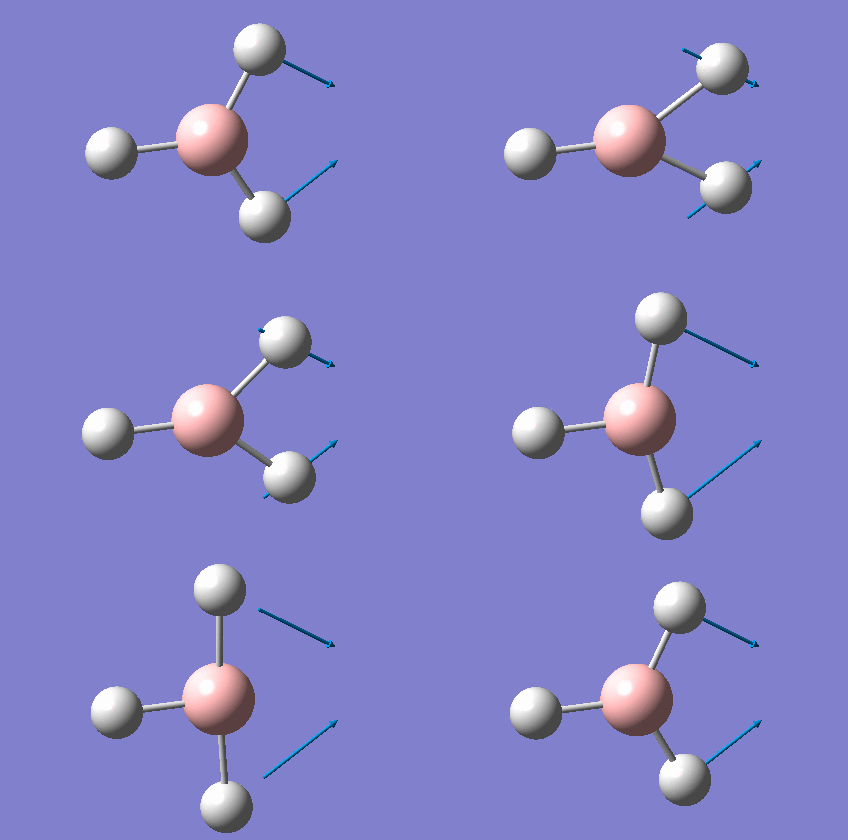 |
1213 | 14 | Very slightly | Bend |
| 4 | 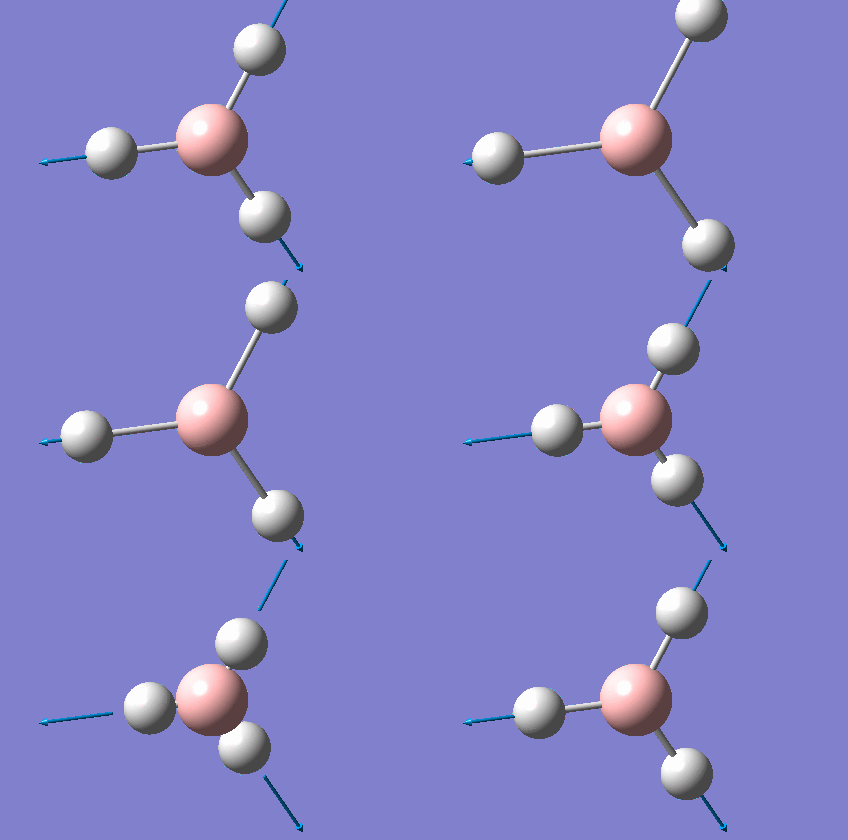 |
2583 | 0 | No | Stretch |
| 5 | 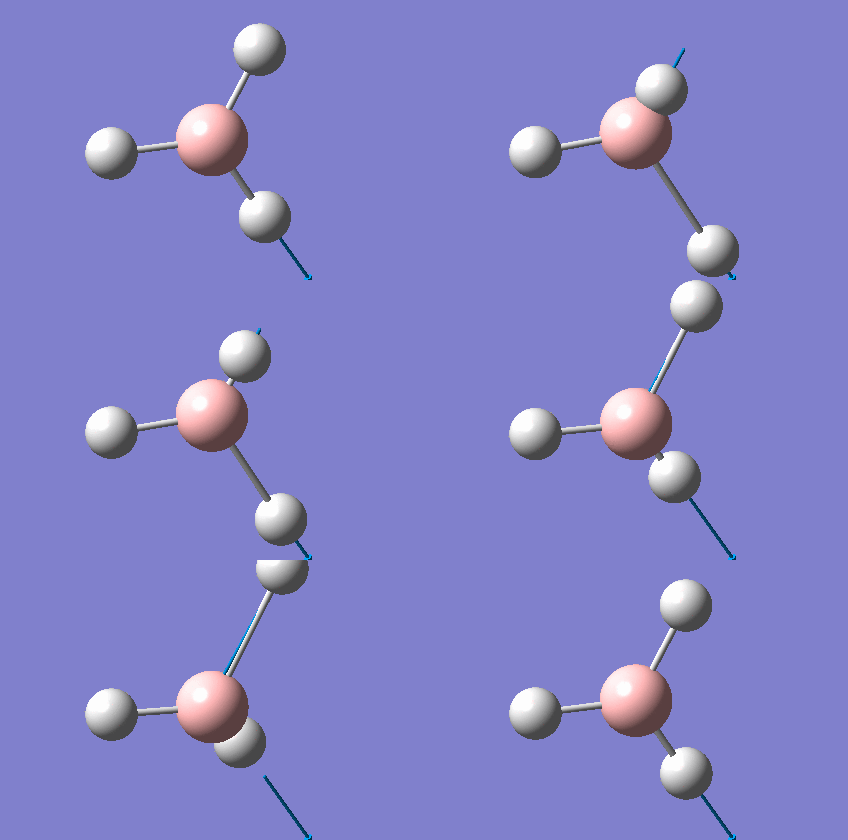 |
2716 | 126 | Yes | Stretch |
| 6 | 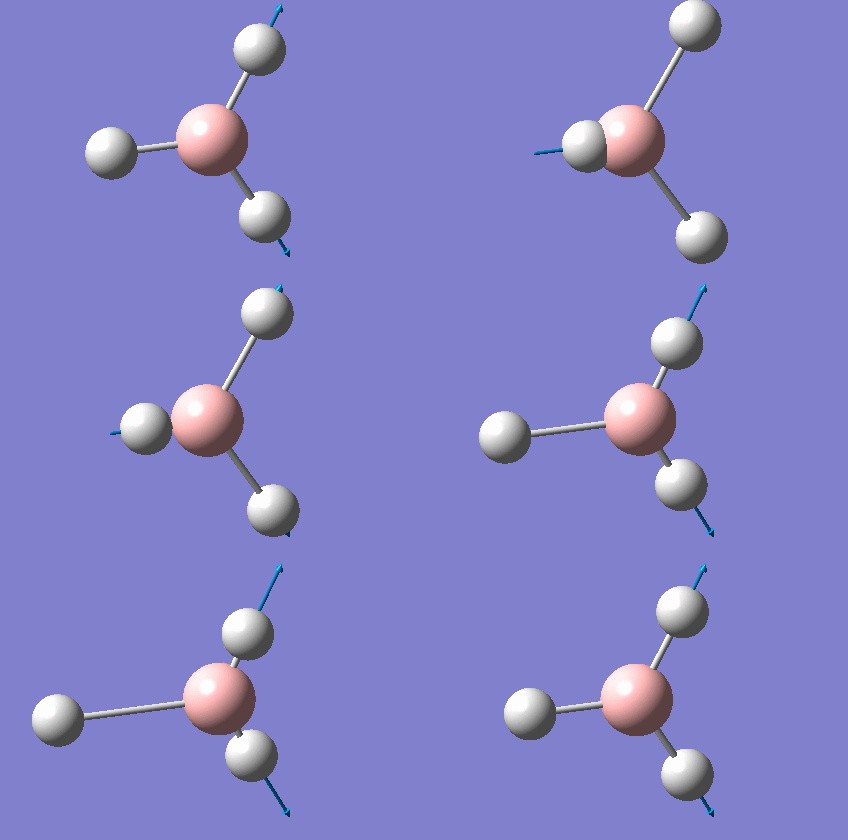 |
2716 | 126 | Yes | Stretch |
BH3 molecule has six vibration mode, each mode has its own frequency. Although there are six different vibration mode, some of their frequencies are the same, indicating that the vibrations are degenerate. Therefore, the degenerate vibrations will have a single peak as shown on the IR spectrum. This explains why there are only three peaks in the spectrum, but not six peaks. IR active involves the change in dipole moments. The vibration mode at 2583 cm-1 is IR inactive with zero intensity. The three hydrogen atoms are stretching in and out in a concerted manner, which cancels out all the dipole moment, resulting in IR inactive.
Frequency analysis for GaBr3
The frequency analysis for GaBr3 was recorded here. It was completed by LANL2DZ basis set. The frequency analysis can be found here Frequency analysis of GaBr3 and the results were published on D-space DOI:10042/195253 .
| Summary | Frequencies |
|---|---|
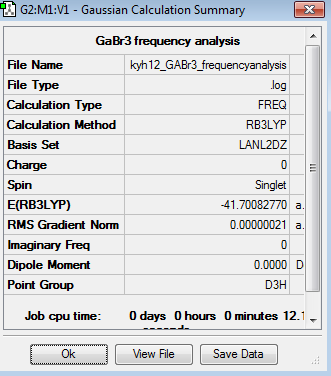 |
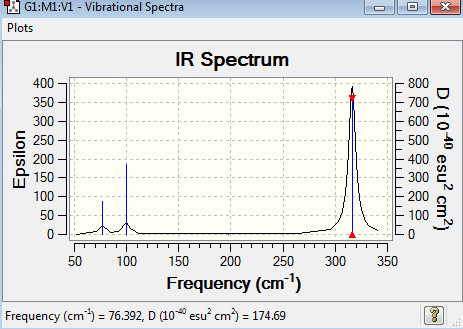
Low frequencies --- -1.4877 -0.0015 -0.0002 0.0096 0.6540 0.6540 Low frequencies --- 76.3920 76.3924 99.6767 |
| Mode | Vibration mode | Wavenumber (cm-1) | Intensity | IR active? | Type |
|---|---|---|---|---|---|
| 1 | 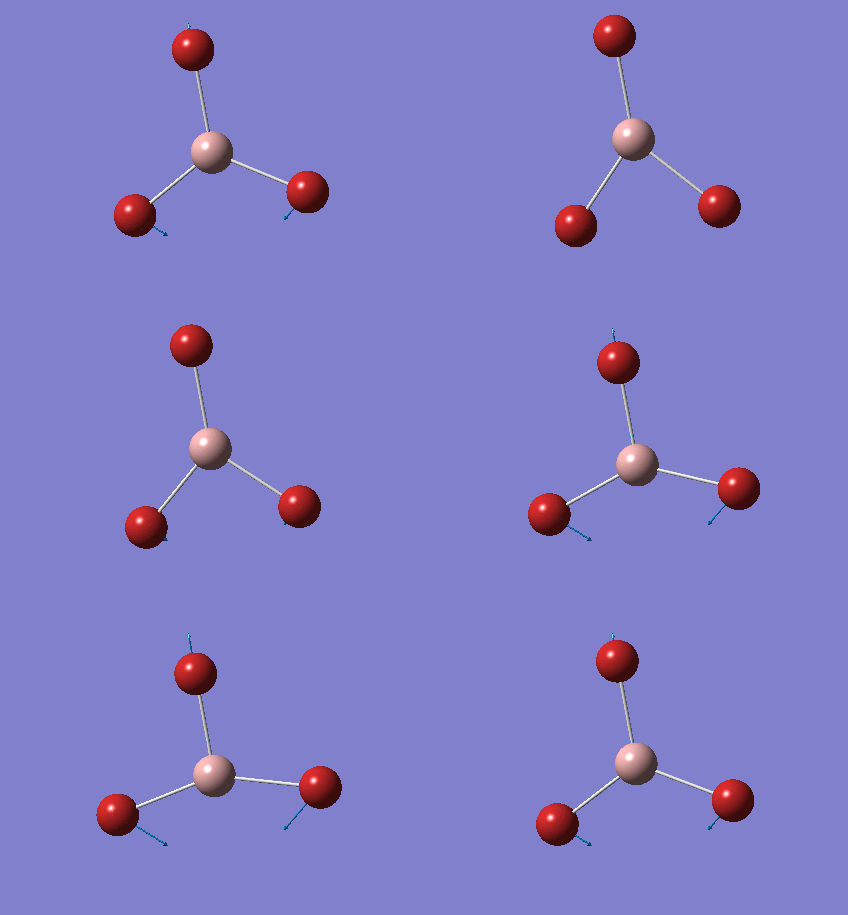 |
76 | 3 | Very slightly | Bend |
| 2 | 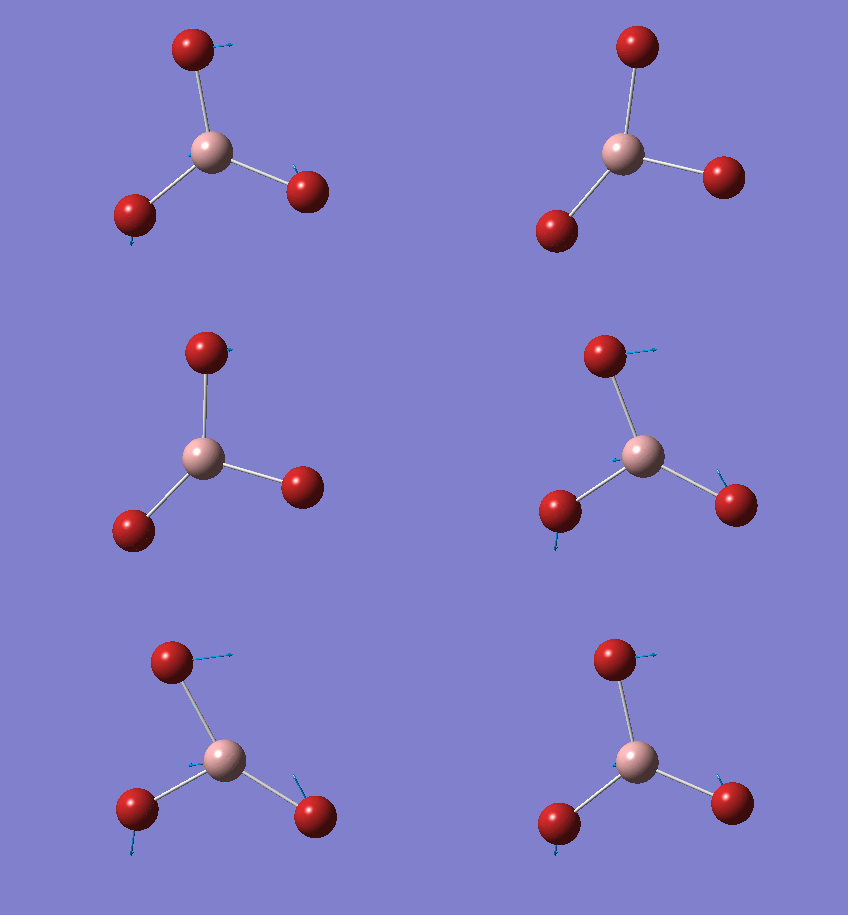 |
76 | 3 | Very slightly | Bend |
| 3 | 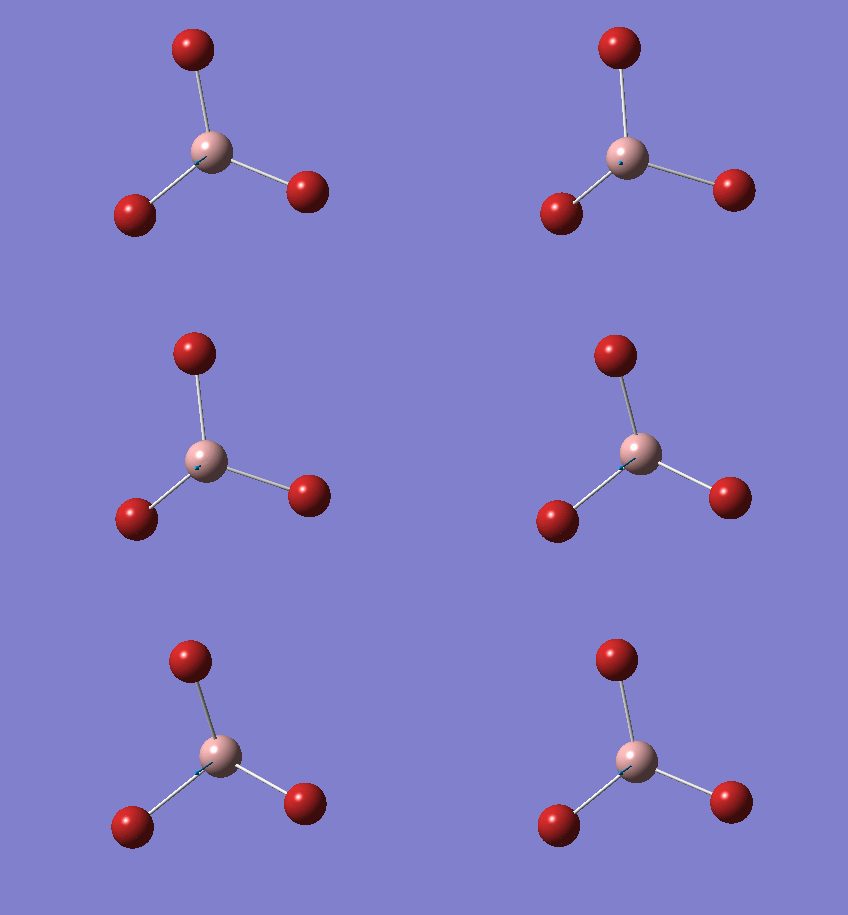 |
100 | 9 | Very slightly | Bend |
| 4 | 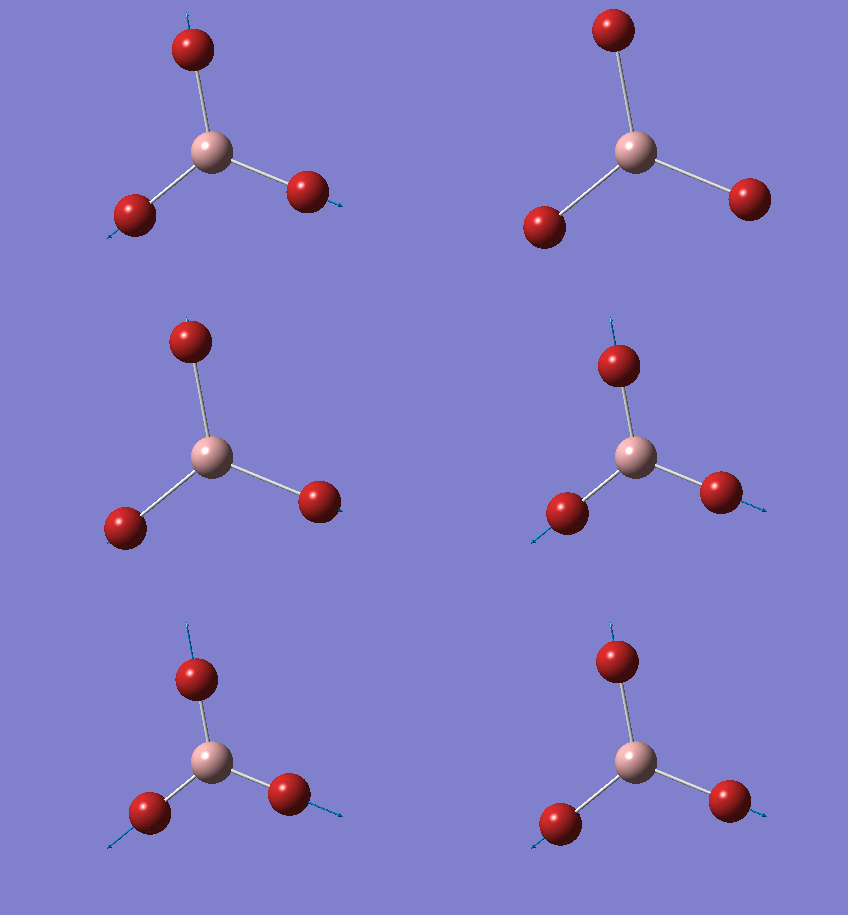 |
197 | 0 | No | Stretch |
| 5 | 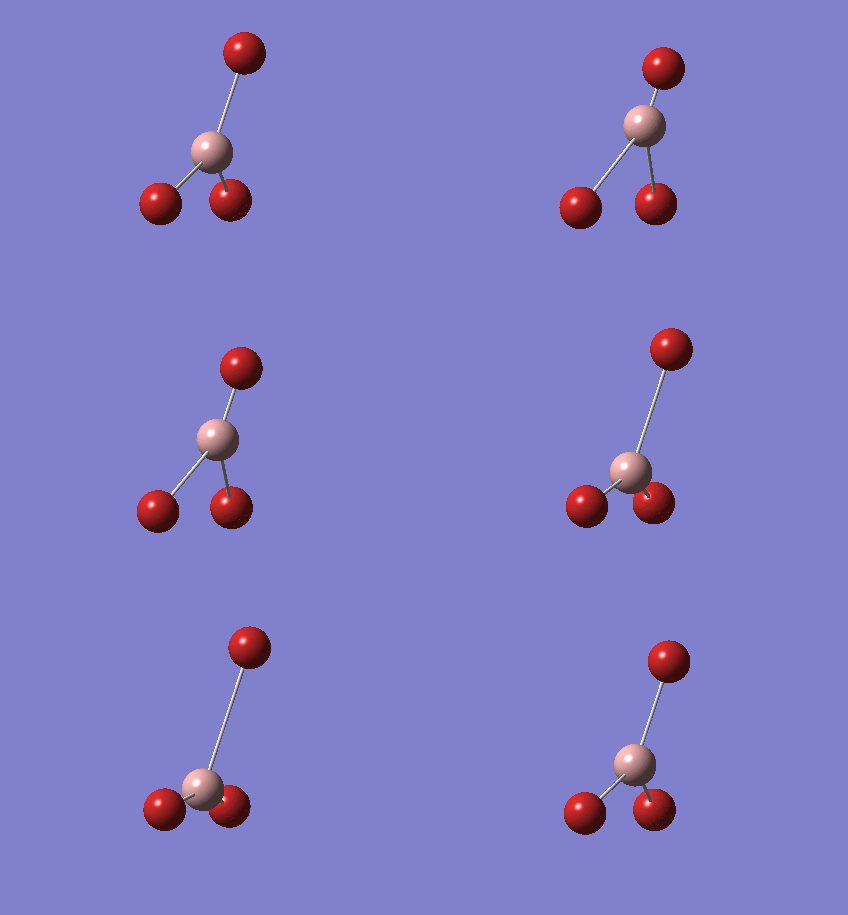 |
316 | 57 | Yes | Stretch |
| 6 | 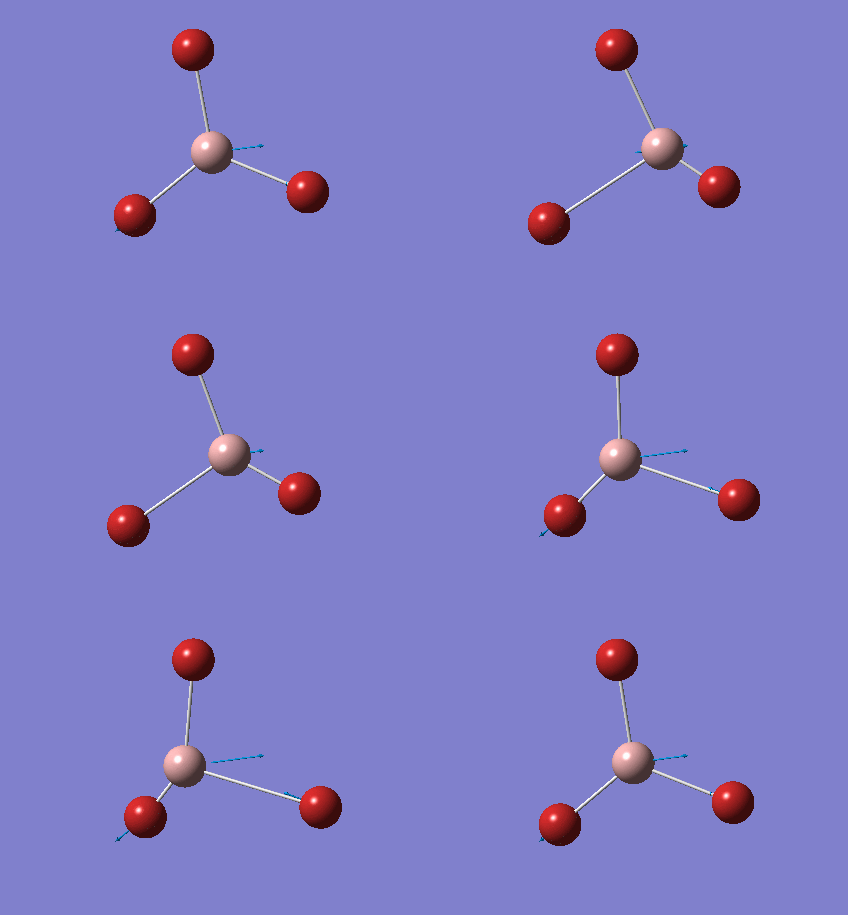 |
316 | 57 | Yes | Stretch |
The point group of the optimised GaBr3 is D3h. The gradient is 0.00000021 and the table above shows that the forces and displacement are successfully converged. No negative frequencies were recorded, indicating that the minimum point was obtained. GaBr3 is a non-linear molecule with 3N-6 vibrational degree of freedom, the six vibration mode was shown above in table 12. However, only three peaks appear in the IR spectrum. It is because some of the vibration modes have the same frequency, the vibrations are degenerate and hence they give rise to the same peak in the IR spectrum. The vibration mode at 197 cm-1 is IR inactive, resulting in zero intensity. It is due to no change in dipole moment.
Results and Discussion
Compare between BH3 and GaBr3 molecules
| Mode (BH3) | Wavenumber (cm-1) | Symmetry D3h point group | Mode (GaBr3) | Wavenumber (cm-1) | Symmetry D3h point group |
|---|---|---|---|---|---|
| 1 | 1163 | A2' | 1 | 76 | E' |
| 2 | 1213 | E' | 2 | 76 | E' |
| 3 | 1213 | E' | 3 | 100 | A2' |
| 4 | 2583 | A1' | 4 | 197 | A1' |
| 5 | 2716 | E' | 5 | 316 | E' |
| 6 | 2716 | E' | 6 | 316 | E' |
In this experiment, it is assumed that the vibration follows the harmonic oscillator, meaning that the bond will oscillate around its equilibrium position under stretching or bending. Larger difference in the frequencies of GaBr3 compared to BH3 indicate that vibrational frequencies of BH3 is much higher than GaBr3.Ga-Br bond (2.35 Å) is considerably longer than B-H bond (1.19 Å) as recorded above and as a result Ga-Br bond is weaker than B- H bond, which reduces the vibrational frequencies in the IR spectrum. The IR spectrum of GaBr3 has vibrational peaks ranging from 70-320 while the IR spectrum of BH3 ranges from 1160-2720. These results can be supported by the equation below [9].

where v stands for frequency, k is spring constant and µ is the reduced mass.
The equation of reduced mass is shown below [9].

where m1 is the mass of atom 1 and m2 is the mass of atom 2. The value of m is the molar mass of the atoms in the molecule.
The reduced mass is inversely proportional to the frequencies while the spring constant is directly proportional to it. According to the equation, GaBr3 must be lower spring constant (k) than BH3. On the other hand, the higher the reduced mass, the lower the vibrational frequencies. The reduced mass of GaBr3 and BH3 are 37.2 and 0.92 respectively, these results agree with the calculation.
There has been a reordering of modes, in which particular vibration mode gives the A2' umbrella motion. For BH3, the first vibrational mode at 1163 cm-1 gives A2' umbrella motion with intensity of 93. For GaBr3, the third vibrational mode at 100 cm-1 gives A2' umbrella motion with intensity of 9. The A2' has lower vibrational mode than E' and A1', because it has less displacement of atoms away from its equilibrium position. The A2' vibrational mode only involves the displacement of central atom (B or Ga), but the ligands stay stationary. On the other hand, the E' and A1' vibrational mode involves the displacement of more than one atom. Hence, it requires larger amount of energy to perform those motion without breaking the bond. To conclude, the larger the displacement of atoms, the stronger the vibration frequencies. The intensity relates to the degree of oscillation, the stronger the bond oscillates, the higher the intensity can be obtained. BH3 is lighter than GaBr3, so it is expected that BH3 has higher intensity than GaBr3.
It is important to use the same basis set and method for both optimisation and frequency analysis calculations to give meaningful comparison. There can only be one variable in the experiment, as the molecule varies, the basis set must be the fixed variable. The energy is solved by Schrodinger equation during optimisation and frequency analysis. Therefore, the energy of the molecule depends on the basis set and methods. If different methods and basis sets are used, the energy of the same molecule will be different and as a result it is impossible to compare.
Frequency analysis represent the second derivation of the potential energy surface. It is used to determine the minimum or maximum point as well as the transition state on the potential energy surface. If all the frequencies are positive, a minimum point is obtained. One negative frequency means that the transition state is obtained. Besides, frequency analysis provides the vibrational mode and IR spectrum of the molecule, which is very useful information in the energy calculation.
The lowest frequencies represents the translation and rotational frequencies of the molecule as explained in the reference[10].
Molecular Orbitals of BH3
The molecular orbitals of BH3 was done based on 6-31G basis set. The results were published on D-space DOI:10042/195256
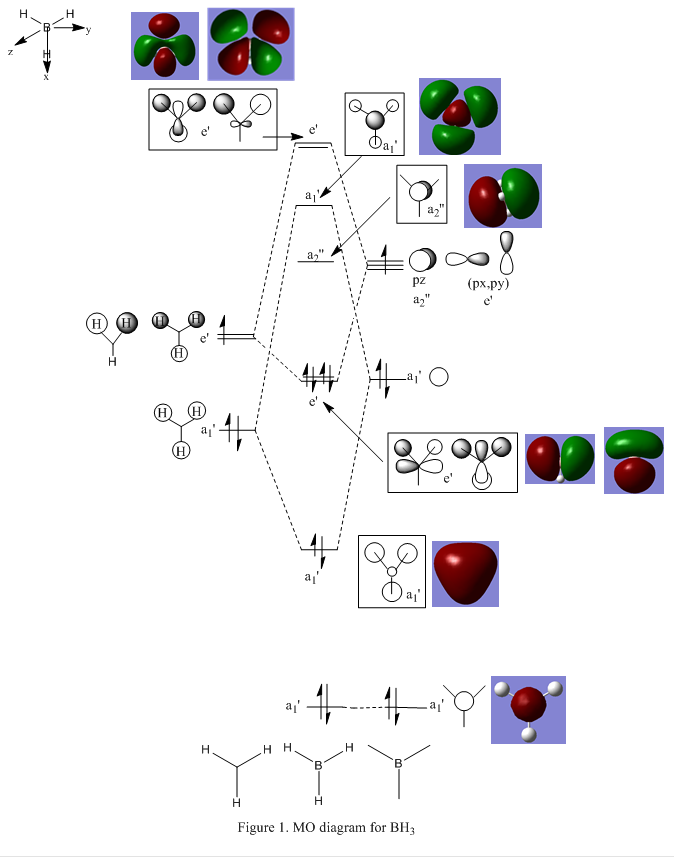
The MO diagram above is not drawn to scale due to limited space, there should have a large energy gap between the s orbital and the p orbital in MO diagram. There are no significant differences between the real and LCAO MOs as shown in Figure 1. The qualitative MO theory of BH3 is very useful in here, it gives accurate prediction for the real MOs of BH3. Further investigation is required to confirm the qualitative MO theory is accurate to all types of molecules.
Analysis of NH3
Optimisation and frequency analysis of NH3
The optimisation of NH3 was done using 6-31G basis set. The optimisation can be found here Optimisation NH3 using 6-31G.
| Summary | Convergency | Optimised Molecule | |||
|---|---|---|---|---|---|
 |
  Item               Value     Threshold  Converged?
 Maximum Force            0.000006     0.000015     YES
 RMS     Force            0.000004     0.000010     YES
 Maximum Displacement     0.000012     0.000060     YES
 RMS     Displacement     0.000008     0.000040     YES
 Predicted change in Energy=-9.845967D-11
 Optimization completed.
    -- Stationary point found.
|
|
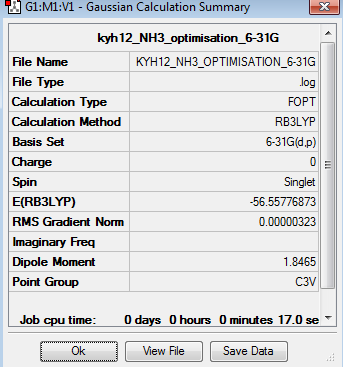
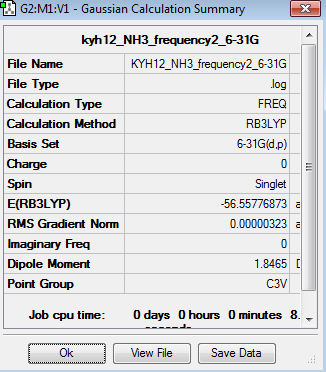
The point group of the optimised NH3 is C3v. The gradient is 0.00000323 and the table above shows that the forces and displacement are successfully converged. Therefore, it proves that the optimisation is completed.
Frequency analysis represent the second derivation of the potential energy surface. The point group of this optimised NH3 molecule is C3v. The frequency analysis can be found here Frequency analysis of NH3
| Summary | Frequencies |
|---|---|
 |
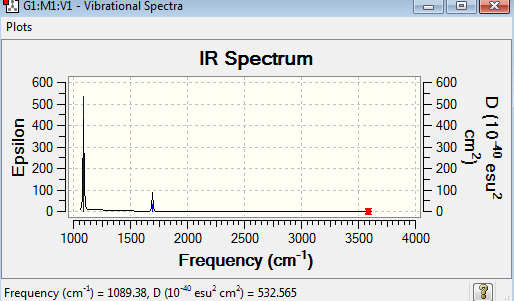
Low frequencies --- -0.0130 -0.0022 -0.0001 7.0722 8.1014 8.1017 Low frequencies --- 1089.3849 1693.9369 1693.9369 |
| Mode | Vibration mode | Wavenumber (cm-1) | Intensity | IR active? | Type |
|---|---|---|---|---|---|
| 1 | 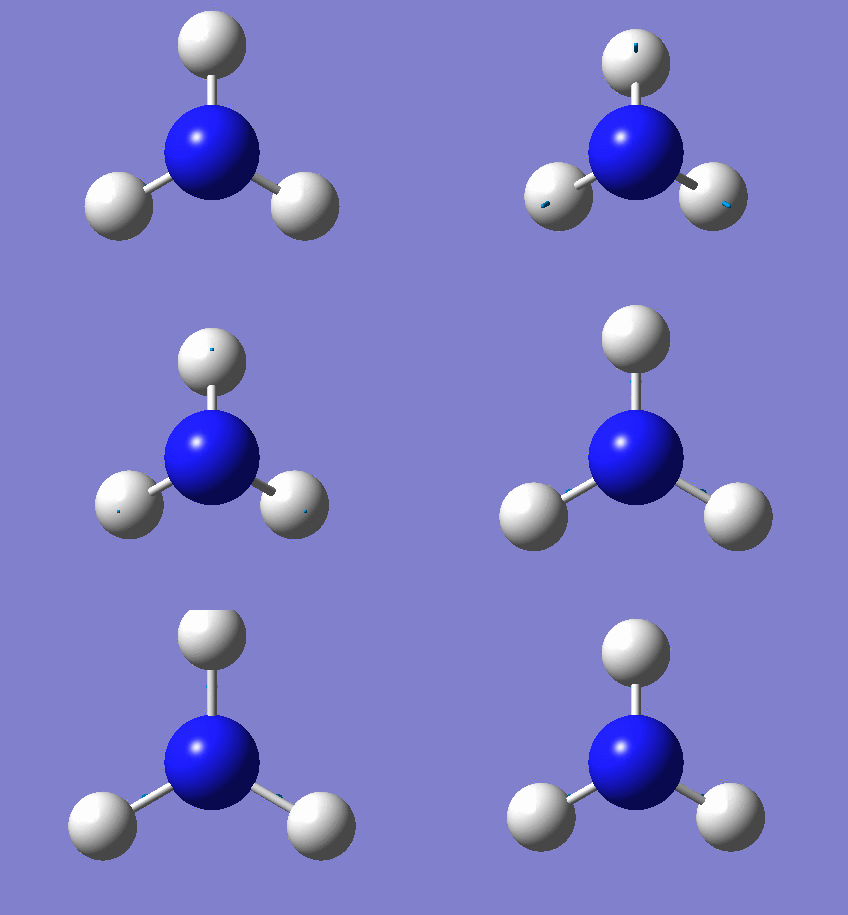 |
1089 | 145 | Yes | Bend |
| 2 | 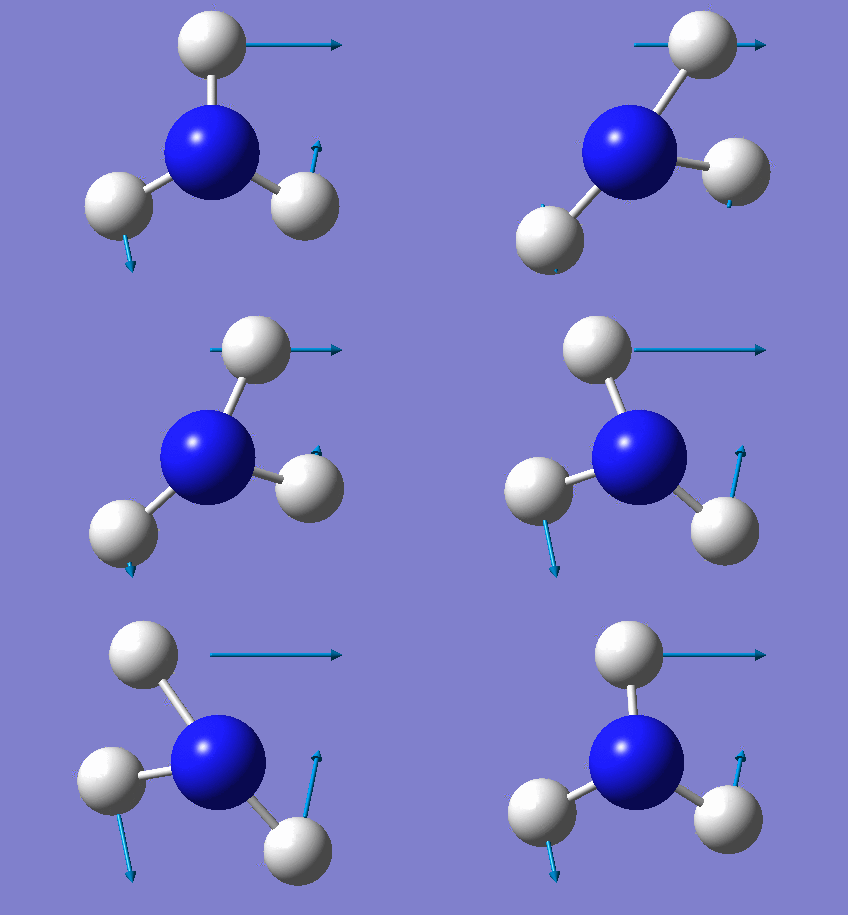 |
1694 | 14 | Very slightly | Bend |
| 3 | 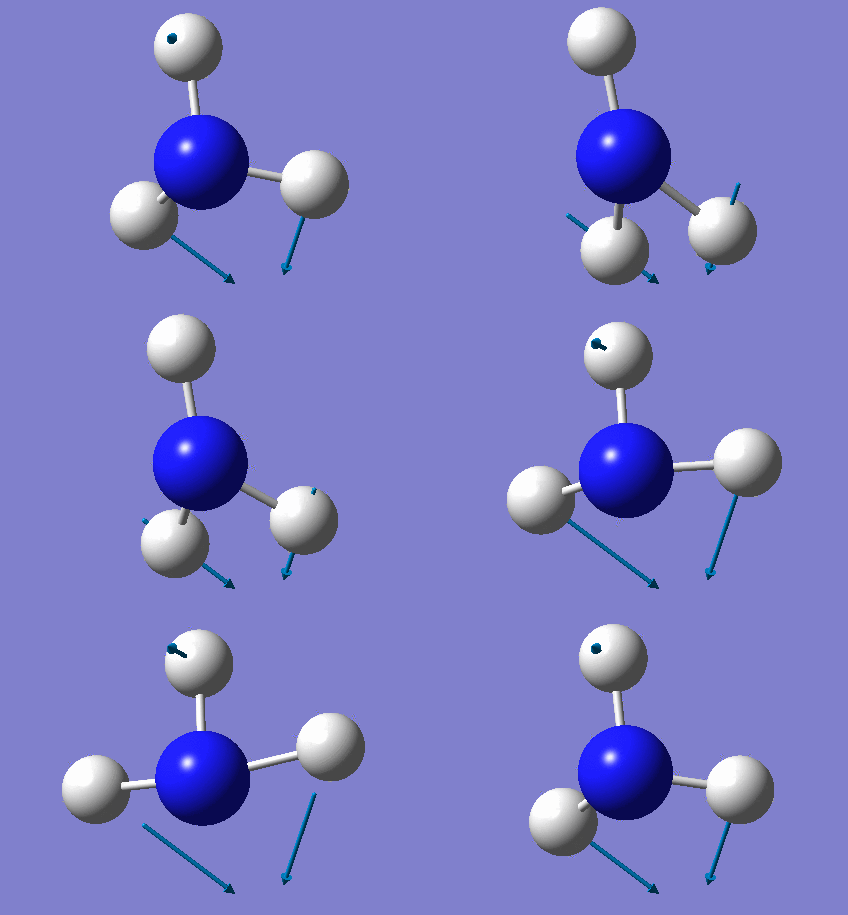 |
1694 | 14 | Very slightly | Bend |
| 4 | 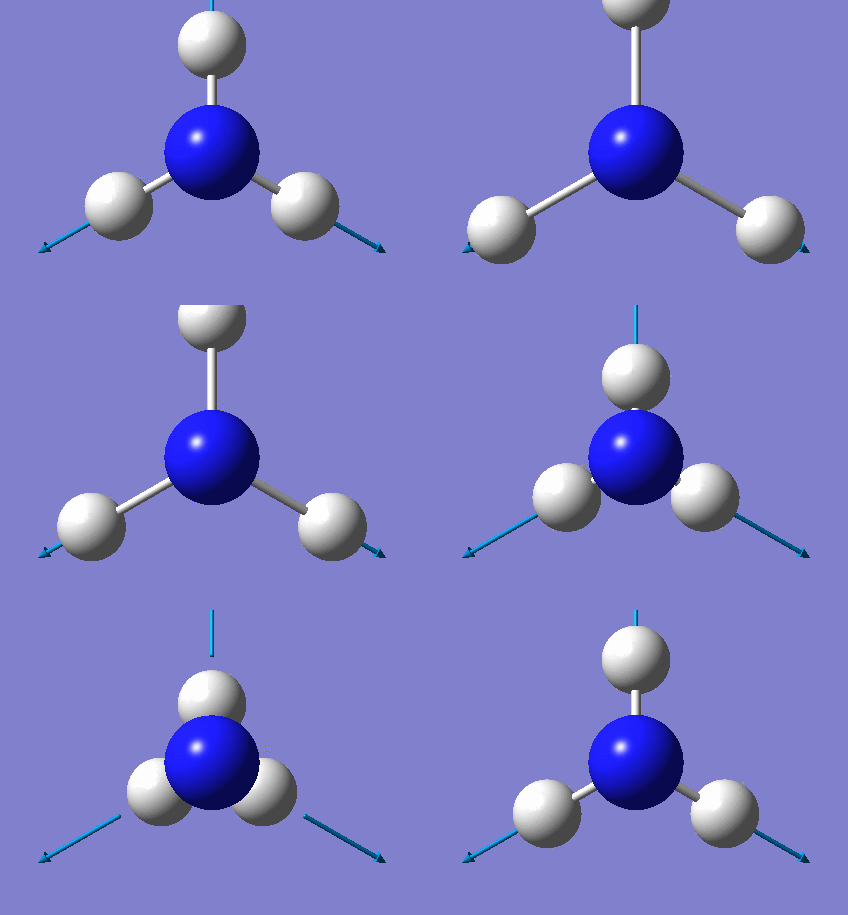 |
3461 | 1 | Very slightly | Stretch |
| 5 |  |
3590 | 0 | No | Stretch |
| 6 | 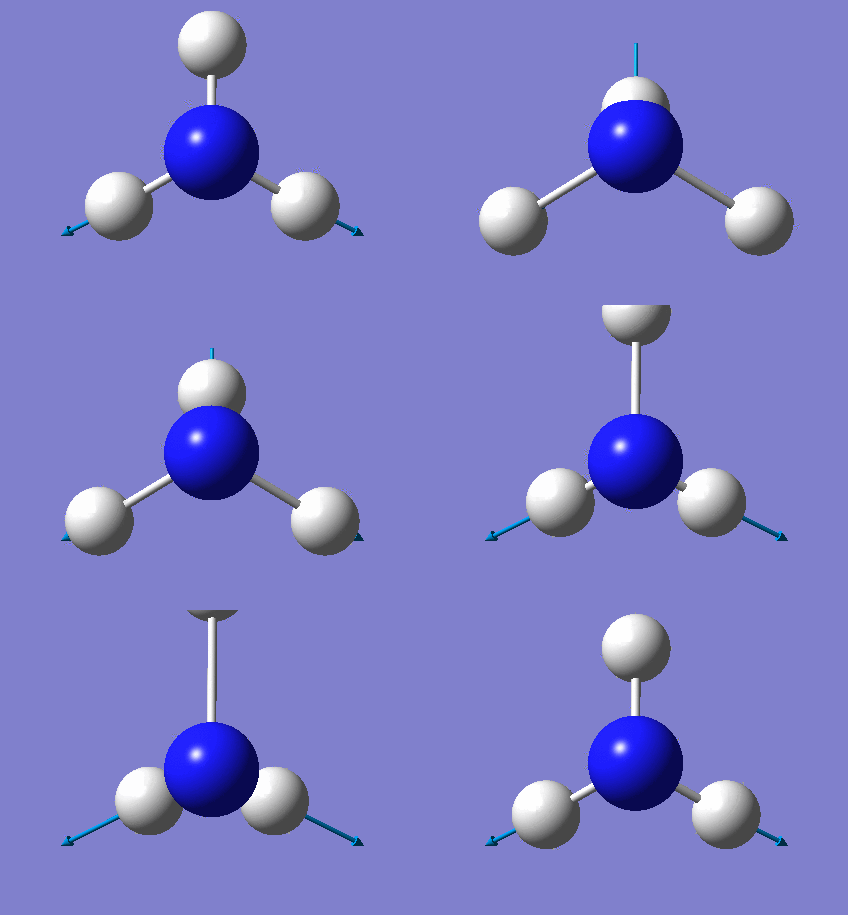 |
3590 | 0 | No | Stretch |
The six frequencies in the first column represent the value of ‘6’ in 3N-6 degree of freedom. There was no negative frequencies shown in table 17, indicating the minimum point was obtained. The energy of the optimised NH3 in table 15 is -56.5577687au while the energy of the frequency analysis is -56.5577687au. The energy are exactly the same to confirm that the structure has not been changed during the frequency analysis. However, only two peaks appear in the IR spectrum. The vibrations are degenerate when their frequencies are the same, and hence they give rise to the same IR peaks. Two vibration mode at 3590 cm-1 are IR inactive, resulting in zero intensity. It is due to no change in dipole moment.
Molecular analysis of NH3
The molecular orbitals of NH3 was done based on 6-31G basis set.The results were published on D-space DOI:10042/195260 .
| Energy | MO | Molecular Orbital Diagram |
|---|---|---|
| 1 | -14.31 | 
|
| 2 | -0.84 | 
|
| 3 | -0.45 | 
|
| 4 | -0.45 | 
|
| 5 | -0.25 | 
|
| 6 | 0.080 | 
|
| 7 | 0.17 | 
|
| 8 | 0.17 | 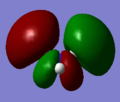
|
There are no significant differences between the real and LCAO MOs. Therefore, this proves that the qualitative MO theory for NH3 gives accurate prediction for the real MOs.
Natural Bond Orbital Analysis of NH3
NBO analysis was done using 6-31G basis set and the results can be found here Optimisation NH3 using 6-31G
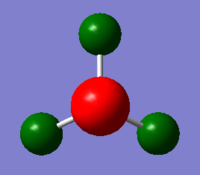
In NH3 molecule, nitrogen is more electronegative than hydrogen. Therefore, the nitrogen atom is shown as bright red on the diagram, indicating highly negative charged atom. On the other hand, the hydrogen atom is shown as bright green on the diagram, indicating highly positive charged atom. NH3 molecule is a polar molecule with the charge ranging from -1.000 to +1.000.
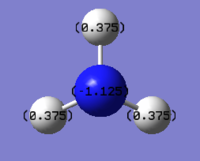
The NBO charges are shown in the diagram on top of each atom. The NBO charges for nitrogen atom is -1.125 while the NBO charges for hydrogen atom is 0.375.
Association energies: Ammonia-Borane
Optimisation of Ammonia-Borane
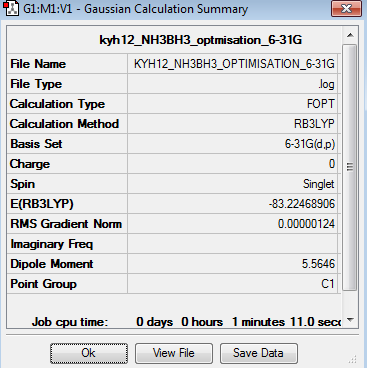
The optimisation of NH3BH3 was done using 6-31G basis set. The optimisation can be found here Optimisation NH3BH3 using 6-31G
| Summary | Convergency | Optimised Molecule | |||
|---|---|---|---|---|---|
 |
 Item               Value     Threshold  Converged?
 Maximum Force            0.000002     0.000015     YES
 RMS     Force            0.000001     0.000010     YES
 Maximum Displacement     0.000026     0.000060     YES
 RMS     Displacement     0.000009     0.000040     YES
 Predicted change in Energy=-8.958033D-11
 Optimization completed.
-- Stationary point found. |
|
The point group of the optimised NH3BH3 is C3v although it is written as C1 shown in table 18. The gradient is 0.00000124 and the table above shows that the forces and displacement are successfully converged. Therefore, it proves that the optimisation is completed.
Frequency analysis for NH3BH3
Frequency analysis represent the second derivation of the potential energy surface. The point group of this optimised NH3BH3 molecule is fixed as C3v. The frequency analysis can be found here Frequency analysis of NH3BH3
| Summary | Frequencies |
|---|---|
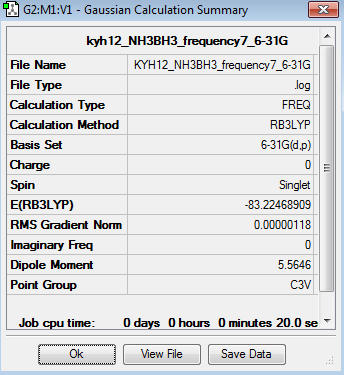 |
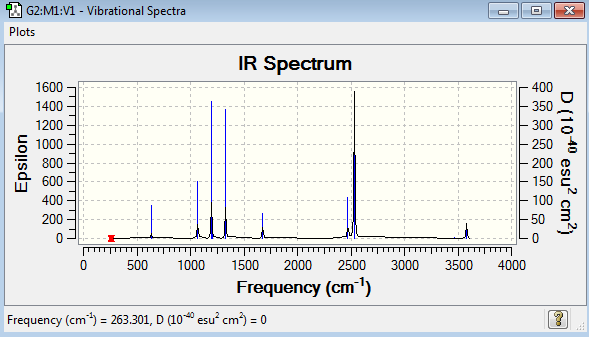
Low frequencies --- -5.1548 -0.2872 -0.0416 -0.0009 1.2956 1.3615 Low frequencies --- 263.3011 632.9615 638.4653 |
The six frequencies in the first column represent the value of ‘6’ in 3N-6, in which 3N-6 is non-linear vibrational degree of freedom. No negative frequency was reported, indicating the minimum point was obtained. The energy of the optimised NH3BH3 is -83.2246891au while the energy of the frequency analysis is -83.2246891au. The energy are close enough to confirm that the structure has not been changed during the frequency analysis.
| Mode | Wavenumber (cm-1) | Intensity | IR active? | Type |
|---|---|---|---|---|
| 1 | 263 | 0 | No | Bend |
| 2 | 633 | 14 | Very slightly | Bend |
| 3 | 639 | 4 | Very slightly | Bend |
| 4 | 639 | 4 | Very slightly | Bend |
| 5 | 1069 | 41 | Yes | Bend |
| 6 | 1069 | 41 | Yes | Bend |
| 7 | 1196 | 109 | Yes | Bend |
| 8 | 1204 | 3 | Very slightly | Bend |
| 9 | 1204 | 3 | Very slightly | Stretch |
| 10 | 1329 | 114 | Yes | Bend |
| 11 | 1676 | 28 | Very slightly | Bend |
| 12 | 1676 | 28 | Very slightly | Bend |
| 13 | 2472 | 67 | Yes | Stretch |
| 14 | 2523 | 231 | Yes | Stretch |
| 15 | 2523 | 231 | Yes | Stretch |
| 16 | 3464 | 3 | Very slightly | Stretch |
| 17 | 3581 | 28 | Very slightly | Stretch |
| 18 | 3581 | 28 | Very slightly | Stretch |
NH3BH3 molecule has 18 vibration mode, each mode has its own frequency. If two or more different vibration modes experience the same frequencies, the vibrations are degenerate. Therefore, the degenerate vibrations will give rise to a single peak as shown in the IR spectrum. This explains why there are only eight peaks in the spectrum, but not eighteen peaks. IR active requires the change in dipole moments. The vibration mode at 264 cm-1 is IR inactive with zero intensity, indicating no change in dipole moment.
Association energy calculation for NH3BH3
The reaction of NH3BH3 is:
The energies of each molecule in this reaction are shown below:
E(NH3)= -56.55776873au E(BH3)= -26.61532350au E(NH3BH3)= -83.22468906 au
The equation of the energy difference is shown below:
ΔE = E(NH3BH3)-[E(NH3)+E(BH3)]
The energy difference is -0.05159683au, which is equivalent to -135.4 kJ/mol.The N-B bond is dative covalent bond. Comparing the C-C bond with B-N bond, both bonds contain twelve electrons. The bond strength of C-C bond is 346 kJ/mol, it is assumed that the bond energy of N-B bond is weaker than C-C bond due to slightly mismatch of orbitals[8]. Since C-C is considered to be a strong bond, it is reasonable to say that B-N bond has medium bond strength.
Part 2: Mini Project - Ionic Liquids
Introduction
Ionic liquid is the salt in liquid or low melting point solid which combines the cation and anion together with desired properties. In recent years, computational chemistry has been widely used to understand the structure and properties of the molecules. In this project, the molecular structure of cations in certain ionic liquid are investigated using computational techniques.
[N(CH3)4]+
6-31G Optimisation of [N(CH3)4]+
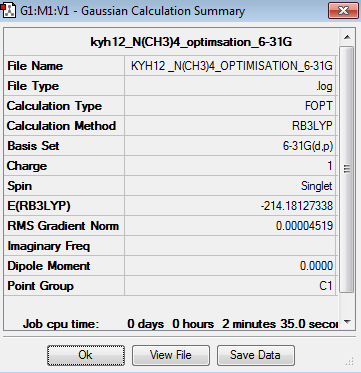
The optimisation of [N(CH3)4]+ was done using 6-31G basis set. The optimisation can be found here Optimisation [N(CH3)4]+ using 6-31G
| Summary | Convergency | Optimised Molecule | |||
|---|---|---|---|---|---|
 |
 Item               Value     Threshold  Converged?
 Maximum Force            0.000072     0.000450     YES
 RMS     Force            0.000028     0.000300     YES
 Maximum Displacement     0.000466     0.001800     YES
 RMS     Displacement     0.000159     0.001200     YES
 Predicted change in Energy=-9.711046D-08
 Optimization completed.
    -- Stationary point found.
|
|
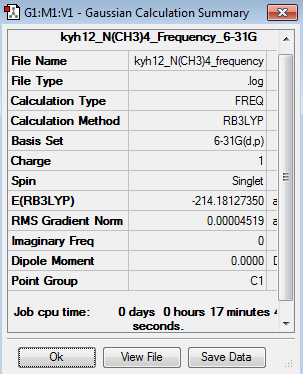
The point group of the optimised [N(CH3)4]+ is Td, not C1. The gradient is 0.00004519 which is very close to zero. Besides, the table above shows that the force and displacement are successfully converged. Therefore, both results prove that the optimisation is completed. The total energy of 6-31G optimised [N(CH3)4]+ is -214.1812734au.
6-31G Frequency Analysis of [N(CH3)4]+
The frequency analysis for [N(CH3)4]+ was recorded here. It was completed by 6-31G basis set. The frequency analysis can be found here Frequency analysis of [N(CH3)4]+ and the results were published on D-space DOI:10042/195294 .
| Summary | Frequencies |
|---|---|
 |
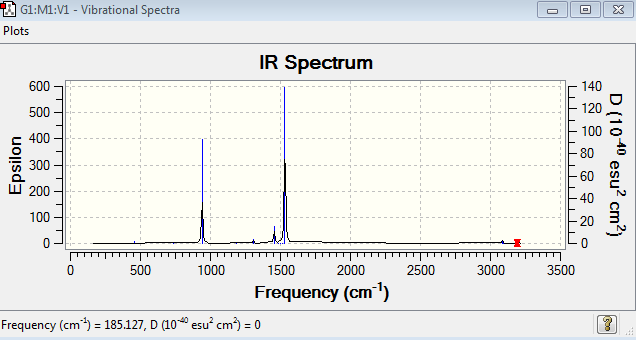
Low frequencies --- 0.0005 0.0008 0.0010 6.4033 7.3177 10.1152 Low frequencies --- 185.1279 289.7377 290.2643 |
The six low frequencies value in the first column represent the value of "6" in 3N-6, in which 3N-6 is non linear vibration degree of freedom. There are no negative frequencies shown in table 23, indicating that a minimum point is obtained. The energy obtained from optimisation is -214.1812734au , which is very close to the energy obtained from frequency analysis -214.1812735au, confirming that the structure has not been changed during the frequency analysis.
Please note that only infrared intensity larger than or equal to one is shown in table 23.
| Mode | Wavenumber (cm-1) | Intensity | Type |
|---|---|---|---|
| 11 | 940 | 22 | Bend |
| 12 | 940 | 22 | Bend |
| 13 | 940 | 22 | Bend |
| 19 | 1306 | 1 | Bend |
| 20 | 1306 | 1 | Bend |
| 21 | 1306 | 1 | Bend |
| 22 | 1455 | 5 | Bend |
| 23 | 1455 | 5 | Bend |
| 31 | 1532 | 53 | Bend |
| 32 | 1329 | 114 | Bend |
| 33 | 1532 | 53 | Bend |
| 34 | 3086 | 1 | Stretch |
| 35 | 3086 | 1 | Stretch |
| 36 | 3086 | 1 | Stretch |
[N(CH3)4]+ molecule have 45 vibration mode, each mode has its own frequency. If two or more different vibration modes experience the same frequencies, the vibrations are degenerate. Therefore, the degenerate vibrations will give rise to a single peak as shown on the IR spectrum. This explains why there are only two main peaks shown in the spectrum.
Natural Bond Orbital Analysis of [N(CH3)4]+
NBO analysis was done using 6-31G basis set. The result can be found here NBO analysis of [N(CH3)4]+ and the results were published on D-space DOI:10042/195292 .
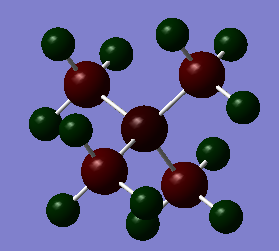
In [N(CH3)4]+, nitrogen is more electropositive than carbon. [N(CH3)4]+ molecule is a polar molecule with the charge ranging from -2.000 to +2.000.
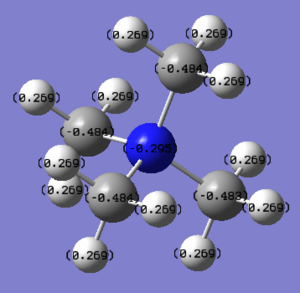
The NBO charges are shown in the diagram on top of each atom. The NBO charges for nitrogen atom is -0.295 while the NBO charges for carbon atom is -0.484.
[P(CH3)4]+
6-31G Optimisation of [P(CH3)4]+
The optimisation of [P(CH3)4]+ was done using 6-31G basis set. The optimisation can be found here Optimisation [P(CH3)4]+ using 6-31G
| Summary | Convergency | Optimised Molecule | |||
|---|---|---|---|---|---|
 |
 Item               Value     Threshold  Converged?
 Maximum Force            0.000032     0.000450     YES
 RMS     Force            0.000012     0.000300     YES
 Maximum Displacement     0.000413     0.001800     YES
 RMS     Displacement     0.000127     0.001200     YES
 Predicted change in Energy=-2.327402D-08
 Optimization completed.
    -- Stationary point found.
|
|
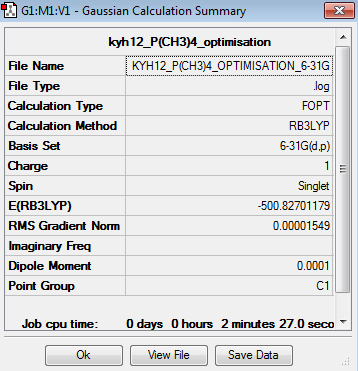
The point group of the optimised [P(CH3)4]+ is Td. The gradient is 0.00001549 which is very close to zero. Besides, the table above shows that the force and displacement are successfully converged. Therefore, both results prove that the optimisation is completed. The total energy of 6-31G optimised [P(CH3)4]+ is -500.8270118au.
6-31G Frequency Analysis of [P(CH3)4]+
The frequency analysis for [P(CH3)4]+ was recorded here. It was completed by 6-31G basis set. The frequency analysis can be found here Frequency analysis of [P(CH3)4]+ and the results were published on D-space DOI:10042/195295 .
| Summary | Frequencies |
|---|---|
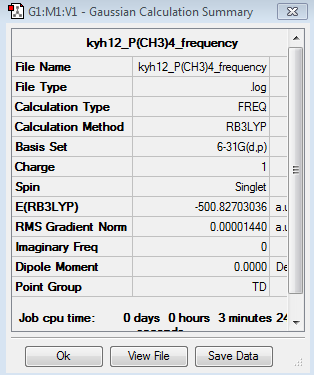 |
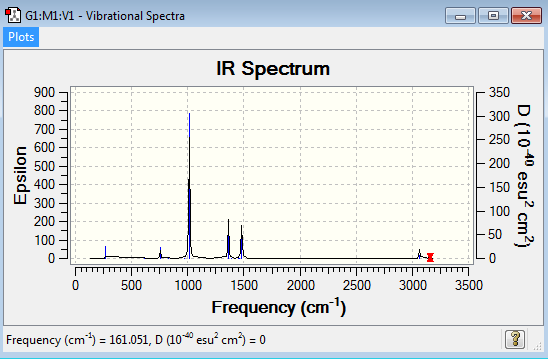
Low frequencies --- -0.0014 0.0012 0.0023 25.1857 25.1857 25.1858 Low frequencies --- 161.0510 195.5875 195.5875 |
The six low frequencies value in the first column represent the value of "6" in 3N-6, in which 3N-6 is non linear vibration degree of freedom. There are no negative frequencies shown in table 26, indicating that a minimum point is obtained. The energy obtained from optimisation is -500.8270118au , which is close enough to the energy of frequency analysis -500.8270304au, confirming that the structure has not been changed during the frequency analysis.
Please note that only infrared intensity larger than or equal to one is shown in table 26.
| Mode | Wavenumber (cm-1) | Intensity | Type |
|---|---|---|---|
| 7 | 271 | 2 | Bend |
| 8 | 271 | 2 | Bend |
| 11 | 756 | 4 | Bend |
| 12 | 756 | 4 | Bend |
| 19 | 1013 | 78 | Bend |
| 20 | 1013 | 78 | Bend |
| 21 | 1013 | 78 | Bend |
| 22 | 1362 | 21 | Bend |
| 23 | 1362 | 21 | Bend |
| 24 | 1362 | 21 | Bend |
| 31 | 1481 | 26 | Bend |
| 32 | 1481 | 26 | Bend |
| 33 | 1481 | 26 | Bend |
| 34 | 3063 | 5 | Bend |
| 35 | 3063 | 5 | Bend |
| 36 | 3063 | 5 | Bend |
| 43 | 3159 | 4 | Stretch |
| 44 | 3159 | 4 | Stretch |
| 45 | 3159 | 4 | Stretch |
[P(CH3)4]+] molecule have 45 vibration mode, each mode has its own frequency. If two or more different vibration modes experience the same frequencies, the vibrations are degenerate. Therefore, the degenerate vibrations will give a single peak as shown on the IR spectrum. This explains why there are five peaks shown in the spectrum.
Natural Bond Orbital Analysis of [P(CH3)4]+
NBO analysis was done using 6-31G basis set. The result can be found here NBO analysis of [P(CH3)4]+ and the results were published on D-space DOI:10042/195299 .
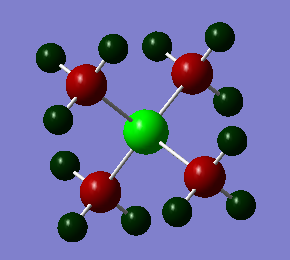
In [P(CH3)4]+, phosphorous is more electropositive than carbon and hydrogen atom, but hydrogen atom is more electropositive than carbon. [P(CH3)4]+] molecule is a polar molecule with the charge ranging from -2.000 to +2.000.
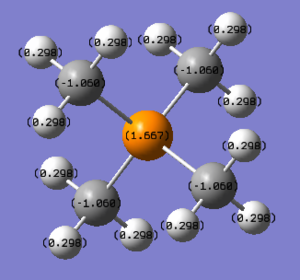
The NBO charges are shown in the diagram on top of each atom. The NBO charges for phosphorous atom is 1.667 while the NBO charges for carbon atom is -1.060.
[S(CH3)3]+
6-31G Optimisation of S(CH3)3]+
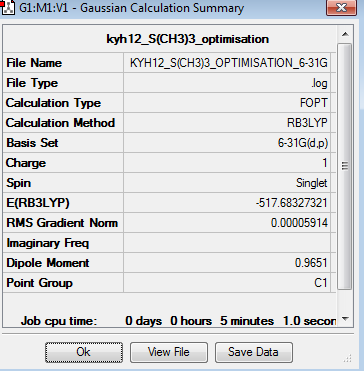
The optimisation of [S(CH3)3]+ was done using 6-31G basis set. The optimisation can be found here Optimisation [S(CH3)3]+ using 6-31G
| Summary | Convergency | Optimised Molecule | |||
|---|---|---|---|---|---|
 |
  Item               Value     Threshold  Converged?
 Maximum Force            0.000108     0.000450     YES
 RMS     Force            0.000050     0.000300     YES
 Maximum Displacement     0.001794     0.001800     YES
 RMS     Displacement     0.000704     0.001200     YES
 Predicted change in Energy=-2.873649D-07
 Optimization completed.
    -- Stationary point found.
|
|
The point group of the optimised [S(CH3)3]+ is C3v, although it indicated as C1 in table 27. The gradient is 0.00005914 which is very close to zero. Besides, the table above shows that the force and displacement are successfully converged. Therefore, both results prove that the optimisation is completed. The total energy of 6-31G optimised [S(CH3)3]+ is -517.6832732au.
6-31G Frequency Analysis of [S(CH3)3]+
The frequency analysis for [S(CH3)3]+ was recorded here. It was completed by 6-31G basis set. The frequency analysis can be found here Frequency analysis of [S(CH3)3]+ and the results were published on D-space DOI:10042/195296 .
| Summary | Frequencies |
|---|---|
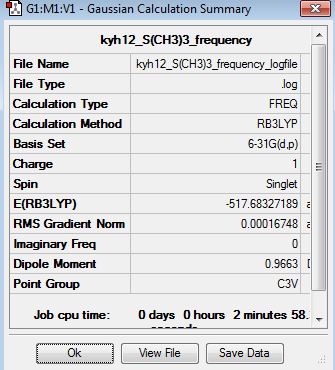 |
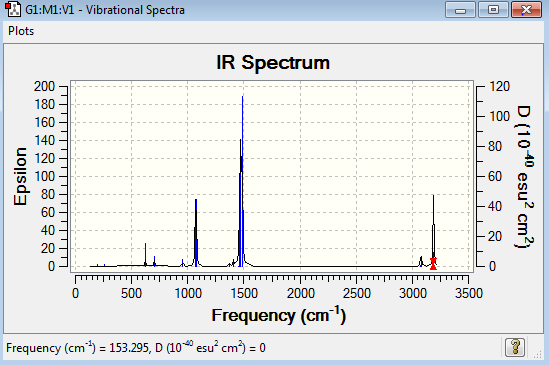
Low frequencies --- -18.2638 -18.2625 -16.5084 -0.0043 -0.0038 0.0027 Low frequencies --- 153.3109 192.8953 192.8953 |
The six low frequencies value in the first column represent the value of "6" in 3N-6, in which 3N-6 is non linear vibration degree of freedom. There are no negative frequencies shown in table 29, indicating that a minimum point is obtained. The energy obtained from optimisation is -517.6832732au , which is very close to the energy of frequency analysis -517.6832719au, confirming that the structure has not been changed during the frequency analysis.
Please note that only infrared intensity larger than or equal to one is shown in table 29.
| Mode | Wavenumber (cm-1) | Intensity | Type |
|---|---|---|---|
| 7 | 624 | 2 | Stretch |
| 8 | 704 | 1 | Stretch |
| 9 | 704 | 1 | Stretch |
| 11 | 957 | 1 | Bend |
| 12 | 957 | 1 | Bend |
| 13 | 1070 | 11 | Bend |
| 14 | 1070 | 11 | Bend |
| 15 | 1076 | 12 | Bend |
| 18 | 1407 | 2 | Bend |
| 20 | 1464 | 10 | Bend |
| 21 | 1464 | 10 | Bend |
| 22 | 1473 | 25 | Bend |
| 23 | 1473 | 25 | Bend |
| 24 | 1484 | 42 | Bend |
| 26 | 3077 | 3 | Stretch |
| 27 | 3077 | 3 | Stretch |
| 29 | 3189 | 3 | Stretch |
| 30 | 3189 | 8 | Stretch |
| 31 | 3189 | 8 | Stretch |
| 32 | 3190 | 3 | Stretch |
| 33 | 3190 | 3 | Stretch |
[S(CH3)3]+ molecule have 33 vibration mode, each mode has its own frequency. If two or more different vibration modes experience the same frequencies, the vibrations are degenerate. Therefore, the degenerate vibrations will give a single peak as shown on the IR spectrum. This explains why there are only seven peaks shown in the spectrum.
Natural Bond Orbital Analysis of [S(CH3)3]+
NBO analysis was done using 6-31G basis set. The result can be found here NBO analysis of [S(CH3)3]+ and the results were published on D-space DOI:10042/195297 .
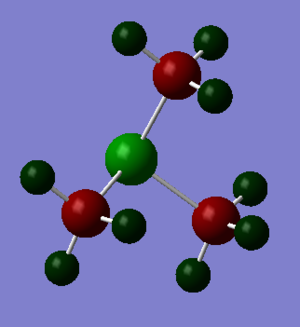
In [S(CH3)3]+, sulphur is more electropositive than carbon and hydrogen atom, but hydrogen atom is more electropositive than carbon. [S(CH3)3] molecule is a polar molecule with the charge ranging from -2.000 to +2.000.

The NBO charges are shown in the diagram on top of each atom. The NBO charges for sulphur atom is 0.917 while the NBO charges for carbon atom is -0.846.
Result and discussion on the geometries with respect to the central heteroatom
| Molecule | Bond Length (Å) | Bond Length (Å) | Bond Angle (o) | Bond Angle (o) | Bond Angle (o) |
|---|---|---|---|---|---|
| [N(CH3)4]+ | 1.51 | 1.09 | 109.5 | 108.9 | 110.0 |
| [P(CH3)4]+ | 1.82(1.81641) | 1.09 | 109.5 | 109.9 | 109.0 |
| [S(CH3)3]+ | 1.82(1.82237) | 1.09 | 102.8 | 107.3 | 111.1 |
The point group of [N(CH3)4]+ should be tetrahedral, although the optimisation and frequency calculations show that it adopt C1 geometry. Besides, [P(CH3)4]+ adopts tetrahedral geometry as well. Both of them contain four identical methyl group which they are organised to give the most stable structure. Each carbon on the methyl group adopt tetrahedral structure with the bond angle very close to 109o, indicating that the minimum energy of the whole molecules are obtained. The bond length of N-C and P-N bonds are 1.51 Å and 1.82 Å respectively. The results show that N-C bond is shorter than P-C bond, resulting in stronger N-C bond than P-C bond. The electronegativity of C, N, P are 5.13, 6.97, 5.01 respectively, showing that N-C bond has larger electronegative difference than P-C bond[6]. Larger electronegative differences between the atom means that the bond is more polar, resulting in stronger bond. Hence, N-C bond is stronger than P-C bond. Moreover, N-C bond has better orbital overlap than P-C bond, generating stronger MO interaction. The outershell orbital of P is 3p while the outershell orbital of N is 2p, 3p orbital of P has poor orbital overlap with 2p orbital of C due to the mismatch of orbital size, resulting in weakening the bond. Furthermore, the size of P atom is larger than N atom and hence P atom try to push away from methyl group to reduce steric hinderance. This results in the increase in P-C bond comparing with N-C bond.
The point of [S(CH3)3]+ is C3v, which adopts a trigonal pyramidal geometry. The lone pair of electrons on S atom try to push the methyl group further away from itself to reduce the steric repulsion, resulting in 102.8o. Two different angles were observed at S-C-H bond and H-C-H bond. In all the methyl group, one C-H bond is pointing away from the S atom while two C-H bonds are pointing towards the S atom. The C-H bond away from S atom generate larger bond angle, which gives 110.5oand 111.1o for S-C-H bond and H-C-H bond respectively. The two upward C-H bond experience steric clashing with the lone pair of electrons on sulphur, resulting in smaller H-C-H bond angle. The electronegative of S atom is 6.52[6], which indicate that S-C bond has larger electronegative difference than P-C bond. Hence, S-C bond is more polar and stronger than P-C bond. On the other hand, S-C bond has poor orbital overlap comparing with N-C bond. Hence, C-S bond is weaker and shorter than S-C bond. The bond energy of N-C, P-C and S-C bond are 305, 264 and 272 kJ/mol reported in the literature [8], which agrees with the computational results above.
The bond length of C-H bond in the three molecules gives the same result, meaning that the change in central atom does not affect the change in C-H bond length. To conclude, the change in central atom will affect the structure of the whole molecule and the bond strength between the ligand and the central atom.
Annotate the molecular orbital diagram of [N(CH3)4]+
MO 6: Strong bonding orbital
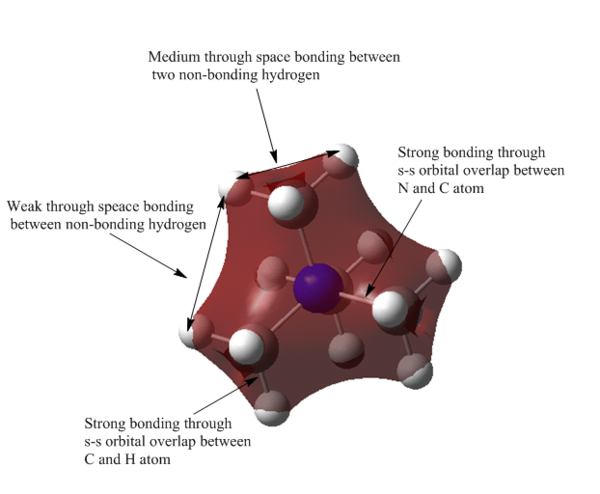
MO 6 is overall strongly bonding MO. There are no nodes nor nodal planes shown in the diagram. This MO is the first non-core MO of [N(CH3)4]+. The whole molecule experiences the same electronic environment, which may due to the nitrogen atom spreading its charged density around the whole molecule and polarised the methyl group. Hence, the overall positive charged of the molecules are delocalised within the structure.
MO 10: Medium bonding orbital

M0 10 represents medium bonding MO. There are four nodes and four nodal planes shown in the diagram. The four methyl group are weak through space bonding. However, within a methyl group, the non-bonded H atom experiences medium through space bonding. The AOs of hydrogen atoms are delocalised over four atoms, indicating the strong s-s bonding interaction between C and H atom. The orbital of N is weakly anti-bonding with C atom on methyl group. The size of this MO is larger than MO 6 due to the anti-bonding interaction between the centre N atom and the three methyl group.
MO 13: Weak bonding orbital

MO 13 represents weak bonding MO. It is triply degenerate with four nodes shown in the diagram. Only parts of the methyl group is bonded with N atom, other C-N bonds experience medium anti-bonding interaction. The bottom and the top H atoms from the methyl group create two anti-bonding electrostatic environment with N atom, resulting in two red region. Within each red region, there are medium through space bonding between the H atoms. To conclude, MO 13 is more anti-bonding and delocalised than MO 10, but MO 13 has some strong through space bonding overlap, resulting in overall weak bonding MO.
MO 15: Weak anti-bonding orbital
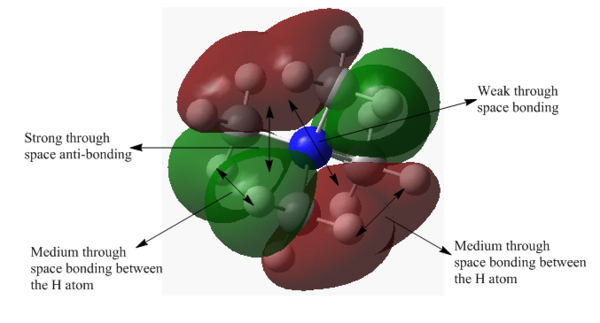
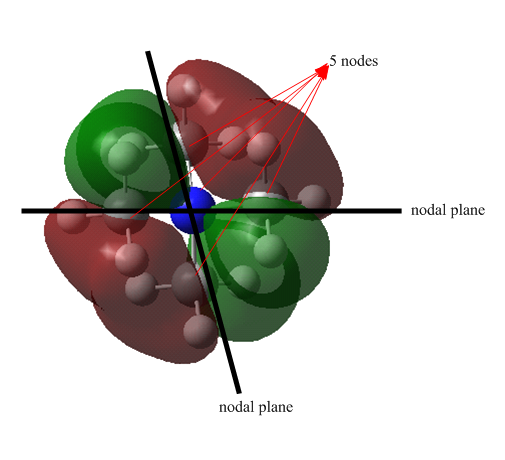
MO 15 represents weak anti-bonding MO. It is doubly degenerate with five nodes and two nodal plane shown in the diagram. There are four lobes localised around the methyl group, the C p-orbitals are orientated in such a way that the wavefunction cancels out each other. Despite there are medium through space bonding within each lobe, the strong space anti-bonding overrides the bonding interaction, resulting in overall weak anti-bonding MO. MO 15 has more anti-bonding through space interaction and delocalised than MO 13, giving higher energy MO.
MO 15: Strong anti-bonding orbital

MO represents strong anti-bonding MO. It is triply degenerate with five nodes and 3 nodal planes shown in the diagram. Although there are some weakly through space bonding interaction between the H atoms, the strong through space anti-bonding interaction repel strongly between the overlap of N and C atoms as well as C and H atoms, resulting in overall strong anti-bonding MO. MO 21 is the most strongly anti-bonding MO and delocalised comparing with MO 6, 10, 13 and 15, which is due to strong repulsion between different phase of wavefunctions.
Analyse the charge distribution of [A(CH3)B]+
| Molecule | Charge on A | Charge on carbon atom | Charge on hydrogen atom |
|---|---|---|---|
| [N(CH3)4]+ | -0.295 | -0.484 | 0.269 |
| [P(CH3)4]+ | 1.667 | -1.060 | 0.298 |
| [S(CH3)3]+ | 0.917 | -0.846 | 0.297, 0.279 |
According to the literature, N (6.97) and S (6.52) atoms are more electronegative than C atom (5.13) [6]. However, these values do not match with the results in table 30, in which the C atom is more negatively charged than N and S atoms. This may be induced by the three highly positive charged H atoms from the methyl group, which the electrons are drawn towards the C from H, resulting in highly negative charged C. As a conclusion, the C atoms are more negatively charged than the central atom for all molecules. The more electropositive the central atom is, the more negative charged the C atom is. The A-C bond experiences larger charge difference, which generates more polar A-C bond and exerts high electron density along the A-C bond with strong electrostatic attraction.
The H atoms in [S(CH3)3]+ molecule have different orientation relative to the S atom. Hence, there are two different charges on the H atoms. The H atoms which are closer to the lone pair of electrons of S atom, will experience higher positive charge to compensate the steric repulsion of the lone pair of electrons. Therefore, six H atoms pointing upwards (0.297) are more highly charged than the three H atoms pointing downwards (0.279).
The H atoms in all cations are more positively charged than the C and central atoms. The more electropositive the H atom is, the more negative charged the C atom is and hence, less negative charged the central atom will be. To conclude, the charge on the C and H atoms are greatly depended on the charged of the central atom. The more electronegative central atom induces more electropositive C atom and hence less electropositive H atom.
Relative contribution of the C and heteroatom to the C-A bond
| Molecule | Contribution from A | Hybridisation of A orbital | Contribution from C | Hybridisation of C orbital |
|---|---|---|---|---|
| [N(CH3)4]+ | 66% | 25% s + 75% p | 34% | 21% s + 79% p |
| [P(CH3)4]+ | 40% | 25% s + 74% p + 1% d | 60% | 25% s + 75% p |
| [S(CH3)3]+ | 51% | 17% s + 82% p + 1% d | 49% | 20% s + 80% p |
The orbitals of N and C atom are sp3 hybridised, it is predicted that the orbital of P and S are sp3 hybridised as well. However, the results in table 31 show that their orbitals involve 1% of d hybridisation. It is because the 3d orbitals of P and S are very close to 3d orbitals, resulting in small contribution of d orbitals in the hybridisation.
According to the results, more electronegative atom has larger contribution to the C-A bond. The more electronegative atom will pull the electron density towards itself and induce a large electron cloud around it. As mention above, N and S atoms are more electronegative than C atom. Hence, N and C contribute more to the C-A bond with higher percentage value. However, P atom is more electropositive than C atom, resulting in less contribution to the P-C bond. Moreover, in the MO diagram, lower energy can be obtained by more electronegative atom. Therefore, the molecule try to rearrange themselves to obtain the lowest energy confirmation. In this situation, the electronegative N and S atom will contribute more to the A-C bond in order to minimise the energy.
Unfortunately, the explanation above does not agree with the charge distribution shown in table 30. The results in table 30 show that C atom is more negatively charged than the central atom. This is because the charge of C involves the contribution of H atom as well as the central atom. However, the discussion above only involves the contribution of C and central atom in the cation, the contribution of H atom is not taken into account. Besides, there are limitation of basis set and method regarding to the calculation of charge distribution. Therefore, the relative contribution of C and A in A-C bond does not match with the result of charge distribution.
Validity of the traditional description of [NR4]+
The definition of formal charge is the charge on the atom or molecule, in which both atom have the same contribution to the bond regardless of their electronegativity[9]. This equation below shows the calculation of formal charge.

According to this equation, N atom in [NR4]+ has 7 valence electrons, 2 lone pair of electrons and 4 electrons shared in the covalent bond. Therefore, the formal charge of [NR4]+ is equal to 7-(2+4), which is +1 positive charged.
Although the calculation shows that N atom carries the positive charges, this is not accurate. The positive charge is spread over the whole cation, it is impossible to locate exactly where the positive charge is.
Part 2: Mini Project - Influence of functional group
[N(CH3)3(CH2)OH]+
6-31G Optimisation of [N(CH3)3(CH2)OH]+
The optimisation of [N(CH3)3(CH2)OH]+ was done using 6-31G basis set. The optimisation can be found here Optimisation [N(CH3)3(CH2)OH]+ using 6-31G
| Summary | Convergency | Optimised Molecule | |||
|---|---|---|---|---|---|
 |
 Item               Value     Threshold  Converged?
 Maximum Force            0.000001     0.000015     YES
 RMS     Force            0.000000     0.000010     YES
 Maximum Displacement     0.000013     0.000060     YES
 RMS     Displacement     0.000004     0.000040     YES
 Predicted change in Energy=-6.329230D-12
 Optimization completed.
    -- Stationary point found.
|
|
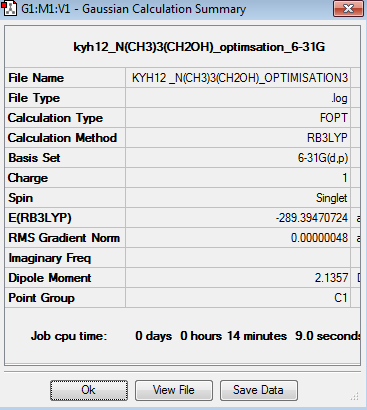
The point group of the optimised [N(CH3)3(CH2)OH]+ is C1. The gradient is 0.00000048 which is very close to zero. Besides, the table above shows that the force and displacement are successfully converged. Therefore, both results prove that the optimisation is completed. The total energy of 6-31G optimised [N(CH3)3(CH2)OH]+ is -289.3947072au. The angle of C-O-H should be around 111.4o and the bond length of O-H bond is around 0.97Å. Otherwise, it requires multiply calculation in order to obtain the optimised structure.
6-31G Frequency Analysis of [N(CH3)3(CH2)OH]+
The frequency analysis for [N(CH3)3(CH2)OH]+ was recorded here. It was completed by 6-31G basis set. The frequency analysis can be found here Frequency analysis of [N(CH3)3(CH2)OH]+ and the results were published on D-space DOI:10042/195316 .
| Summary | Frequencies |
|---|---|
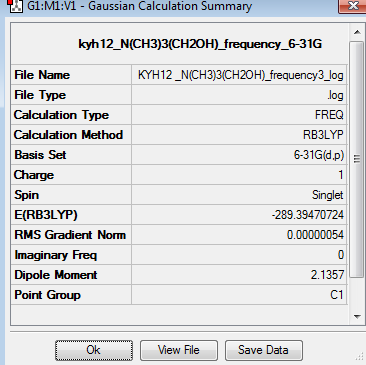 |
Low frequencies --- -8.4547 -5.0213 -0.9870 -0.0008 0.0010 0.0010 Low frequencies --- 131.1069 213.4697 255.7141 |
The six low frequencies value in the first column represent the value of "6" in 3N-6, in which 3N-6 is non linear vibration degree of freedom. There are no negative frequencies shown in table 34, indicating that a minimum point is obtained. The energy obtained from optimisation is -289.3947072au , which is same as the energy obtained from frequency analysis -289.3947072au, confirming that the structure has not been changed during the frequency analysis.
Please note that only infrared intensity larger than or equal to ten is shown in table 34.
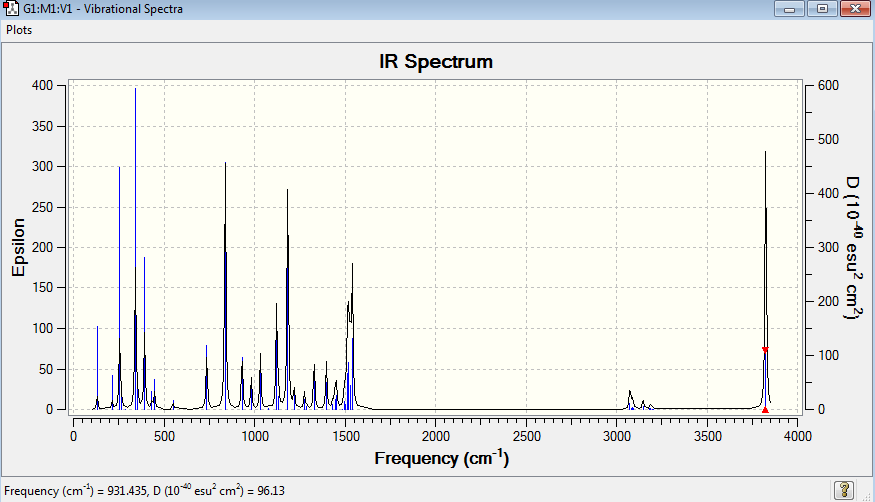
| Mode | Wavenumber (cm-1) | Intensity | Type |
|---|---|---|---|
| 3 | 255 | 29 | Bend |
| 6 | 342 | 51 | Bend |
| 8 | 393 | 28 | Bend |
| 12 | 736 | 22 | Stretch |
| 13 | 839 | 96 | Bend |
| 14 | 931 | 22 | Bend |
| 15 | 982 | 12 | Bend |
| 16 | 1033 | 20 | Bend |
| 18 | 1122 | 38 | Bend |
| 20 | 1184 | 91 | Stretch |
| 24 | 1330 | 19 | Bend |
| 33 | 1514 | 26 | Bend |
| 34 | 1521 | 33 | Bend |
| 36 | 1540 | 51 | Bend |
| 48 | 3825 | 105 | Stretch |
[N(CH3)3(CH2)OH]+ molecule have 48 vibration mode, each mode has its own frequency. If two or more different vibration modes experience the same frequencies, the vibrations are degenerate. Therefore, the degenerate vibrations will give rise to a single peak as shown on the IR spectrum. This explains that the number of peaks shown in the IR spectrum does not match with the number of IR vibrational mode.
Natural Bond Orbital Analysis of [N(CH3)3(CH2)OH]+
NBO analysis was done using 6-31G basis set. The result can be found here NBO analysis of [N(CH3)3(CH2)OH]+ and the results were published on D-space DOI:10042/195319 .
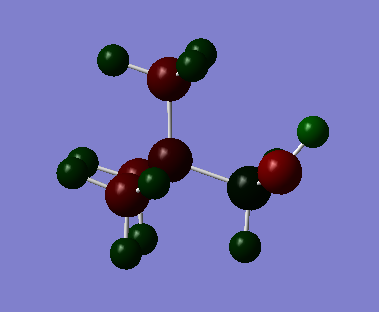
In [N(CH3)3(CH2)OH]+, nitrogen and oxygen atoms are more electronegative than carbon atom. [N(CH3)3(CH2)OH]+ molecule is a polar molecule with the charge ranging from -2.000 to +2.000.
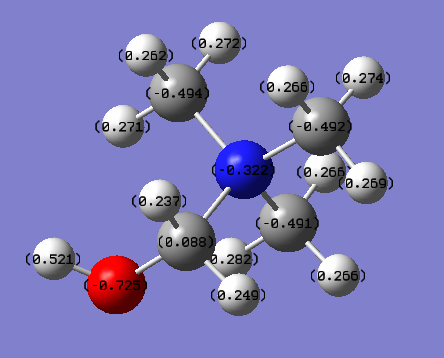
The NBO charges are shown in the diagram on top of each atom. The NBO charges for nitrogen and oxygen atoms are -0.322 and -0.725 respectively.
[N(CH3)3(CH2)CN]+
6-31G Optimisation of [N(CH3)3(CH2)CN]+
The optimisation of [N(CH3)3(CH2)CN]+ was done using 6-31G basis set. The optimisation can be found here Optimisation [N(CH3)3(CH2)CN]+ using 6-31G
| Summary | Convergency | Optimised Molecule | |||
|---|---|---|---|---|---|
 |
 Item               Value     Threshold  Converged?
 Maximum Force            0.000000     0.000015     YES
 RMS     Force            0.000000     0.000010     YES
 Maximum Displacement     0.000002     0.000060     YES
 RMS     Displacement     0.000001     0.000040     YES
 Predicted change in Energy=-6.202981D-13
 Optimization completed.
    -- Stationary point found.
|
|
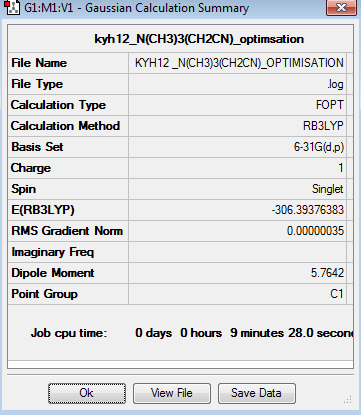
The point group of the optimised [N(CH3)3(CH2)CN]+ is C1. The gradient is 0.00000035 which is very close to zero. Besides, the table above shows that the force and displacement are successfully converged. Therefore, both results prove that the optimisation is completed. The total energy of 6-31G optimised [N(CH3)3(CH2)CN]+ is -306.3937638au. The angle of C-CN is around 178.8o and the bond length of C-C bond in C-CN is around 1.46Å.
6-31G Frequency Analysis of [N(CH3)3(CH2)CN]+
The frequency analysis for [N(CH3)3(CH2)CN]+ was recorded here. It was completed by 6-31G basis set. The frequency analysis can be found here Frequency analysis of [N(CH3)3(CH2)CN]+ and the results were published on D-space DOI:10042/195318 .
| Summary | Frequencies |
|---|---|
 |
Low frequencies --- -2.6246 0.0003 0.0007 0.0008 7.1467 9.6708 Low frequencies --- 91.7740 154.0283 210.9278 |
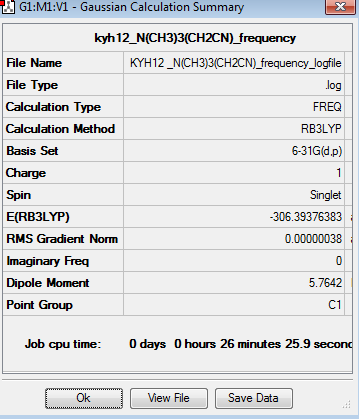
The six low frequencies value in the first column represent the value of "6" in 3N-6, in which 3N-6 is non linear vibration degree of freedom. There are no negative frequencies shown in table 37, indicating that a minimum point is obtained. The energy obtained from optimisation is -306.3937638au , which is same as the energy obtained from frequency analysis -306.3937638au, confirming that the structure has not been changed during the frequency analysis.
Please note that only infrared intensity larger than or equal to ten is shown in table 37.
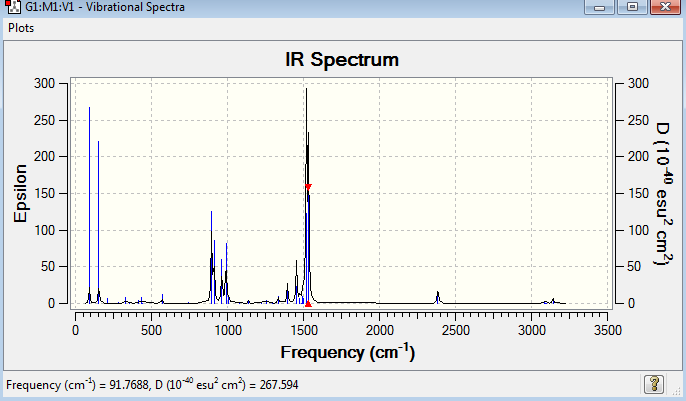
| Mode | Wavenumber (cm-1) | Intensity | Type |
|---|---|---|---|
| 14 | 895 | 28 | Bend |
| 15 | 912 | 20 | Bend |
| 16 | 963 | 14 | Bend |
| 17 | 990 | 20 | Bend |
| 34 | 1519 | 34 | Bend |
| 35 | 1520 | 47 | Bend |
| 36 | 1533 | 61 | Bend |
[N(CH3)3(CH2)CN]+ molecule have 48 vibration mode, each mode has its own frequency. If two or more different vibration modes experience the same frequencies, the vibrations are degenerate. Therefore, the degenerate vibrations will give rise to a single peak as shown on the IR spectrum. This explains that the number of peaks shown in the IR spectrum does not match with the number of IR vibrational mode.
Natural Bond Orbital Analysis of [N(CH3)3(CH2)CN]+
NBO analysis was done using 6-31G basis set. The result can be found here NBO analysis of [N(CH3)3(CH2)CN]+ and the results were published on D-space DOI:10042/195319 .
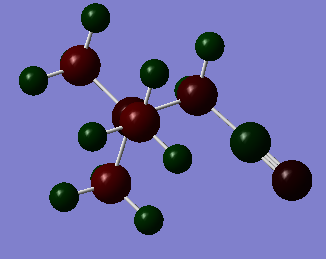
[N(CH3)3(CH2)OH]+ molecule is a polar molecule with the charge ranging from -2.000 to +2.000.
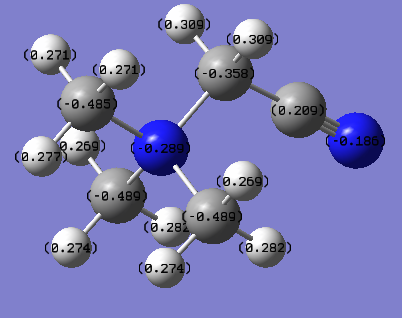
The NBO charges are shown in the diagram on top of each atom. The NBO charges for nitrogen and carbon atoms of cyanide are -0.186 and 0.209 respectively.
Compare the charge distribution between [N(CH3)3(CH2)CN]+, [N(CH3)3(CH2)OH]+ and [N(CH3)4]+
| Molecule | Charge on nitrogen atom | Charge on carbon atom | Charge on oxygen atom | Charge on hydrogen atom |
|---|---|---|---|---|
| [N(CH3)4]+ | -0.295 | -0.484 | N/A | 0.269 |
| [N(CH3)3(CH2)CN]+ | -0.289 (central N), -0.185 CN | -0.358, -0.485, -0.489 (methylene C and methyl C); 0.209 CN | N/A | 0.269-0.282 CH3; 0.309 CH2CN |
| [N(CH3)3(CH2)OH]+ | -0.322 | 0.088 C-OH; -0.491 CH3 | -0.725 | 0.262-0.282 CH3; 0.237, 0.249 NCH2OH; 0.521 CH2OH |
OH is the electron donating group while CN is the electron withdrawing group, these functional groups will strongly affect the charge distribution in the molecule.
For [N(CH3)3(CH2)CN]+ molecule, due to the electron withdrawing property of CN group, it pulls the electrons away from the methylene carbon as well as the central N atom. Therefore, the charges on N and C atoms have decreased compared to [N(CH3)4]+ molecule. The H atom in methylene group has higher positive charge than the H atom in methyl groups. It explains that the further the H atom relative to CN group, the lower the charge of H is. The central N atom experiences higher negative charged than the N atom in CN group, it is due to three methyl group attached to central N atom, pushing the electron density towards the centre and increase the negative charge on N atom.
For [N(CH3)3(CH2)OH]+ molecule, the OH group pushes the electron density towards the methylene carbon as well as the central nitrogen atom. Hence, N and C atoms become more negatively charged compared to [N(CH3)4]+ molecule. The H atom in OH group has the highest charge among the whole molecule, it is because the O atom withdraws the electrons away from the H atom and donate to the central atom. Therefore, the H atom in OH group is much more electropositive than the H atom in the methyl groups. The H atoms of the methylene group (next to the OH group) is less positively charged than the methyl group. Apart from the H atom in the OH group, the further the H atom relative to the OH group, the higher the positive charge of the H atom is.
The electronegative of N, C and O atoms are 6.97, 5.13 and 8.92 respectively[6]. For [N(CH3)3(CH2)OH]+ molecule, O and N atoms are more electronegative than C atom. Hence, N and O atom carries higher negative charged than C. On the other hand, for [N(CH3)3(CH2)CN]+ molecule, N atom in C≡N is more electronegative than C atom and hence it is more negatively charged.
Compare and contrast the HOMO and LUMO of [N(CH3)3(CH2)CN]+, [N(CH3)3(CH2)OH]+ and [N(CH3)4]+
| [N(CH3)4]+ | [N(CH3)3(CH2)OH]+ | [N(CH3)3(CH2)CN]+ | |
|---|---|---|---|
| LUMO | 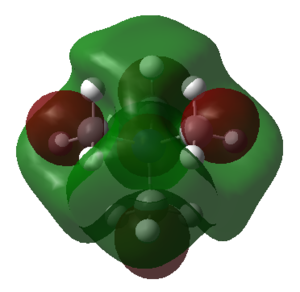 |
 |
 |
| HOMO |  |
 |
 |
| Molecule | HOMO (Hartree) | LUMO (Hartree) | Energy difference between HOMO and LUMO (Hartree) | Energy difference between HOMO and LUMO (kJ/mol) |
|---|---|---|---|---|
| [N(CH3)4]+ | -0.57934 | -0.13302 | 0.44632 | 1171.8 |
| [N(CH3)3(CH2)ON]+ | -0.48763 | -0.12459 | 0.36304 | 953.2 |
| [N(CH3)3(CH2)CN]+ | -0.50047 | -0.18183 | 0.31864 | 836.6 |
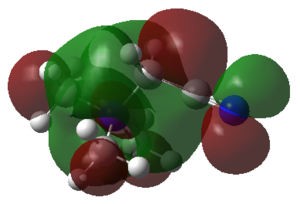
The HOMO of [N(CH3)4]+ is triply degenerate, but the orbital diagram is slightly different between them. Only one of the HOMO orbital diagrams of [N(CH3)4]+ is shown in table 39. For [N(CH3)3(CH2)OH]+ molecule, OH is the electron donating group. It is expected that there are higher electron density around the OH region comparing to other parts of the molecule. The sp3 orbital of C overlap with the sp3 orbital of O, while the sp3 orbital of O overlap with the s orbital of H. According to the MO diagram in table 39, C and O are anti-bonding with sp3 hybridised orbitals, but the (methylene)C-H and O-H are bonded with the overlap of sp3 and s orbitals. For [N(CH3)3(CH2)OH]+ molecule, the distribution of electron density is only shown around CN region. CN is a strong electron withdrawing group, which pulls electrons of the whole molecules towards itself. The HOMO of [N(CH3)3(CH2)OH]+ reflects the 1π orbitals in MO diagram, resulting in anti-bonding region. To conclude, the HOMO of [N(CH3)4]+ is more delocalised than [N(CH3)3(CH2)CN]+ and [N(CH3)3(CH2)OH]+ due to the non-existence of electron withdrawing or electron donating group in the molecule.
The LUMO of [N(CH3)3(CH2)CN]+ is the most contracted orbital, probably due to CN electron withdrawing property. Comparing it with [N(CH3)4]+, [N(CH3)4]+ has larger electron density around the central atom. However, for [N(CH3)3(CH2)CN]+ molecule, the OH group donates electrons towards the methylene group as well as the central atom. Hence, it has large spread of electron density in the middle region of the molecule, but not as much as [N(CH3)4]+.
The HOMO orbitals of [N(CH3)3(CH2)CN]+ and [N(CH3)3(CH2)OH]+ has higher energy than the HOMO orbitals of [N(CH3)4]+. On the other hand, the LUMO orbitals of [N(CH3)3(CH2)CN]+ has lower energy than the LUMO orbitals of [N(CH3)4]+. It is important to note that it is not accurate to compare the exact value of the HOMO and LUMO energy of the molecule, because the level of theory is not accurate enough to make meaningful comparison. Therefore, only the energy gap between the HOMO and LUMO is discussed in here. The OH group in [N(CH3)3(CH2)OH]+ molecule wants to donate electrons and hence it raises the HOMO energy compare to [N(CH3)4]+. On the other hand, the CN group in [N(CH3)3(CH2)CN]+ has electron withdrawing property, which lowers the LUMO comparing to [N(CH3)4]+. In an other words, [N(CH3)3(CH2)OH]+ has the lowest LUMO among the three molecules, it is more likely to have nucleophile attack. Besides, [N(CH3)3(CH2)OH]+ has the highest HOMO among the three molecules, meaning that it has the highest probability to have electrophilic attack.
Due to the electron withdrawing property of CN and the electron donating property of OH, the HOMO-LUMO gap of [N(CH3)3(CH2)CN]+ and [N(CH3)3(CH2)OH]+ are smaller than [N(CH3)4]+. Smaller HOMO-LUMO gaps allow electrons to transfer easily between them and have strong interaction. Hence, [N(CH3)3(CH2)CN]+ and [N(CH3)3(CH2)OH]+ is more feasible to have photo-excitation or thermal excitation than [N(CH3)4]+. Moreover, smaller HOMO-LUMO gap is more conjugated molecules and allow the emission of visible light. In organic point of view, small HOMO-LUMO gaps allows the donar-acceptor coupling in the molecule[11]. Therefore, it is very useful to minimise the HOMO-LUMO gap.
| [N(CH3)4]+ | [N(CH3)3(CH2)OH]+ | [N(CH3)3(CH2)CN]+ | |
|---|---|---|---|
| LUMO |  |
 |
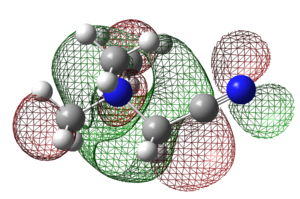 |
These orbital diagram gives a closer look at the orbital contribution of each atom, resulting in better understand of the LUMO of the three molecules.
References
- ↑ 1.0 1.1 K. Kawaguchi , J. Chem. Phys., 1992, 96, 3411
- ↑ 2.0 2.1 D. Oxtoby, H. Gillis and A. Campion , Principles of Modern Chemistry, 2011, 274
- ↑ C. Da Silva, O. Proux, J-L. Hazemann, J. James-Smith, D. Testemale and T. Yamaguchi , J. Mol. Liq., 2008, 147, 83-95.
- ↑ C. Aubauer, E. Irran, T. M. Klapo1tke, W. Schnick, A. Schulz, and Ju1rgen Senker , Inorg. Chem, 2001, 40, 4965-4965.
- ↑ G. Santiso-Quinones and I. Krossing, Z. Anorg. Allg. Chem., 2008, 634, 704-707.
- ↑ 6.0 6.1 6.2 6.3 6.4 L.J. Bartolotti, S. R. Cadre and R. G. Parr. J. Am. Chem. Soc. , 1980, 102, 2945-2948
- ↑ B. deB. Darwent, Bond Dissociation Energies in Simple Molecules , NSRDS, 1970.
- ↑ 8.0 8.1 8.2 8.3 T.L. Cottrell, The Strengths of Chemical Bonds , Butterworths, 1958. Cite error: Invalid
<ref>tag; name "Cottrell" defined multiple times with different content - ↑ 9.0 9.1 9.2 P. Atkins and J. de Paula, Atkins' Physical Chemistry, Oxford University Press, 2009, 9.
- ↑ J. W. Ochterski, Vibrational Analysis in Gaussian, 1999.
- ↑ D. F. Perepichka and M. R. Bryce. Angew. Chem . Int. Ed , 2005, 44, 5370-5373

