Rep:Mod:hjw13MgO
MgO Experiment Harry Wilkinson
Introduction
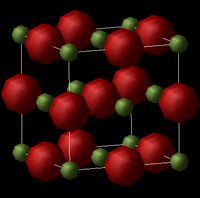
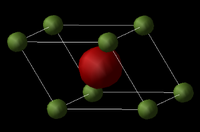
This experiment uses General Utility Lattice Program (GULP) to simulate the vibrational (phonon) modes of a Magnesium Oxide (MgO) lattice. It then uses the Quasi Harmonic approximation and molecular dynamics to model its thermal expansion, allowing a comparison of the two methods. The criteria used to compare the methods will be their changes of lattice constant and free energy, then calculating the thermal expansion coefficient.
Magnesium Oxide was selected for this experiment due to its crystal structure. The conventional cell of MgO (Figure 1) adopts an FCC (Face-Centered Cubic) crystal structure, as a consequence of this, the geometry of the unit cell can be described entirely by one value, the lattice constant, which is the length of each of the sides of the primitive cell. This allows for easy calculation of the unit cell volume, and consequently, the thermal expansion.
Reciprocal Space
All of the calculations in this experiment are done on a reciprocal lattice in reciprocal space (also known as k space). The reciprocal lattice is the Fourier Transformation of the direct lattice in real space. This model is used for a variety of reasons, primarily in this case due to the fact that every crystal vibration has an associated k vector in k space that gives the directionality and wavelength of the vibration.[1]
K Vectors
As well as its use in k space, a k vector is the wave vector of a periodic lattice's vibrational energy levels.
A 1D chain of atoms with a spacing 'a' can be represented by a vibrational wave function (analogous to an electronic wave function) of the form: . where k is the wave vector, n is the number of lattice points in sequence, and Χ is the basis function of each lattice point (cf a Hydrogen 1s orbital).
Considering that:, when λ = 2a, k = π/a making:
This displays that the relative motion of each lattice point is out-of-phase with its neighbors, producing the highest energy state.
As λ approaches , k approaches 0 making:.
The relative motion of each lattice point is in-phase with its neighbors, producing the lowest energy state.
Thus, it can be deduced that that the energy (and frequency) of the vibrational energy levels increases with k up to k = π/a (larger values of k are non unique as the wavefunction is 2π-periodic). The region -π/a ≤ k < π/a is known as the Brillouin zone and represents the range of unique k values in the lattice model.
Phonons
Phonons are a quantum mechanical description of a vibrational wave of a particular frequency travelling through a periodic lattice, analogous to a photon representing a electromagnetic wave. They are used for the calculations in this experiment as in a crystalline system, vibrations occur only collectively, unlike molecular vibrations which can occur independently, and therefore are easily described by the phonon model.
Calculating the Phonon Modes and DOS

The dispersion curve of the phonon modes of MgO was then calculated (Figure 3). Due to the fact that MgO is a heterodiatomic lattice, two types of phonon branch are observed, optical and acoustic. Optical branches do not converge to 0 cm-1 at point Γ whereas the acoustic branches do. The other points, marked on the x axis, L, X and W are points of high symmetry on the curve.
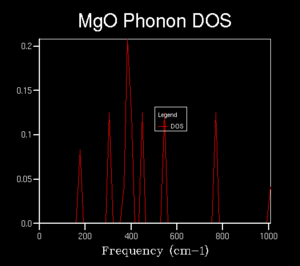
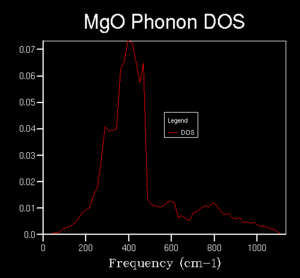
The DOS (Density of States) can be understood as an average of the dispersion curve over all k points was computed across the same frequency range as the dispersion curve, initially using a 1x1x1 k space grid (a single k point). As this is only a single point, an average is not reached but instead 4 distinct peaks are found. The reason that the two on the left are of higher intensity can be seen from the dispersion curve, the higher intensity comes as a results of the corresponding points crossing two branches that are imposed on each other at the given point. By comparison with the dispersion curve, it can be seen that the k point that this DOS corresponds to is point L
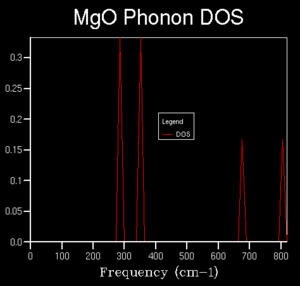
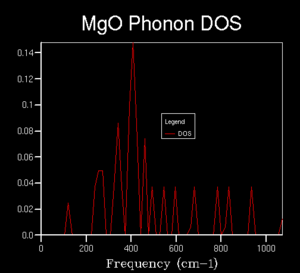
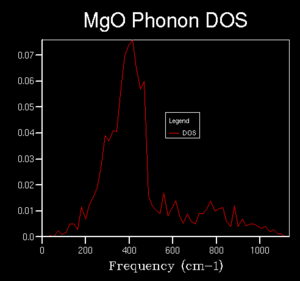
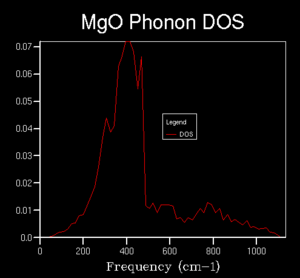
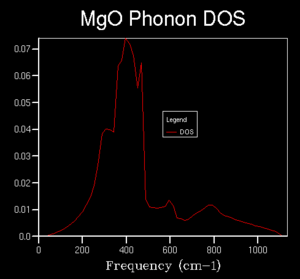
Further calculations were done of the DOS with a larger k space grid in order to investigate what grid size is required to get a reasonable approximation of the true average without requiring too much computational time. Grid sizes of 2x2x2, 3x3x3, 4x4x4, 5x5x5, 10x10x10, 15x15x15 , 20x20x20 and 50x50x50 were computed. Early changes in the grid size were drastic, giving differing numbers of peaks, however, at higher sizes, the curves began to converge to a recognisable average.The graph for 50x50x50 took a much longer time to compute than that for the 20x20x20 grid with very little visible difference, therefore, the 20x20x20 grid was determined to be of sufficient accuracy. This DOS can likely be used to approximate the DOS for other substances with similar crystal structures such as CaO, which has the same crystal structure with similar (or the same) ions involved but this would not be relevant to other substances such as Zeolites or pure metals.
-
2x2x2
-
3x3x3
-
4x4x4
-
10x10x10
-
15x15x15
-
20x20x20
-
50x50x50
Computing the Free Energy - The Harmonic Approximation
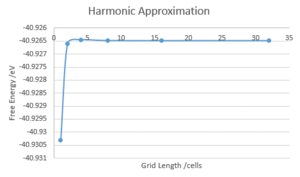
The computation above was repeated, with the temperature set to 300 K and using shrinking factors of 1, 2, 4, 8, 16 and 32. These points were selected to be tested as, due to the fact they are all powers of 2, it ensures that the same points are used for each iteration, only adding additional points to be tested between them. This produced the DOS, as before, and a corresponding Free Energy. The free energy was plotted against the shrinking factor. It could be seen that the free energy increased with the shrinking factor before plateauing around a free energy of -40.926482 eV (16x16x16 shrinking factors). Thus, the minimum shrinking factor configuration for both the DOS and the free energy is close to 16x16x16.
Depending on the resolution required, a smaller set of shrinking factors could be used:
For accuracy to: 1 meV 2x2x2 (-40.926609 eV), 0.5 meV: 4x4x4 (-40.926450 eV), 0.1 meV: 8x8x8 (-40.926478 eV).
These grid sizes calculated would only be suitable for the MgO lattice as for other compounds, even those of a similar structure such as CaO, would have differing interaction energies and therefore would have drastically different free energies.
The Thermal Expansion of MgO
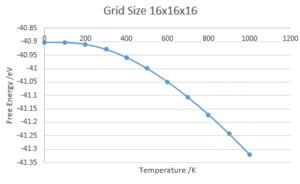
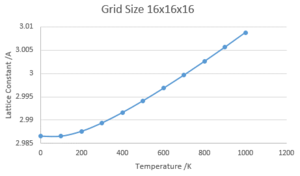
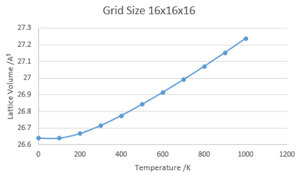
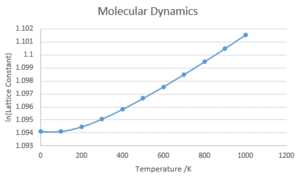
Using the optimal shrinking factor of 16x16x16, the variation of Free Energy and Lattice Constant with Temperature was calculated using the Quasi-Harmonic Approximation.
-
Free Energy against Temperature
-
Lattice Constant against Temperature
-
Lattice Volume against Temperature
-
Natural Logarithm of Lattice Constant against temperature

The use of the Quasi-Harmonic Approximation have a free energy decreasing non-linearly with temperature. This is rationalised by considering the definition of the Helmholtz Free Energy, A=U-TS. At first glance, this would seem to give a linear decrease of A with T but when considering how the entropy of the system changes with temperature under the QHA, it gives a non-linear relationship. This can be rationalized by considering the definition of the Helmholtz free energy: . Where is the zero point energy. The non-linearity can be attributed to the variation in entropy with temperature under the quasi-harmonic approximation (QHA):
The Quasi-Harmonic Approximation describes the variation of Lattice Constant as a parabola, this holds best close to the equilibrium point (i.e at power temperatures) as the model does not take into account phase changes. For this example, the main issue is that the model cannot model the melting of MgO due to the fact that bond dissociation is not considered, instead assuming that the lattice attractions increase indefinitely with temperature.
This relationship is examined by plotting the natural log of Lattice constant against the temperature. A mainly linear relationship is observed at higher temperatures, whereas closer to 0K, the effect of the Zero-Point Energy is observed.
The thermal expansion coefficient for a gas, liquid or solid is given by; . Therefore, in order to calculate the coefficient for this system, the equation of the graph of lattice volume against temperature was approximated by excel as y = 4E-07x2 + 0.0002x + 26.618 and the gradient used to calculate the coefficient over the range of temperatures.
Molecular Dynamics
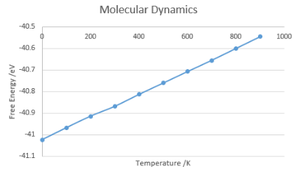
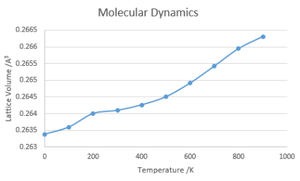
The same range of data was calculated again, this time through use of Molecular Dynamics (MD) calculations instead of the Quasi-Harmonic Approximation. The MD method uses classic mechanics instead of the quantum used by QHA. MD requires more than a single cell to performs calculations, as a calculation on a single cell would produce only in-phase motions so a grid of 32 MgO unit cells is used instead and the free energies and lattice volumes calculated was divided by 32 to allow direct comparison with the values calculated using the QHA method.
-
Free Energy against Temperature
-
Lattice Volume against Temperature
The values calculated for Free Energy and Lattice volume both gave linear relationships with the temperature of the system with no calculable value at 0K, this is due to the classical interpretation in which there is no zero-point energy, in contrast with the QHA method. Due to these factors, QHA is a better method to use at lower temperatures and MD is better at higher temperatures. However, neither method will produce accurate answers when approaching the melting point as neither take into account phase transitions, MD assuming a continued linear relationship and QHA assuming a continuation of the parabolic relationship.
References
- ↑ P. W. Atkins; J. De Paule, Atkins’ Physical Chem- istry, Oxford University Press, Oxford, ninth edition, 2010

