Rep:Mod:hgl0902
Mod: inorganic
Objectives
Computational lab provides an insight into the structure and bonding of complexes. Not only energy of stable conformers can be studied, but also locations of transition states and those complexes which are difficult or impossible to charactised experimentally. In this module, the main focus is to study bonding in the inorganic molecules by using ab initio method and looking into their density functional molecular orbitals.
Ab initio, means from the beginning in Latin[1]. The method is based on quantum mechanics and no experimental parameters are used in the calculations. Due to the wave-function-based nature of ab initio, for large molecule systems, there are heavy demands on computer resulted from the large time scales for computational calculation. A less demanding method is therefore introduced, density functional theory, which is based on total electron density and provides reasonably accurate results.[2]
The objectives of this module is to analyse the structure of TlBr3 and study the molecular orbitals of BH3 by using computational analysis. In addition, the bonding and the electron deinsity of cis and trans Mo(CO)4(PCl3)2 is also studied. A mini project is set up on aluminium 13 halides to explore the effects of having two Br atoms at different positions in AlCl4Br2 on their MO and vibrations.
MO Analysis of BH3
Optimisation of BH3
A molecule of trigonal planar BH3 was created in GaussView 5.0, B atom is in pink whereas the H atoms are in white.
BH |
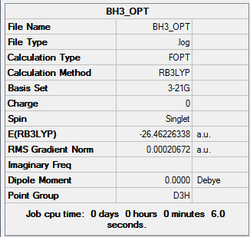
All three B-H bond lengths were set to 1.5Å and an optimisation was run using Gaussian 09W, using B3LYP method with basis set as 3-21G. The result summary is shown below. The log file is also attached.
The optimisation is confirmed to be completed as all the gradients are less than 0.001 and the job has converged.
  Item               Value     Threshold  Converged?
Maximum Force            0.000413     0.000450     YES
RMS     Force            0.000271     0.000300     YES
Maximum Displacement     0.001610     0.001800     YES
RMS     Displacement     0.001054     0.001200     YES
Predicted change in Energy=-1.071764D-06
Optimization completed.
   -- Stationary point found.
                          ----------------------------
                          !   Optimized Parameters   !
                          ! (Angstroms and Degrees)  !
--------------------------                            --------------------------
! Name  Definition              Value          Derivative Info.                !
--------------------------------------------------------------------------------
! R1    R(1,2)                  1.1935         -DE/DX =    0.0004              !
! R2    R(1,3)                  1.1935         -DE/DX =    0.0004              !
! R3    R(1,4)                  1.1935         -DE/DX =    0.0004              !
! A1    A(2,1,3)              120.0            -DE/DX =    0.0                 !
! A2    A(2,1,4)              120.0            -DE/DX =    0.0                 !
! A3    A(3,1,4)              120.0            -DE/DX =    0.0                 !
! D1    D(2,1,4,3)            180.0            -DE/DX =    0.0                 !
--------------------------------------------------------------------------------
GradGradGradGradGradGradGradGradGradGradGradGradGradGradGradGradGradGrad
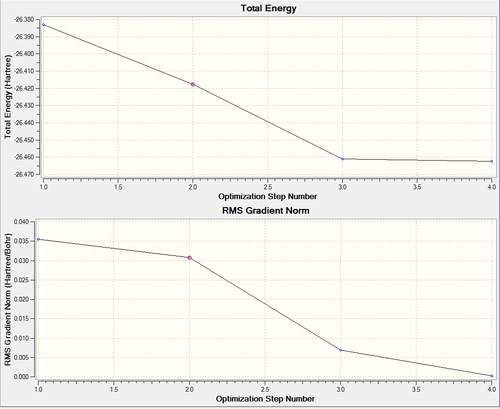
Four steps are involved in the optimisation, and the bond lengths of B-H in each step are summarised in the Table 1. As seen in Figure 1, the top graph gives the energy of each step and the bottom one gives the gradient of the energy at each step of the optimisation. As a result of optimisation, the molecule becomes more stable after each step and has the most negative energy at the final step. RMS gradient is the calculated root mean square of the total energy gradient, which indicates the rate of change in total energy with respect to the displacement(which is bond length in this case) of each atom in the xyz coordinations.[3] The RMS gradient is zero by the end of optimisation as a minimium in energy has been obtained.
| Optimisation Step No. | Bond Lengths (Å) | Structures | |
|---|---|---|---|
| 1 | 1.50 | 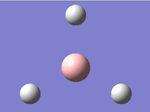 | |
| 2 | 1.41 | 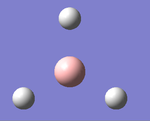 | |
| 3 | 1.23 | 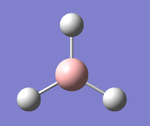 | |
| 4 | 1.19 | 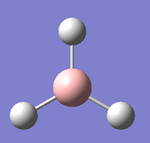 |
Frequency
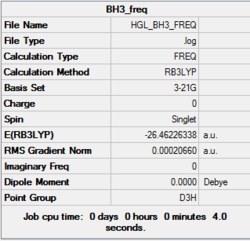
A frequency analysis of BH3 was carried out using Gaussian calculation on fully optimised structure.
 |
Low frequencies ---  -66.7577  -66.3555  -66.3551   -0.0017    0.0033    0.2123
Low frequencies --- 1144.1484 1203.6416 1203.6426
Harmonic frequencies (cm**-1), IR intensities (KM/Mole), Raman scattering
activities (A**4/AMU), depolarization ratios for plane and unpolarized
incident light, reduced masses (AMU), force constants (mDyne/A),
and normal coordinates:
                    1                      2                      3
                   A2"                    E'                     E'
Frequencies --  1144.1484              1203.6416              1203.6426
Red. masses --     1.2531                 1.1085                 1.1085
Frc consts  --     0.9665                 0.9462                 0.9462
IR Inten    --    92.8665                12.3148                12.3173
 Atom  AN      X      Y      Z        X      Y      Z        X      Y      Z
    1   5     0.00   0.00   0.16     0.00   0.10   0.00    -0.10   0.00   0.00
    2   1     0.00   0.00  -0.57     0.00   0.08   0.00     0.81   0.00   0.00
    3   1     0.00   0.00  -0.57    -0.38  -0.59   0.00     0.14   0.38   0.00
    4   1     0.00   0.00  -0.57     0.38  -0.59   0.00     0.14  -0.38   0.00
                    4                      5                      6
                   A1'                    E'                     E'
Frequencies --  2598.4244              2737.4357              2737.4364
Red. masses --     1.0078                 1.1260                 1.1260
Frc consts  --     4.0092                 4.9714                 4.9714
IR Inten    --     0.0000               103.7400               103.7333
 Atom  AN      X      Y      Z        X      Y      Z        X      Y      Z
    1   5     0.00   0.00   0.00     0.11   0.00   0.00     0.00   0.11   0.00
    2   1     0.00   0.58   0.00     0.02   0.00   0.00     0.00  -0.81   0.00
    3   1     0.50  -0.29   0.00    -0.60   0.36   0.00     0.36  -0.19   0.00
    4   1    -0.50  -0.29   0.00    -0.60  -0.36   0.00    -0.36  -0.19   0.00
The two lines labelled Low Frequencies are the -6 from 3N-6 vibration modes. The method employed here is not that accurate as a result of the use of a low level method 3-21G.
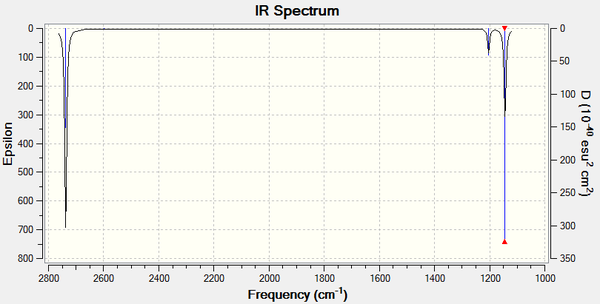
The results from the calculated IR spectrum are tabulated and the spectrum is attached as well.
| Frequencies (cm-1) | Intensities | Symmetry Point Group | Forms of vibrarations | Vibration Modes | Literature values[4] | %Difference | |
|---|---|---|---|---|---|---|---|
| 2737 | 104 | E' | 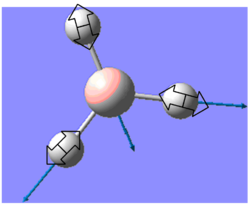 |
Asymmetrical B-H stretch: two B-H symmetrical stretch while being asymmetrical to the 3rd B-H | |||
| 2737 | 104 | E' | 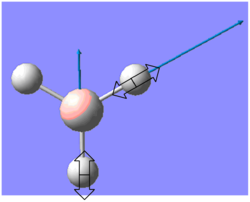 |
Asymmetrical B-H stretch: two B-H asymmetrical stretch with the 3rd one stationary | 2602 | 5.0% | |
| 2598 | 0 | A1' |  |
Symmetrical B-H stretch: all three B-H symmetrical stretch | 2475 | 4.9% | |
| 1204 | 12 | E' | 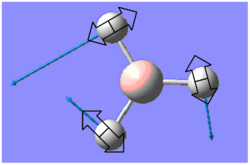 |
B-H rocking | |||
| 1204 | 12 | E' | 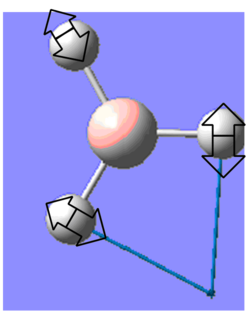 |
B-H bending: two B-H bending with the 3rd one moving up and down | 1199 | 0.4% | |
| 1144 | 93 | A2 | 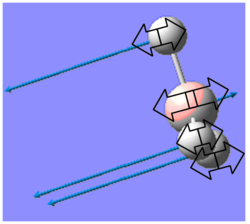 |
B-H wagging | 1141 | 0.3% |
There are six modes of vibrations. However, only three peaks are observed in the IR spectrum. This is resulted from B-H rocking and bending having the same energy and exhibit as one peak. So do the two asymmetrical B-H stretches. In addition, the symmetrical B-H stretch has no dipole moment and is IR inactive. Therefore, there are only three peaks shown.
Charge Distribution and MO analysis
MO Analysis
The MO analysis was based on the BH3 molecule optimised from the previous section. The method was set to energy instead of optimisation with pop=full in the additional keywords section and full NBO was set up and submitted to SCAN.
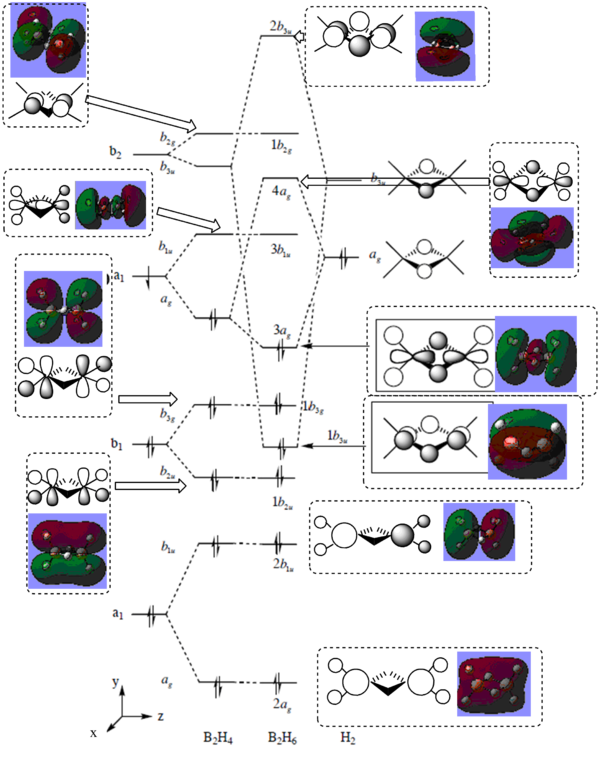
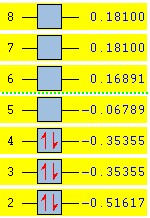
The MO obtained agrees with the literature[5]. The energy levels obtained by calculating NBO using SCAN are shown below and a modified MO diagram of BH3 showing the calculated LCAO for each energy level.
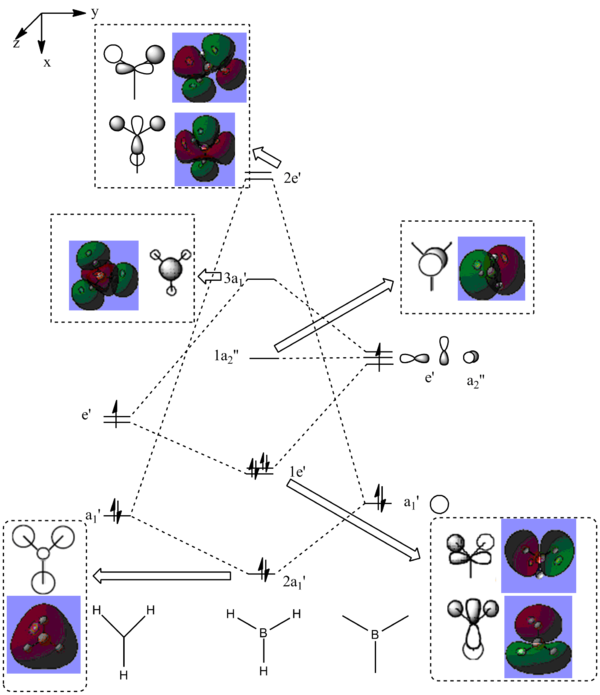 |
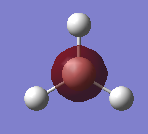
The MO 4 is the HOMO and MO 1 is not included in the MO diagram above as its energy is much lower than the H2. The occupied MO 2-4 are less diffused than those unoccupied ones. The strong agreement of the calculated results with the literature shows the reliability of the computational analysis is reasonably for small molecules such as BH3.
Charge Distribution
The charge distribution was obtained by using the same log file from the previous section.

| Atoms | Charges |
|---|---|
| B | 0.280 |
| H | -0.093 |
Summary of Natural Population Analysis:

                                      Natural Population
               Natural  -----------------------------------------------
   Atom  No    Charge         Core      Valence    Rydberg      Total
-----------------------------------------------------------------------
     B    1    0.27979      1.99954     2.72067    0.00000     4.72021
     H    2   -0.09326      0.00000     1.09311    0.00016     1.09326
     H    3   -0.09326      0.00000     1.09311    0.00016     1.09326
     H    4   -0.09326      0.00000     1.09311    0.00016     1.09326
=======================================================================
  * Total *    0.00000      1.99954     6.00000    0.00047     8.00000
(Occupancy) Bond orbital/ Coefficients/ Hybrids
---------------------------------------------------------------------------------
    1. (1.99866) BD ( 1) B   1 - H   2
               ( 45.34%)   0.6733* B   1 s( 33.33%)p 2.00( 66.67%)
                                           0.0000  0.5774  0.0000  0.0000  0.0000
                                           0.8165  0.0000  0.0000  0.0000
               ( 54.66%)   0.7393* H   2 s(100.00%)
                                           1.0000  0.0000
    2. (1.99866) BD ( 1) B   1 - H   3
               ( 45.34%)   0.6733* B   1 s( 33.33%)p 2.00( 66.67%)
                                           0.0000  0.5774  0.0000 -0.7071  0.0000
                                          -0.4082  0.0000  0.0000  0.0000
               ( 54.66%)   0.7393* H   3 s(100.00%)
                                           1.0000  0.0000
    3. (1.99866) BD ( 1) B   1 - H   4
               ( 45.34%)   0.6733* B   1 s( 33.33%)p 2.00( 66.67%)
                                           0.0000  0.5774  0.0000  0.7071  0.0000
                                          -0.4082  0.0000  0.0000  0.0000
               ( 54.66%)   0.7393* H   4 s(100.00%)
                                           1.0000  0.0000
    4. (1.99954) CR ( 1) B   1           s(100.00%)
                                           1.0000  0.0000  0.0000  0.0000  0.0000
                                           0.0000  0.0000  0.0000  0.0000
    5. (0.00000) LP*( 1) B   1           s(100.00%)
As seen in 1, boron (atom 1) and hydrogen (atom 2) form the first bond(BD 1), with 45.34% of the bond contributes from the B orbitals which is sp2 hybridisation as the ratio between s:p is 1:2, while 54.66% of the bond comes from the s orbital of H atom. Similar information can be found in 2 and 3. Therefore, the B atom has formed 3 sp2 hybrid orbitals, each interacting with a sAO of H atoms. 5 gives information on the unoccupied lone pair(LP*) on boron is 100% s, however this is meant to be 100%p. 4 is the core(CR) 1sAO of boron.The number in the bracket indicates the occupancy. For B-H bonding, it is 2c-2e (1.999 for occupancy). [7]
Overall, the calculated results are reasonably accurate with some minor mistakes. The three hybridised sp2 orbitals on boron further confirms the trigonal planar geometry of BH3 obtained from optimisation is correct with H-B-H of 120o.
Second Order Perturbation Theory Analysis of Fock Matrix in NBO Basis
    Threshold for printing:   0.50 kcal/mol
                                                                             E(2)  E(j)-E(i) F(i,j)
        Donor NBO (i)                     Acceptor NBO (j)                 kcal/mol   a.u.    a.u.
===================================================================================================
within unit  1
  4. CR (   1) B   1                / 10. RY*(   1) H   2                    0.70    7.41    0.064
  4. CR (   1) B   1                / 11. RY*(   1) H   3                    0.70    7.41    0.064
  4. CR (   1) B   1                / 12. RY*(   1) H   4                    0.70    7.41    0.064
The above section gives information on mixing. As all the E(2) energies are less than 20kcal/mol, no significant mixing is observed in BH3 molecules.
Natural Bond Orbitals (Summary):
                                                           Principal Delocalizations
          NBO                        Occupancy    Energy   (geminal,vicinal,remote)
====================================================================================
Molecular unit  1  (H3B)
    1. BD (   1) B   1 - H   2          1.99866    -0.43432
    2. BD (   1) B   1 - H   3          1.99866    -0.43432
    3. BD (   1) B   1 - H   4          1.99866    -0.43432
    4. CR (   1) B   1                  1.99954    -6.68108  10(v),11(v),12(v)
    5. LP*(   1) B   1                  0.00000     0.53792
    6. RY*(   1) B   1                  0.00000     0.37449
    7. RY*(   2) B   1                  0.00000     0.37449
    8. RY*(   3) B   1                  0.00000    -0.03988
    9. RY*(   4) B   1                  0.00000     0.41500
   10. RY*(   1) H   2                  0.00016     0.73200
   11. RY*(   1) H   3                  0.00016     0.73200
   12. RY*(   1) H   4                  0.00016     0.73200
   13. BD*(   1) B   1 - H   2          0.00134     0.42877
   14. BD*(   1) B   1 - H   3          0.00134     0.42877
   15. BD*(   1) B   1 - H   4          0.00134     0.42877
      -------------------------------
             Total Lewis    7.99552  ( 99.9440%)
       Valence non-Lewis    0.00401  (  0.0502%)
       Rydberg non-Lewis    0.00047  (  0.0058%)
      -------------------------------
           Total unit  1    8.00000  (100.0000%)
          Charge unit  1    0.00000
The above section records the energy and occupation of B-H bonds and boron lone pairs.
Structural Analysis of TlBr3
TlBr3 molecule has a greater molecular mass than BH3 molecules, which exhibits relativistic effects[8]. Such effects can not be recovered by the standard Schrödinger equation, but a pseudo-potential.
Optimisation
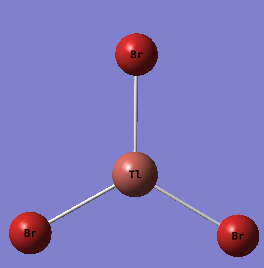
A TlBr3 molecule was created using GaussView5.0 and its energy was calculated by running Gaussian09W with restricted symmetry of D3h, tollerance set to very tight (0.0001). The basis set used was LanL2DZ. The summary of the results are shown below and the log file is attached at the end of this section.
TlBr |
TlBr3 was optimised using Gaussian09W.
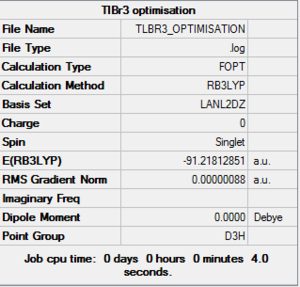 |
A comparison between the structure calculated using Gaussian and literature values is shown in Table 1.
| Molecule | Measurements | Literature Values[9] | % Difference |
|---|---|---|---|
| Bond Length Tl-Br(1) | 2.65 | 2.52 | 5.16% |
| Bond Length Tl-Br(2) | 2.65 | 2.50 | 6.0% |
| Bond Length Tl-Br(3) | 2.65 | 2.50 | 6.0% |
| Bond Angle Br(1)-Tl-Br(2)(degree) | 120.0 | 116.4 | 3.1% |
| Bond Angle Br(1)-Tl-Br(3)(degree) | 120.0 | 124.2 | 3.4% |
| Bond Angle Br(2)-Tl-Br(3)(degree) | 120.0 | 119.4 | 0.5% |
------------------
TlBr3 optimisation
------------------
Symbolic Z-matrix:
Charge =  0 Multiplicity = 1
Tl                    0.        0.        0.
Br                    0.        2.65095   0.
Br                    2.29579  -1.32548   0.
Br                   -2.29579  -1.32548   0.
GradGradGradGradGradGradGradGradGradGradGradGradGradGradGradGradGradGrad
Berny optimization.
Initialization pass.
                          ----------------------------
                          !    Initial Parameters    !
                          ! (Angstroms and Degrees)  !
--------------------------                            --------------------------
! Name  Definition              Value          Derivative Info.                !
--------------------------------------------------------------------------------
! R1    R(1,2)                  2.651          estimate D2E/DX2                !
! R2    R(1,3)                  2.651          estimate D2E/DX2                !
! R3    R(1,4)                  2.651          estimate D2E/DX2                !
! A1    A(2,1,3)              120.0            estimate D2E/DX2                !
! A2    A(2,1,4)              120.0            estimate D2E/DX2                !
! A3    A(3,1,4)              120.0            estimate D2E/DX2                !
! D1    D(2,1,4,3)            180.0            estimate D2E/DX2                !
--------------------------------------------------------------------------------
Trust Radius=3.00D-01 FncErr=1.00D-07 GrdErr=1.00D-06
Number of steps in this run=     20 maximum allowed number of steps=    100.
GradGradGradGradGradGradGradGradGradGradGradGradGradGradGradGradGradGrad
File:Hgl TLBr3 OPTIMISATION.LOG
Frequency
An frequency analysis was carried out using the optimised TlBr3, basis set LanL2DZ. The vibration modes of TlBr3 are similar to the ones of BH3. However, the energy is at the lower end of the spectrum. This is due to the heavier molecular mass of TlBr3 relative to BH3. The vibrations are extracted from the .log file and attached below.
Low frequencies ---   -3.4213   -0.0026   -0.0004    0.0015    3.9362    3.9362
Low frequencies ---   46.4289   46.4292   52.1449
Harmonic frequencies (cm**-1), IR intensities (KM/Mole), Raman scattering
activities (A**4/AMU), depolarization ratios for plane and unpolarized
incident light, reduced masses (AMU), force constants (mDyne/A),
and normal coordinates:
                    1                      2                      3
                   E'                     E'                     A2"
Frequencies --    46.4289                46.4292                52.1449
Red. masses --    88.4613                88.4613               117.7209
Frc consts  --     0.1124                 0.1124                 0.1886
IR Inten    --     3.6867                 3.6867                 5.8466
 Atom  AN      X      Y      Z        X      Y      Z        X      Y      Z
    1  35     0.00  -0.26   0.00     0.74   0.00   0.00     0.00   0.00   0.48
    2  35     0.43   0.49   0.00    -0.01   0.43   0.00     0.00   0.00   0.48
    3  35    -0.43   0.49   0.00    -0.01  -0.43   0.00     0.00   0.00   0.48
    4  81     0.00  -0.28   0.00    -0.28   0.00   0.00     0.00   0.00  -0.55
                    4                      5                      6
                   A1'                    E'                     E'
Frequencies --   165.2685               210.6948               210.6949
Red. masses --    78.9183               101.4032               101.4032
Frc consts  --     1.2700                 2.6522                 2.6522
IR Inten    --     0.0000                25.4830                25.4797
 Atom  AN      X      Y      Z        X      Y      Z        X      Y      Z
    1  35     0.00   0.58   0.00    -0.01   0.00   0.00     0.00   0.74   0.00
    2  35     0.50  -0.29   0.00     0.55  -0.32   0.00    -0.32   0.18   0.00
    3  35    -0.50  -0.29   0.00     0.55   0.32   0.00     0.32   0.18   0.00
    4  81     0.00   0.00   0.00    -0.42   0.00   0.00     0.00  -0.42   0.00
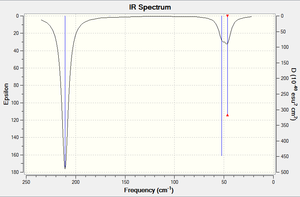 |
DOI:10042/to-57103 |
Organometallic Complex
Mo(CO)4L2, L=PPh3 has cis and trans isomers. IR spectroscopy is a useful method to distinguish the isomers. The number of CO vibrational bands active is related to the symmetry of the complex: four CO bands for cis and only one for trans isomers. To make the calculation simpler, PCl3 is used instead of PPh3 in this section since they both have similar electronic contribution to the bonding.
Optimisation
The optimisation was carried out using B3LYP with a low basis set and LANL2MB to get the rough geometry. The convergence criteria was set to loose by adding opt=loose in the additional keywords box. The molecules were then submitted to SCAN. The optimised molecules have all the P-Cl bonds gone.
The optimised structures have good bond lengths and angles but not necessarily the dihedral angles. Therefore, the torsion of both isomers were altered following the script, shown as jmol below. The molecules were then optimised using B3LYP with LANL2DZ pseudo-potential. The electronic convergence was increased by adding int=ultrafine scf=conver=9 to the additional key words.
|
|
|---|
- It is not always possible to find the literatures for the structures used in this section. Therefore, similar results are used for comparisons.
| Cis-structure | Cis-structure | Trans-structure | Trans-structure | ||
|---|---|---|---|---|---|
| Structures | 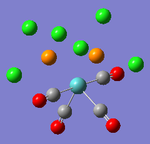 |
 |
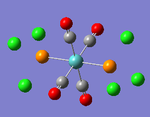 |
 | |
| Calculation Method | B3LYP | B3LYP | B3LYP | B3LYP | |
| Basis Set | LANL2MB | LANL2DZ | LANL2MB | LANL2DZ | |
| Energy (a.u) | -617.5251 | -623.5771 | -617.5220 | -623.5760 | |
| RMS Gradient (a.u) | 0.00012307 | 0.00000355 | 0.00013908 | 0.00002201 | |
| Dipole Moment (Debye) | 8.63 | 1.31 | 0 | 0.31 | |
| Job cpu time | 8min 22.6s | 59min 31.8s | 5min 49.7s | 38min 8.1s | |
| Files | File:Hgl Cis opt loose.out DOI:10042/to-57266 | File:Hgl Trans opt loose.out DOI:10042/to-57252 | File:Log 57268.out DOI:10042/to-57268 | File:Log 57267.out DOI:10042/to-57267 |
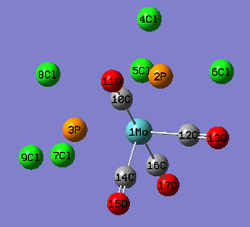
As seen from the above results, the cis isomers using both methods have slightly more negative energies than the trans ones. The difference between the two structures is 0.0011 a.u, which is 2.89 kJ/mol. In this case, cis isomers have a slightly lower energy and i.e. thermodynamically more stable. However, this doesn't agree with the literature used in Year 2 Synthesis lab: Trans Mo(CO)4(PR3)2 is more stable. The strong steric interactions between the PCl3 groups make the cis structure less favoured and unstable. A better result could have been obtained by running optimisation at higher level method. The RMS gradient of the trans structure using LANL2DZ is 10 times greater than that of the cis structure one, which means a further optimisation could be done to make the gradient reach a minimum close to zero.
 |
Optimised by LANL2MB | Optimised by LANL2DZ | Literature values [10] [11] | |
|---|---|---|---|---|
| Mo-C(10);Mo-C(16)(Å) | 2.11 | 2.06 | 2.04 | |
| Mo-C(14);Mo-C(12):(Å) | 2.06 | 2.01 | 1.98 | |
| Mo-P (Å) | 2.53 | 2.51 | 2.57 | |
| C(10)-O(11); C(16)-O(17) (Å) | 1.19 | 1.17 | 1.18 | |
| C(12)-O(13); C(14)-O(15) (Å) | 1.19 | 1.18 | 1.13 | |
| P(2)-Cl(5);P(3)-Cl(8)(Å) | 2.39 | 2.24 | ||
| all the other P-Cl(Å) | 2.41 | 2.24 | ||
| C(axial)-Mo-P | 89.3 | 91.4 | ||
| C(equtorial)-Mo-P | 89.3 | 89.0 | 80.6 | |
| C(axial)-Mo-C(equatorial) | 87.4 | 89.6 | ||
| C(equatorial)-Mo-C(equtorial) | 89.2 | 87.4 | 84.53 |
The calculated results are reasonably accurate as the literature values used have slight different PR3 groups. The difference between them would mainly resulted from the bulkiness of the relative PR3 groups. Cl atoms are large and exerts greater repulsion than the PCy3 groups in the literature. The bond angles do not agree that well. The difference in the functional groups affect the most for the bond angles due to the different extents of steric effect.
 |
Optimised by LANL2MB | Optimised by LANL2DZ | Literature values[12] | |
|---|---|---|---|---|
| Mo-C(Å) | 2.11 | 2.06 | 2.01-2.02 | |
| Mo-P (Å) | 2.48 | 2.44 | 2.50 | |
| C-O (Å) | 1.19 | 1.17 | 1.16-1.17 | |
| P-Cl (Å) | 2.40 | 2.24 | ||
| C-Mo-C | 90.0 | 89.5 | 92.1 | |
| P-Mo-C | 90.0 | 90.0 | 87.2 |
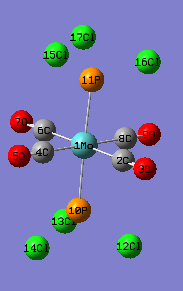
The calculated results of the trans-structure reasonably agrees with the literature, which is the trans Mo(CO)4(PPH3)2. The Mo-P distance of the calculated structure is shorter than the literature value as the steric effect in PCl3 is less than that of PPh3, i.e. short bonds. The bond angles of the calculated trans structure roughly agree with the literature as in the trans structures, the steric effects from the functional group are less. It maintains good octahedral structure whereas in the cis isomers, the steric interactions of the L groups are much greater and its structure would be distorted from the octahedral geometry. This is confirmed by the C(eq)-Mo-C(eq) angle not equal to 90° in the cis structure.
The relative stability of the isomers of the Mo(CO)4L2 depends predominantly on the size of the L group. The larger the L group, the more stable its trans isomers relative to the cis ones. Thus, to alter such ordering, smaller ligand groups such as PH3 could be used to replace the PCl3 ligands.[13]
Frequency Analysis
To confirm the geometries of both structures were optimised, frequency analysis of each was carried out based using LANL2DZ.
Cis-Structure IR DOI:10042/to-57356 Trans-Structure IR DOI:10042/to-57357
 |
CO(cm-1)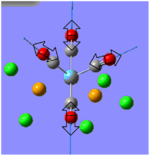 |
CO(cm-1)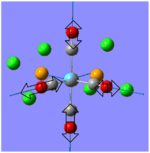 |
CO(cm-1)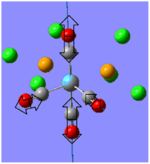 |
CO(cm-1)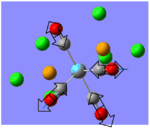 |
|---|---|---|---|---|
| Vibrations calculated using LANL2DZ | 2023 | 1958 | 1949 | 1945 |
| Literature[14] | 2072 | 2004 | 1994 | 1986 |
 |
!CO(cm-1)CO(cm-1) |
CO(cm-1)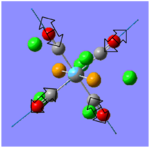 |
CO(cm-1) |
CO(cm-1) |
|---|---|---|---|---|
| Vibrations calculated using LANL2DZ | 2030 | 1977 | 1951 | 1951 |
| Literature[15] | 1890 | 1890 |
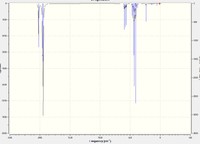
Four distinct peaks corresponding to CO stretching are observed in the cis-structure, while only one peak is observed in the trans structure. Although both structures have four modes of CO stretch, the completely symmetrical structure of the trans isomer cancels the dipoles out and having zero dipole moment which is IR inactive. Free CO stretch has a vibration of 2143cm-1[16] The backbonding from the Mo metal centre weakens the CO bonding and thus lower vibration energy. PCl3 is a good π acceptor ligand, which competes with the CO ligand for the metal centre forming backbonding. In both structures, all CO stretch are weakened, which implies the weak π- acceptor ability of PCl3 relative to CO.[17] PPh3 is an even weaker π-acceptor than PCl3, more π-backbonding from Mo to CO ligand which would shift the CO peaks to even lower energy end.
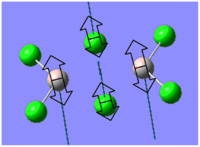
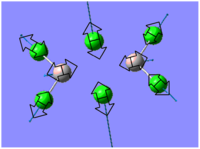
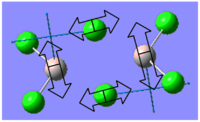
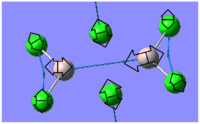
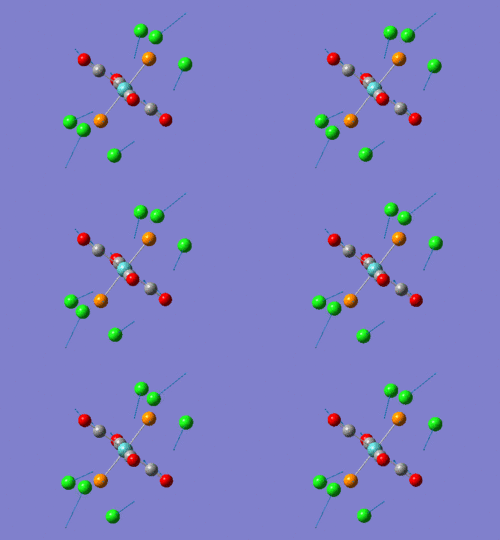
There are also some low frequency peaks, which would not be generally observed at room temperature. The low frequency vibrations of the trans structure is illustrated below. For the cis structure, the same vibration modes would be observed but at even lower frequencies.
| P-Cl rocking | Mo-C rocking | P-Cl twisting | P-Cl wagging |
|---|---|---|---|
 |
 |
 |

|
| 65.29cm-1 | 65.24cm-1 | 60.58cm-1 | 60.06cm-1 |
Mini Project: Exploring Bonding in Main Group Halides
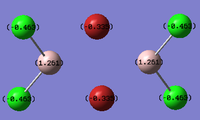
B2H6 has two bridging H atoms and four terminal atoms. A similar bonding situation is found for Al2Cl6. However, when two of the Cl atoms are replaced by Br atoms, several possible structures could have been adapted. The aim of this project is to find out the most favoured and stable structure of Al2Cl4Br2 by studying the relative energies and MOs of the possible structures.
In this section, all the frequency analysis are done together with the final structure optimisation. The method used is B3LYP with LANL2DZ as the basis set with int=ultrafine scf=conver=9 in the additional key words.
B2H6
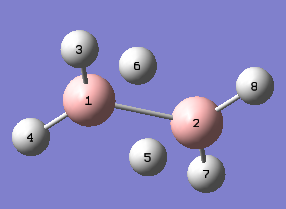
A B2H6 molecule was created in GaussView 5.0. The molecule was then submitted to SCAN for optimisation, the method used is B3LYP, basis set LANL2DZ. The MOs are calculated using the same method with additional keywords: pop=full.
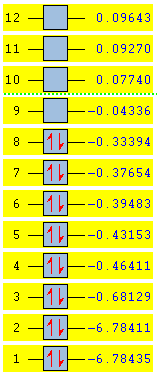
MO diagram of B2H6
The resulted energy levels are slightly different from the literature which would be due to the ab initio method doesn't take any experimental parameter into account, i.e. no extra stablisation was included when generating the MOs.
Summary of Natural Population Analysis:

                                      Natural Population
               Natural  -----------------------------------------------
   Atom  No    Charge         Core      Valence    Rydberg      Total
-----------------------------------------------------------------------
     B    1   -0.10113      1.99921     3.09472    0.00720     5.10113
     B    2   -0.10186      1.99921     3.09544    0.00721     5.10186
     H    3   -0.00105      0.00000     1.00048    0.00057     1.00105
     H    4   -0.00105      0.00000     1.00048    0.00057     1.00105
     H    5    0.10354      0.00000     0.89498    0.00148     0.89646
     H    6    0.10354      0.00000     0.89498    0.00148     0.89646
     H    7   -0.00100      0.00000     1.00043    0.00057     1.00100
     H    8   -0.00100      0.00000     1.00043    0.00057     1.00100
=======================================================================
  * Total *    0.00000      3.99842    11.98195    0.01964    16.00000
 (Occupancy)   Bond orbital/ Coefficients/ Hybrids
---------------------------------------------------------------------------------
    1. (1.98956) BD ( 1) B   1 - H   3
               ( 49.87%)   0.7062* B   1 s( 31.97%)p 2.13( 68.03%)
                                          -0.0002  0.5654 -0.0102  0.4244 -0.0106
                                           0.7065  0.0293  0.0000  0.0000
               ( 50.13%)   0.7080* H   3 s(100.00%)
                                           1.0000  0.0010
    2. (1.98956) BD ( 1) B   1 - H   4
               ( 49.87%)   0.7062* B   1 s( 31.97%)p 2.13( 68.03%)
                                          -0.0002  0.5654 -0.0102  0.4244 -0.0106
                                          -0.7065 -0.0293 -0.0001  0.0000
               ( 50.13%)   0.7080* H   4 s(100.00%)
                                           1.0000  0.0010
    3. (1.98955) BD ( 1) B   2 - H   7
               ( 49.87%)   0.7062* B   2 s( 31.96%)p 2.13( 68.04%)
                                          -0.0002  0.5652 -0.0102 -0.4246  0.0106
                                          -0.7065 -0.0293  0.0000  0.0000
               ( 50.13%)   0.7080* H   7 s(100.00%)
                                           1.0000  0.0010
    4. (1.98955) BD ( 1) B   2 - H   8
               ( 49.87%)   0.7062* B   2 s( 31.96%)p 2.13( 68.04%)
                                          -0.0002  0.5652 -0.0102 -0.4246  0.0106
                                           0.7065  0.0293  0.0001  0.0000
               ( 50.13%)   0.7080* H   8 s(100.00%)
                                           1.0000  0.0010
    5. (1.99921) CR ( 1) B   1           s(100.00%)p 0.00(  0.00%)
                                           1.0000  0.0002  0.0000  0.0002  0.0000
                                           0.0000  0.0000  0.0000  0.0000
    6. (1.99921) CR ( 1) B   2           s(100.00%)p 0.00(  0.00%)
                                           1.0000  0.0002  0.0000 -0.0002  0.0000
                                           0.0000  0.0000  0.0000  0.0000
    7. (0.63847) LP*( 1) B   1           s( 36.15%)p 1.77( 63.85%)
                                           0.0000  0.6005  0.0292 -0.7990  0.0089
                                           0.0000  0.0000  0.0006  0.0000
    8. (0.46933) LP*( 2) B   1           s(  0.00%)p 1.00(100.00%)
                                           0.0000  0.0003  0.0000 -0.0005  0.0000
                                           0.0001  0.0000 -0.9986  0.0522
    9. (0.63872) LP*( 1) B   2           s( 36.18%)p 1.76( 63.82%)
                                           0.0000  0.6008  0.0292  0.7988 -0.0089
                                           0.0000  0.0000 -0.0006  0.0000
   10. (0.46971) LP*( 2) B   2           s(  0.00%)p 1.00(100.00%)
                                           0.0000  0.0003  0.0000  0.0005  0.0000
                                          -0.0001  0.0000  0.9986 -0.0522
   11. (0.89498) LP ( 1) H   5           s(100.00%)
                                           1.0000  0.0000
   12. (0.89498) LP ( 1) H   6           s(100.00%)
                                           1.0000  0.0000
As seen from the above extract, for the terminal B-H bonding, it is 2c-2e, while for the bridging one it is 3c-2e.
- NBO 1: 1.98955≈2e
Therefore, for B(1)-H(3), it is 2c-2e. The same for the other terminal B-H bonding.
- NBO 7, 10, 11: The sum of the occupancy =0.63847+0.46971+0.89498≈2e
Therefore, for B(1)-H(5)-B(2), it is 3c-2e. So is B(1)-H(6)-B(2)
Optimisation DOI:10042/to-57295 NBO Analysis DOI:10042/to-57413
Al2Cl6
Both boron and aluminum are in Group 13. Al2Cl6 has a similar structure to B2H6 with more valence electrons. The optimisation was obtained using B3LYP, basis set LAN2LMB.
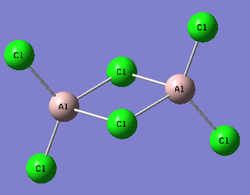 |
Bond Lengths calculated using LAN2LMB(Å) | Bond Lengths calculated using LAN2LDZ(Å) | Literature values[18] (Å) | % Difference between the literature and the bond length calculated using LAN2LMB |
|---|---|---|---|---|
| Al-Cl(bridging) | 2.38 | 2.41 | 2.21 | 8% |
| Al-Cl(terminal) | 2.16 | 2.17 | 2.06 | 5% |
The optimised structure roughly agrees with the literature structure within 10% difference. A further optimisation has been done using the method mentioned at the beginning of this section, but the bond lengths obtained having a greater % difference than the ones obtained using LANL2MB. There's an error in the dipole moment.
Al2Cl6 is less electron deficient than B2H6. By looking into the .log file obtained for the NBO analysis, it can be found that the Al2Cl4 ring is 3c-4e.
- NBO 1, 5: Sum of Occupancy=1.96291+1.96291≈4e
Therefore, Al(1)-Cl(3)-Al(2)is 3c-4e bonding.
    (Occupancy)   Bond orbital/ Coefficients/ Hybrids
---------------------------------------------------------------------------------
    1. (1.96291) BD ( 1)Al   1 -Cl   3
               ( 11.49%)   0.3389*Al   1 s( 18.84%)p 4.31( 81.16%)
                                          -0.4338  0.0156 -0.5580 -0.0127  0.0001
                                           0.0000 -0.7061 -0.0394
               ( 88.51%)   0.9408*Cl   3 s( 21.22%)p 3.71( 78.78%)
                                          -0.4607 -0.0026  0.7071 -0.0005 -0.0002
                                           0.0000  0.5365 -0.0017
    5. (1.96291) BD ( 1)Al   2 -Cl   3
               ( 11.49%)   0.3390*Al   2 s( 18.86%)p 4.30( 81.14%)
                                           0.4339 -0.0156 -0.5580 -0.0128 -0.0001
                                           0.0000  0.7060  0.0394
               ( 88.51%)   0.9408*Cl   3 s( 21.22%)p 3.71( 78.78%)
                                           0.4607  0.0026  0.7071 -0.0005  0.0002
                                           0.0000 -0.5364  0.0017
Optimisation and frequency analysis using LANL2MB DOI:10042/to-57281
Optimisation and frequency analysis using LANL2DZ DOI:10042/to-57300
NBO DOI:10042/to-57309
Al2Cl4Br2
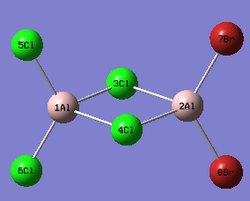
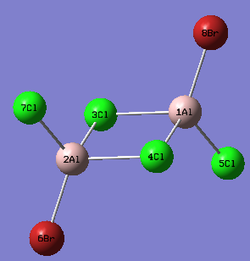
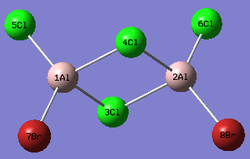
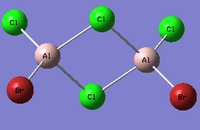
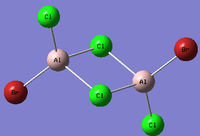
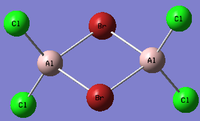
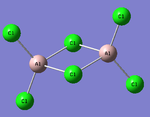
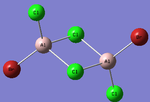
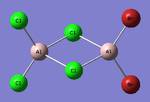
Replacing two Cl atoms with the Al2Cl6 molecule, there are four possible structures. The optimised structure and bond lengths are summarised in the table below. All of the structures have similar bonding as found in Al2Cl6.
It is not possible to find the literature for the exact structures, the bond lengths of Al-Cl and Al-Br used are from Al2Cl6 and Al2Br6.[19] The terminal Al-Cl is 2.06Å and the bridge one is 2.21Å. The terminal Al-Br is 2.21Å and bridge one 2.33Å. The greater Br atoms repulsion weakens and elongates the Al-Br bond. The bridging Al-X bonds are weaker and longer than the terminal ones. In such way, the strain of the Al2X4 ring could be released slightly. The calculated results have the same general trend as the literature. Most of the calculated results are greater than the literatures, which arises from the extra repulsion caused by the replacement of more electron-rich Br atoms to Cl atoms. The atoms are further apart to minimise such effect, i.e increase in bond lengths.
The optimisation energies of the four structures are compared in the following table. All of them are exothermic and the cis structure with both Br atoms on the same Al atom has the most negative energy, i.e, it is the most thermodynamically stable, while the bridging structure is the least due to the strain in the Al2Br2 ring. However, this contradicts with the analysis in the organometallics section as the cis structure has stronger steric interaction between the two Br atoms. It is more likely the trans structure exhibits more stabilisation since the Br atoms are the furthest from each other with the smaller Cl atoms at the bridging position. The energy difference between the other three are relatively small. To obtain a more accurate result, a further optimisation should be carried out using higher level method since the RMS gradients of the last three isomers could be further decreased closer to zero.
| Structures | cis isomer(Br atoms on different Al atoms) | Trans isomer | Cis isomer(Br atoms on the same Al atom) | Bridging isomer |
|---|---|---|---|---|
| Energy (a.u) | -90.47285512 | -90.47287389 | -90.47300159 | -90.46236293 |
| RMS gradient (a.u) | 0.00000802 | 0.00002210 | 0.00004087 | 0.00001531 |
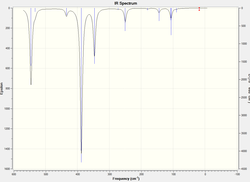
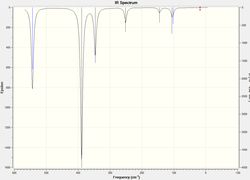
Frequency Analysis
| Structures |  |
 |
|
|---|---|---|---|
| IR spectra | 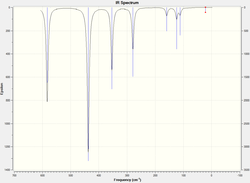 |
 |
|
| Structures | 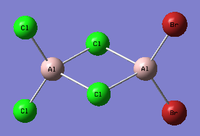 |
|
|---|---|---|
| IR Spectra | 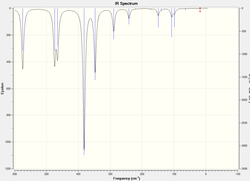 |
|
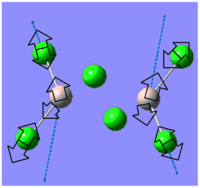
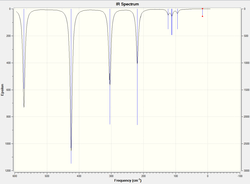
The atomic mass of Br atoms is heavier than that of Cl atoms, leading to a shift of some peaks to the lower energy end due to the decrease in the dipole moment. The vibration modes of all five structures are the same. The difference in the IR spectra is mainly due to the replacement of the Br atoms, which makes some IR inactive vibrations become active and extra peaks exhibit on the spectra. The vibration modes affect the most are the following ones:
MO Analysis
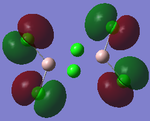
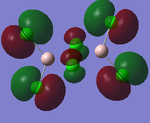
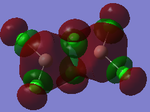
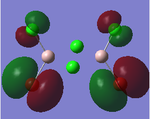
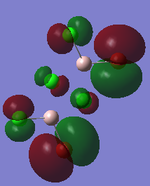
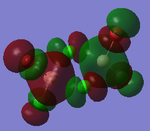
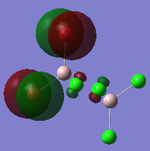
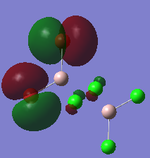
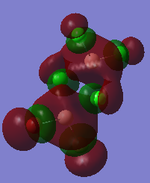
Full NBO analysis of the optimised structures were submitted to SCAN using the same set as the previous part with pop=full in the additional keywords.
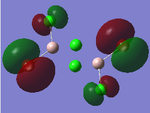
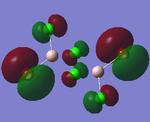
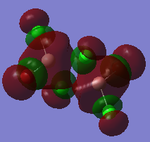
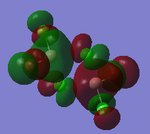
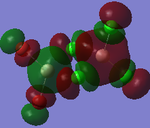
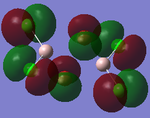
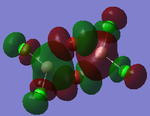
| Structures | HOMO-1 | HOMO | LUMO | LUMO+1 |
|---|---|---|---|---|
 |
 |
 |
 |

|
 |
 |
 |
 |
|
 |
 |
 |
 |
|
 |
 |
 |
 |
|
 |
 |
 |
 |
|
For the cis structure (Br atoms on the same Al atom), by looking into the .log file, the following ones are found:
Second Order Perturbation Theory Analysis of Fock Matrix in NBO Basis
    Threshold for printing:   0.50 kcal/mol
                                                                             E(2)  E(j)-E(i) F(i,j)
        Donor NBO (i)                     Acceptor NBO (j)                 kcal/mol   a.u.    a.u.
14. LP (   2)Cl   5                / 57. BD*(   1)Al   1 -Cl   3            5.08    0.32    0.037
14. LP (   2)Cl   5                / 58. BD*(   1)Al   1 -Cl   4            5.08    0.32    0.037
14. LP (   2)Cl   5                / 60. BD*(   1)Al   1 -Cl   6            7.61    0.42    0.050
15. LP (   3)Cl   5                / 57. BD*(   1)Al   1 -Cl   3            7.33    0.32    0.044
15. LP (   3)Cl   5                / 58. BD*(   1)Al   1 -Cl   4            7.33    0.32    0.044
17. LP (   2)Cl   6                / 57. BD*(   1)Al   1 -Cl   3            5.09    0.32    0.037
17. LP (   2)Cl   6                / 58. BD*(   1)Al   1 -Cl   4            5.08    0.32    0.037
17. LP (   2)Cl   6                / 59. BD*(   1)Al   1 -Cl   5            7.61    0.42    0.050
18. LP (   3)Cl   6                / 57. BD*(   1)Al   1 -Cl   3            7.33    0.32    0.044
18. LP (   3)Cl   6                / 58. BD*(   1)Al   1 -Cl   4            7.33    0.32    0.044
19. LP (   1)Br   7                / 29. RY*(   1)Al   2                    4.90    0.95    0.061
20. LP (   2)Br   7                / 61. BD*(   1)Al   2 -Cl   3            5.54    0.28    0.036
20. LP (   2)Br   7                / 62. BD*(   1)Al   2 -Cl   4            5.54    0.28    0.036
20. LP (   2)Br   7                / 64. BD*(   1)Al   2 -Br   8            6.74    0.36    0.044
21. LP (   3)Br   7                / 61. BD*(   1)Al   2 -Cl   3            7.36    0.28    0.042
21. LP (   3)Br   7                / 62. BD*(   1)Al   2 -Cl   4            7.35    0.28    0.042
22. LP (   1)Br   8                / 29. RY*(   1)Al   2                    4.90    0.95    0.061
23. LP (   2)Br   8                / 61. BD*(   1)Al   2 -Cl   3            5.54    0.28    0.036
23. LP (   2)Br   8                / 62. BD*(   1)Al   2 -Cl   4            5.54    0.28    0.036
23. LP (   2)Br   8                / 63. BD*(   1)Al   2 -Br   7            6.74    0.36    0.044
24. LP (   3)Br   8                / 61. BD*(   1)Al   2 -Cl   3            7.36    0.28    0.042
24. LP (   3)Br   8                / 62. BD*(   1)Al   2 -Cl   4            7.35    0.28    0.042
E(2) is the stabilisation energy.[20] The above NBOs on the left donates occupancy to the ones on the right, delocalising the natural Lewis structure. NBO 23 is the HOMO-1 and NBO 24 is the HOMO. Similar stabilisation could be found in the trans structure. Therefore, it is still difficult at this stage to tell which of the trans or the cis structure is more favoured.
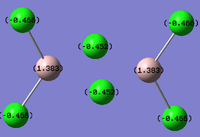
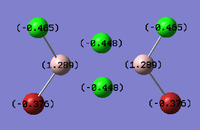
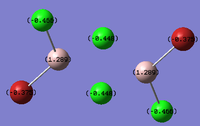
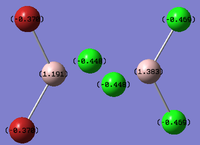
The charge distributions have a good agreement with the electronegativity of the atoms. Cl is the most electronegtive one and always have the most -ve charge regardless to its bonding. As the Br atoms get closer, the charge carried on it decreases. Moving from the left to the right, the Br-Br distance decreases, so are the charges carried on them.
After all, it is possible that the cis structure of having both Br atoms on the same Al atom is the most stable one since it has the lowest energy and delocalisation in MO. However, further test with higher level method would still be necessary to confirm this.
Conclusions
Computational chemistry is a powerful tool for studying structures in inorganic chemistry, which is particularly useful when toxic or dangerous chemicals are involved. The accuracy of the results are reasonably reliable, although extra factors still need to be taken into consideration.
References
- ↑ Ab initio, DOI:http://en.wikipedia.org/wiki/Ab_initio
- ↑ Computational Chemistry – Gauss View and Gaussian,DOI:http://www.wellesley.edu/Chemistry/Chem105manual/Lab07/07Chem105LComputationPrelab.pdf
- ↑ Glossary of Terms used in computational Chemistry and the Hyperchem Manual DOI:http://itl.chem.ufl.edu/3417_s98/hyper/glossary.html
- ↑ D. A. Dixon and M. Gutowski, The Journal of Physical Chemistry A, 2005, 109, 5129-5135.
- ↑ http://www.huntresearchgroup.org.uk/teaching/teaching_comp_lab_year3/Tut_MO_diagram_BH3.pdf
- ↑ http://www.huntresearchgroup.org.uk/teaching/teaching_comp_lab_year3/Tut_MO_diagram_BH3.pdf
- ↑ Tutorial Example for Methylamine DOI:http://www.chem.wisc.edu/~nbo5/tutorial.html
- ↑ Relativistic Effect, DOI:http://users.powernet.co.uk/bearsoft/new_site/hisch/rel-speed.pdf
- ↑ S. E. Jeffs, R. W. H. Small and I. J. Worrall, Acta Cryst., 1984, C40, 381-383 DOI:10.1107/S0108270184004224
- ↑ M. Watson, S. Woodward, G. Conole, M. Kessler and G. Sykara, Polyhedron, 1994, 13, 2455-2458. DOI:http://dx.doi.org/10.1016/S0277-5387(00)88162-0,
- ↑ J. E. Cortes-Figueroa, M. S. Leon-Velaguez, J. Ramos, J. P. Jasinki, D. A. Keene, J. D. Zubkowski, E. J. Valente, Acta Cryst. C56 (2000) 1435. DOI:10.1107/S0108270100013111
- ↑ G. Hogarth and T. Norman, Inorganica Chimica Acta, 1997, 254, 167-171. DOI:http://dx.doi.org/10.1016/S0020-1693(96)05133-X
- ↑ C. H. Suresh, Inorganic Chemistry, 2006, 45, 4982-4986. DOI:10.1021/ic051959w
- ↑ E.C. Alyea and S. Song, Inorg. Chem, 1995, 34(15), 3864-3873 DOI:http://pubs.acs.org/doi/pdf/10.1021/ic00119a006
- ↑ M. Ardon, J. Chem. Educ., 2002, 79(10), 1249 DOI:[https://doi.org/ 10.1021/ed079p1249 10.1021/ed079p1249]
- ↑ Metal carbonyl DOI:http://en.wikipedia.org/wiki/Metal_carbonyl
- ↑ E.C. Alyea, S. Song, Inorg. Chem., 1995, 34(15) 3864-3873 DOI:10.1021/ic00119a006
- ↑ S.J. Bryan, W.Clegg, R. Snaith, K. Wade and E.H.Wong, J. Chem. Soc., Chem. Commun.,1987, 1223-1224
- ↑ K. Wade, J. Chem. Educ., 1972, 49(7), 502 DOI:[https://doi.org/ 10.1021/ed049p502 10.1021/ed049p502]
- ↑ http://www.chem.wisc.edu/~nbo5/tutorial.html

