Rep:Mod:heresjohnny
Transition Structures Computational Lab
Overview
The exercises conducted below were an introduction to transition state modelling with the Gaussian program. The problem of locating transition states, which are saddle points on the potential energy surface of a reaction[1], is interesting for a number of reasons. Chief among them is the implication on the kinetics of a reaction. The transition state is the highest point on the energy curve of the reaction and therefore a reaction's success depends on if the reactants are energetic enough to reach it. The energy required by the reactants in their ground state to reach the transition state is termed the 'Activation Energy'. This state is therefore key to understanding the mechanisms behind a reaction. A further reason why the transition state is of interest is due to its elusive nature to experimentally. Due to its highly energetic nature it is unstable and has a lifetime not possible to observe with experiment. Therefore any investigation of this important state lends itself to being theoretical.
Part 1: Cope Rearrangement
Introduction
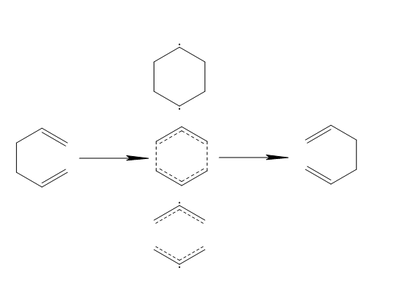
The Cope Rearrangement is perhaps one of the more well understood organic reactions, which is not to say that its history is not without some controversy. Described in 1940 by Arthur C. Cope and Elizabeth M. Hardy in their seminal paper[2], the possible mechanism behind the reaction would not begin to understood for another 25 years until the work of Woodward and Hoffmann on the preservation of orbital symmetry in pericyclic reactions[3]. Since then, there has been significant dispute over both its concertedness and synchronicity. As a result a number of alternatives for the transition state have been suggested. These can be categorized as either radical, leading to a step-wise reaction, or aromatic, leading to a concerted reaction[4]. The reaction along with the main categories of suggested transition states are illustrated in Figure 1. The pathway utilising the bottom-most dissociative transition state has now been largely dismissed on energetic grounds[5]. The search for the lowest energy transition state, and hence the reaction mechanism, has led to computational studies being used extensively throughout this debate.


The study described herein focused on a specific example of the Cope Rearrangement, the [3,3]-sigmatropic shift of 1,5-hexadiene. The concerted mechanism via either a chair or boat aromatic transition state was investigated.
1,5-Hexadiene Structure Optimisation Using the 3-21G Basis Set
In order to begin investigation of the Cope Rearrangement a conformational analysis of the reactant, 1,5-hexadiene, must be undertaken. This is necessary in order to find the ground state of the molecule, which in turn is used to simulate our reaction. 1,5-Hexadiene has 27 possible conformations due to the presence of 3 freely rotating carbon-carbon bonds, each with 3 rotational minima[6]. However due to considerations of enantiomerism and symmetry only 10 conformers are energetically distinct[6]. Of these 10, each is either a gauche or anti-periplanar conformer. Every conformer can be distinguished by a unique set of torsional angles. The Newman projection of every conformer as well the corresponding torsion angles as determined by Rocque et al. are shown in Figure 4 and Table 1 respectively.
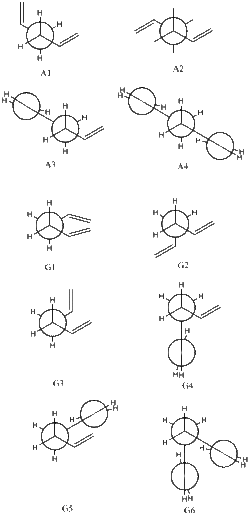
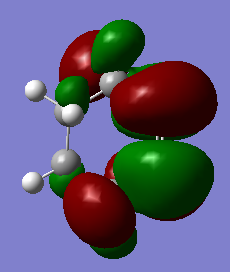
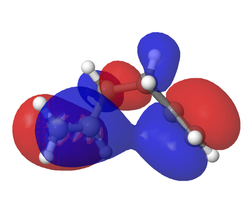
Optimization to a minimum was performed using the Hartree-Fock method and 3-21G basis set, the initial torsional angles were selected from Table 1. At first a single anti-periplanar and gauche orientation was analysed, A1 and G1. Out of the two, the anti-periplanar arrangement was found to be of lower energy by and is as a result the more suitable candidate for a reference molecule. This result is intuitive based on the classical conditions of conformer stability. The distance between the -C2H3 groups being maximised in the anti-periplanar arrangement, minimizes destabilising van der Waals and Pauli interactions between them. This approach however is not the whole story, as demonstrated by the work of Gung et al.[7] where the gauche conformation was found to have the lowest energy. A suggested explanation for this is a stabilizing interaction between the π electrons in the carbon-carbon double bond and the vinyl proton in close proximity, the so-called CH-π interaction.[6] Furthermore there is also a stabilizing interaction between the two π systems on the conformer[7], this interaction can clearly be seen in Figure 5 where the two MOs join. To confuse the issue further, a more sophisticated study intended to follow up on Gung's work found no lowest energy conformer, instead finding all 10 to be degenerate[6]. With this in mind, the structures of the remaining 8 conformers were optimised and assigned to a point group, again using the 3-21G basis set. The results are shown in Table 2, the torsional angle consisting of the 4 central atoms is labelled.
One interesting result obtained was that using the initial settings for conformers G3 and G5 the same optimized structure was found. In order to check if this was an error, both calculations were repeated. However the results were exactly the same as those obtained in the initial attempt. This means that the structure gauche3[8] in the manual's appendix was identified twice while gauche[8] was not found at all. A possible explanation for this is that, since the conformations are near degenerate in energy[6], the 3-21G basis set is not accurate enough to distinguish both minima and as a result collapses to the same one in both cases.
| Conformer | TC1-C2-C3-C4 | TC2-C3-C4-C5 | TC3-C4-C5-C6 |
|---|---|---|---|
| A1 | 116.0 | 176.8 | 116.0 |
| A2 | -64.1 | 180.0 | 115.9 |
| A3 | 116.1 | 178.3 | 0.2 |
| A4 | 0.0 | 180.0 | 0.0 |
| G1 | 119.1 | -115.5 | 119.1 |
| G2 | 111.5 | 60.6 | 111.5 |
| G3 | 117.9 | 64.8 | -63.2 |
| G4 | 8.8 | 71.2 | 120.2 |
| G5 | -174.8 | -110.3 | 133.2 |
| G6 | -179.8 | 74.4 | -179.8 |
| Conformer | A1 | A2 | A3 | A4 | G1 | G2 | G3 | G4 | G5 | G6 | ||||||||||||||||||||
|---|---|---|---|---|---|---|---|---|---|---|---|---|---|---|---|---|---|---|---|---|---|---|---|---|---|---|---|---|---|---|
| 3D Model | ||||||||||||||||||||||||||||||
| Energy / hartrees | -231.69260235 | -231.69253519 | -231.69097057 | -231.68907060 | -231.69166702 | -231.69153031 | -231.69266122 | -231.68961571 | -231.69266121 | -231.68916019 | ||||||||||||||||||||
| Point Group | C2 | Ci | C1 | C2h | C2 | C2 | C1 | C1 | C1 | C1 | ||||||||||||||||||||
| Appendix[8] structure | anti1 | anti2 | anti4 | anti3 | gauche2 | gauche4 | gauche3 | gauche5 | gauche3 | gauche6 | ||||||||||||||||||||
| Energy Difference from Appendix[8] Value / hartrees | 0 | 0 | 0 | 0 | 0 | 0 | 0 | 0 | 0 | 0 | ||||||||||||||||||||
| Relative Energy to G3/ hartrees | 0.05887 | 0.12603 | 1.69065 | 3.59061999 | 0.9942 | 1.13091 | 0.0 | 3.04551 | 0.00001 | 3.50103 | ||||||||||||||||||||
| Lowest Energy? |
Re-Optimisation of the Using the 6-31G* Basis Set
In order to get a more accurate energy calculation of the A2 conformer, another optimization to a minimum was carried out. The B3LYP method was used with a 6-31G* basis set. The results are summarized in Table 3.
| Basis Set | 3-21G | 6-31G* | Difference | ||||
|---|---|---|---|---|---|---|---|
| Model | C-C bonds are 0.01 Å longer in the B3LYP/6-31G(d) simulation, while C-H bonds are 0.02 Å longer. | ||||||
| TC1-C2-C3-C4 | 114.6° | 118.6° | 4.0° | ||||
| TC2-C3-C4-C5 | 180° | 180° | 0.0° | ||||
| TC3-C4-C5-C6 | -114.6° | -118.6° | -4.0° | ||||
| Energy / hartrees | -231.69253519 | -234.61171062 | -2.91917543 | ||||
| Energy Difference from Appendix[8] value / hartrees | 0 | 1 × 10⁻⁶ |
It is clear from this that while the structure, especially with regards to bond length, is virtually unchanged, the energy difference is more significant. This means that while structures obtained with different basis sets may be comparable, the energies are not.
Out of interest, the G3 and G5 conformers were also re-optimized using this method. This was done due to the fact that previously they had both converged on the same conformer. Perhaps a more accurate basis set would find the distinction that was sought. However the results are largely the same as before, only shifted in either energy or angle. This leads me to conclude that the initial state of the conformers is too similar to find the separate conformations.
| Conformer | Energy | TC1-C2-C3-C4 | TC2-C3-C4-C5 | TC3-C4-C5-C6 | Point Goup |
|---|---|---|---|---|---|
| G3 | -234.61132605 | 122.46 | 66.33 | -119.75 | C1 |
| G5 | -234.61132604 | 122.46 | 66.33 | -119.72 | C1 |
In order to allow comparison with experimental values, a frequency calculation was carried out at both 0.100 K and 298.150 K on the HF/3-21G and B3LYP/6-31G* optimized structures. The resulting IR spectra at 298.150 K is shown in figures 6 and 7 while Table 5 shows the energetic results of the A2 conformer.
| Energy | 0.100 K / 3-21G | Difference from Appendix[8] | 0.100 K / 6-31G* | Difference from Appendix[8] value | 298.150 K / 3-21G | Difference from Appendix[8] | 298.150 K / 6-31G* | Difference from Appendix[8] value |
|---|---|---|---|---|---|---|---|---|
| Electronic + Zero Point Energy / hartrees | -231.539542 | -234.469219 | 1.6×10⁻⁵ | -231.539542 | -234.469219 | |||
| Electronic + Thermal Energy / hartrees | -231.539541 | -234.469218 | -231.532568 | -234.461869 | 1.3×10⁻⁵ | |||
| Electronic + Thermal Enthalpy / hartrees | -231.539541 | -234.469218 | -231.531624 | -234.460925 | ||||
| Electronic + Thermal Free Energy / hartrees | -231.539541 | -234.469218 | -231.570915 | -234.500809 |
The frequency analysis of the A2 and G3 conformers found 42 vibrations all of which were positive. This is an important observation as it proves that our molecule's conformation is in fact at a minimum. Though 42 vibrations were located by Gaussian, only 21 can be seen the the IR spectrum of the A2 conformer. These seemingly invisible peaks correspond to vibrations that do not lead to a change in the dipole moment of a molecule and are as a result not IR active. It is an interesting observation that the G3 conformation has some differences in the IR spectrum. 42 vibrations were still detected, and all could be seen on the IR spectrum this time. An example is the C=C symmetrical and asymmetrical stretches. In the A2 conformer the C=C symmetrical stretch does not lead to a change in the dipole moment and is as a result not IR active, while in the G3 conformer the opposite is true. Furthermore the intensity of the C=C asymmetrical absorption in the A2 conformer is about three times the intensity it is in the G3 conformer, due to the change in dipole moment being greater. The location of these peaks is largely unchanged.
| A2 | G3 | Literature | |
| Spectra | 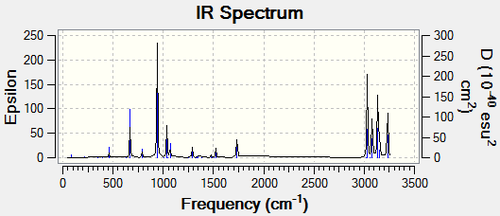 |
 |
Lit IR Spec |
| Symmetrical C=C Stretch Intensity | 0.0 | 6.75 | |
| Symmetrical C=C Stretch Frequency (cm-1) | 1731.23 | 1731.83 | |
| gif link | here | here | |
| Asymmetrical C=C Stretch Intensity | 18.14 | 6.28 | |
| Asymmetrical C=C Stretch Frequency (cm-1) | 1734.47 | 1732.71 | |
| gif link | here | here |
Optimization of Chair and Boat Transition Structures
The problem of locating and optimizing the transition structures of the Cope rearrangement was tackled in 4 distinct ways, consisting of the Berny, Frozen Coordinate, QST2 and QST3 methods. All of these, save QST2, require a guess of the transition structure and as a result this was the first challenge faced.
While mechanism is not necessarily concerted or synchronous, the transition state will always contain at least 4 C-C σ bonds. These are spread evenly between 2 'fragments', which may be then be joined by further σ bonds such as in the case of the biradical intermediate. A simple representation of this is obtained when 1,5-hexadiene has its central C-C bond heterolytically cleaved to produce 2 allyls. Unsurprisingly, the allyl was also the molecule used to guess the transition structure, it was optimized using the HF/3-21G level of theory (Figure 8) and then replicated.
|
|
While looking for the chair transition state the two fragments were orientated in such a way as to be more similar to it rather than the boat ie they had an axis of symmetry running between them rather than a plane, and were spaced 2.2 Å apart between the carbon atoms undergoing bond formation, this is shown in Figure 9. A Berny optimization was performed using the Hartree-Fock method and 3-21G basis set. Force constants were calculated once. The resulting transition state (Figure 10) had a single imaginary frequency of -817.75 cm-1, this is indicative of a saddle point along the reaction coordinate and therefore the transition state. The vibration corresponding to this frequency can be seen in Figure 11.

Figure 10: Chair Transition State from Berny Optimization |
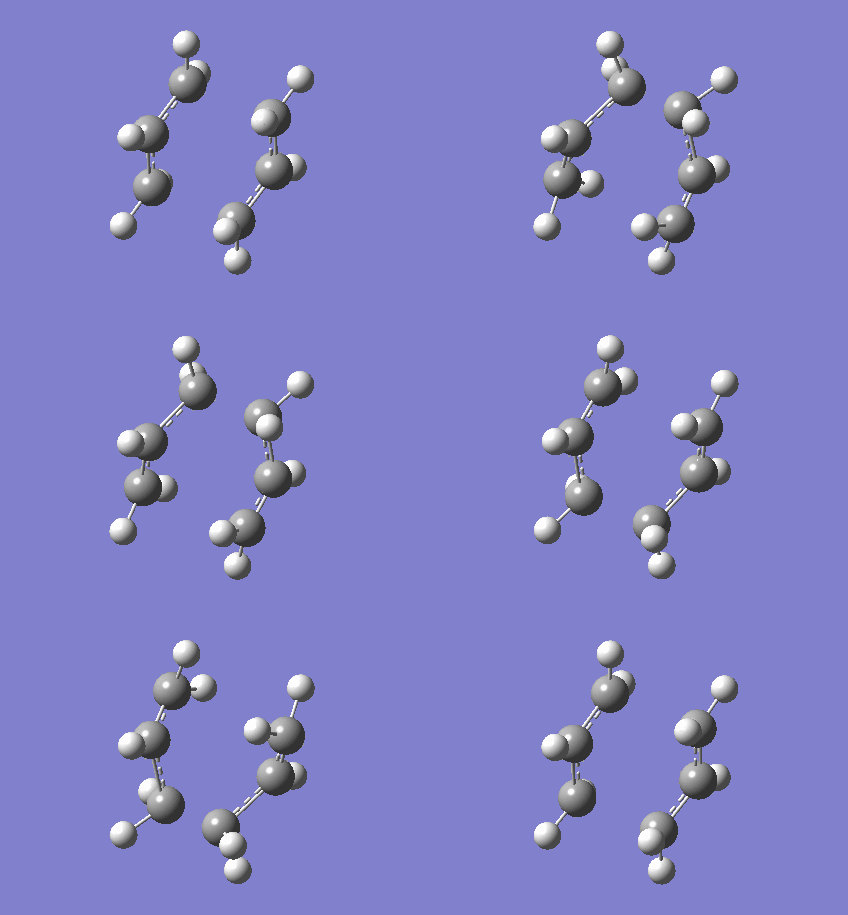
The next method used to obtain an optimized chair structure was the Frozen Coordinate Method. The same initial guess was used as with the Berny optimization. This method first optimizes the test molecule while keeping the bond forming/breaking distances constant, in order to generate a more accurate guess of the transition structure. In this case it was the bond distance between the terminal carbon atoms of the two allyl fragments at 2.2 Å. The result of this optimization using HF/3-21G can be seen in Figure 12. The atom distance was then unfrozen, and a Berny optimization was performed. This was performed using the same level of theory as before and the result can be seen in Figure 13. A single imaginary frequency was found again, in good agreement with the previous result, at -817.89 cm-1. The corresponding vibration can be seen in Figure 14. The Berny optimization was then performed again but at 0.1 K, these results are shown in the Discussion section.
|
|
The Boat transition structure was found using the QST2 and QST3 methods. These are both conceptually easy to grasp. In the case of QST2 the user provides the structures of the product and reactant molecules and the algorithm attempts to find the transition state. With QST3 a guess of the transition state is also provided in addition to the products and reactants. Initially an unsuccessful attempt to find the transition structure through QST2 was performed. The 6-31G* optimized A2 conformer was used as both the reactant and product, with the numbering in the product molecule having to be altered to correspond to the Cope Rearrangement. This can be seen in Figure 15 along with the failed transition state in Figure 16, obtained using HF/3-21G.
|
Figure 16: Transition State from Initial QST2 Attempt |
The failure arose from the fact that the QST2 method attempted to simply translate parts of the structure without considering rotation about the central C-C bond. In order to correct this the central dihedral angle was changed to 0° while the internal C-C-C bonds were changed to 100°, in both the reactant and product, thereby making them closer to the boat transition state. The optimization was then performed again, this time successfully finding the boat transition state with one imaginary frequency at -552.56 cm-1, which can be seen in Figure 18.
|
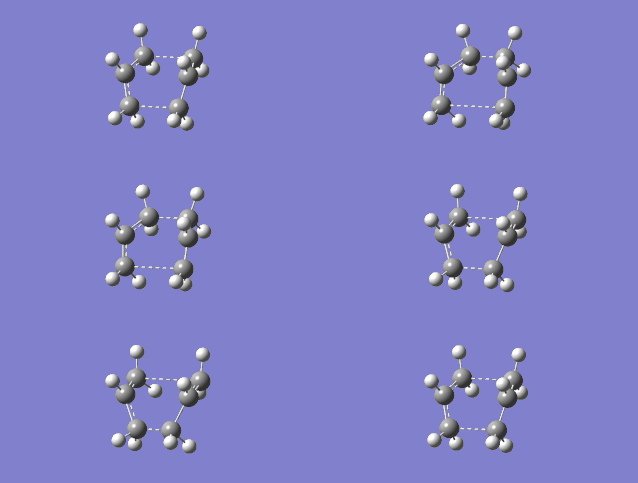
Figure 18: Boat Transition State from QST2 |
The final attempt at finding transition structures was performed with the QTS3 method in an attempt to find the boat transition state using HF/3-21G. The same structure for product and reactant shown in Figure 17 was used, along with the transition structure obtained from the QST2 method. The resulting transition state, shown in Figure 20, had an imaginary frequency at -840.33 cm-1. Its corresponding vibration is shown in Figure 21. The QST3 method was then repeated at 0.1 K (see Discussion).
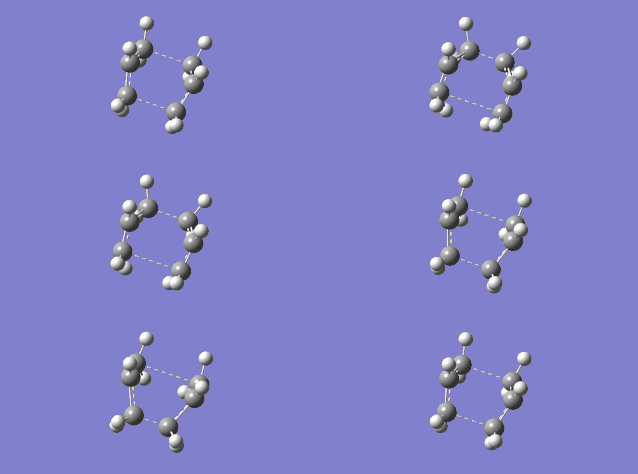
Figure 20: Boat Transition State from QST3 |
Connecting Transition States with Reactants and Products with IRC Method
In order to find which conformers undergo the Cope Rearrangement and through which transition state the IRC method was utilized. It takes small geometrical steps along the path of the steepest energy gradient.
Due to the reaction coordinate being symmetrical the IRC was only computed in the forward direction. 50 points were initially selected along the IRC with force constants calculated at every step. There is the option to calculate force constants fewer times to improve calculation speed, however at the level of theory used this was not an issue. Furthermore the provided instructions said to "calculate force constants always" when doing this IRC calculation, later they say that selecting "force constants always" is a way of improving the accuracy of our results (under the assumption that this was not done in the original IRC calculation). The conformer resulting from this IRC calculation was optimized to a minimum to check that this is indeed the product of our reaction. The optimization was performed using the Hartree-Fock method and 3-21G level of theory. Another possible way of getting this product is running the IRC calculation for more steps.

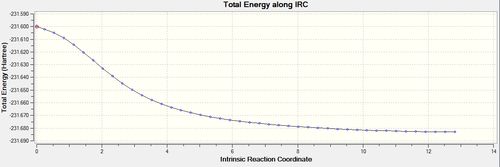

This procedure was then repeated with the boat conformer obtained by using the QST3 method and the result is shown in the figures below. 100 steps were taken to ensure the minimum was reached and the resulting structure was optimized to a minimum with the HF/3-21G method. It is likely the minimum was reached at this point as the RMS gradient was 0.00000777.


In order to calculate the activation energy of this reaction to a reasonable degree of accuracy, the boat and chair transition states were re-optimized to a minimum using the B3LYP/6-31G* level of theory at both 0.1 K and 298.15 K starting from the 3-21G structures. The results are shown in figures 22 and 23.
|
|
The energies of the various transition states found through the above simulations are shown in tables below.
| Energy | Chair / Berny | Chair / FCM | Boat / QST2 | Boat / QST3 |
|---|---|---|---|---|
| Total / hartrees | -231.61932220 | -231.61932233 | -234.55864003 | -231.60280230 |
| Electronic + Zero Point Energy / hartrees | -231.466698 | -231.466705 | -234.418373 | -231.450914 |
| Electronic + Thermal Energy / hartrees | -231.461339 | -231.461345 | -234.411995 | -231.445284 |
| Electronic + Thermal Enthalpy / hartrees | -231.460395 | -231.460401 | -234.411051 | -231.444340 |
| Electronic + Thermal Free Energy / hartrees | -231.495203 | -231.495212 | -234.447821 | -231.479761 |
| Energy | Chair / FCM | Boat / QST3 |
|---|---|---|
| Total / hartrees | -231.61932233 | -231.60280230 |
| Electronic + Zero Point Energy / hartrees | -231.466705 | -231.450914 |
| Electronic + Thermal Energy / hartrees | -231.466704 | -231.450913 |
| Electronic + Thermal Enthalpy / hartrees | -231.466704 | -231.450913 |
| Electronic + Thermal Free Energy / hartrees | -231.466704 | -231.450913 |
| Imaginary Frequency / cm-1 | -817.89 | -840.33 |
| Energy | Chair | Boat |
|---|---|---|
| Total/ hartrees | -234.55693104 | -234.54307882 |
| Electronic + Zero Point Energy / hartrees | -234.414908 | -234.402356 |
| Electronic + Thermal Energy / hartrees | -234.408980 | -234.396012 |
| Electronic + Thermal Enthalpy / hartrees | -234.408035 | -234.395068 |
| Electronic + Thermal Free Energy / hartrees | -234.443801 | -234.431780 |
| Imaginary Frequency / cm-1 | -569.31 | -532.18 |
| Energy | Chair | Boat |
|---|---|---|
| Total / hartrees | -234.55693104 | -234.54307881 |
| Electronic + Zero Point Energy / hartrees | -234.414908 | -234.402354 |
| Electronic + Thermal Energy / hartrees | -234.414907 | -234.402353 |
| Electronic + Thermal Enthalpy / hartrees | -234.414907 | -234.402353 |
| Electronic + Thermal Free Energy / hartrees | -234.414907 | -234.402353 |
| Imaginary Frequency / cm-1 | -569.31 | -532.34 |
Discussion and Conclusion
In order to find the activation energy of the Cope Rearrangement when done by the A2 conformer, via either the chair or boat transition state, the difference of the between the sums of electronic and thermal energies of the conformer and the transition states was found. Table 9 summarizes these results.
| Temperature / Method | Chair | Boat |
|---|---|---|
| 0.1 K / HF/3-21G | 0.072837 | 0.088628 |
| 298.15 K / HF/3-21G | 0.071223 | 0.087284 |
| 0.1 K / B3LYP/6-31G(d) | 0.054311 | 0.066865 |
| 298.15 K / B3LYP/6-31G(d) | 0.052889 | 0.065857 |
| Temperature / Method | Chair | Difference from Appendix[8] | Difference from Experiment[8] | Boat | Difference from Appendix[8] | Difference from Experiment[8] |
|---|---|---|---|---|---|---|
| 0.1 K / HF/3-21G | 45.7059173 | 0.01 | 12.2 ± 0.5 | 55.6149215 | 0.01 | 10.91 ± 2.0 |
| 298.15 K / HF/3-21G | 44.6931168 | 0 | 54.77154863 | 0.01 | ||
| 0.1 K / B3LYP/6-31G(d) | 34.08067432 | 0.02 | 0.9 ± 0.5 | 41.9584299 | 0 | 2.7 ± 2.0 |
| 298.15 K / B3LYP/6-31G(d) | 33.1883557 | 0.02 | 41.32590026 | 0.01 |
The results show good agreement with both provided computational values and experimental values. The benefit of using a more complete basis set is clear, the B3LYP/6-31G(d) values are significantly closer to experiment than the corresponding HF/2-31G results. Using the data above it is also clear that the chair transition state is the more stable one, and as a result the reaction will usually proceed via this transition state.
Part 2: Diels-Alder Reaction
Introduction


The Diels-Alder reaction belongs to a class of reactions known as [6πs + 2πs] cycloadditions. These proceed via a concerted mechanism leading to a stabilized aromatic transition state and lead to a stable product as 2 π C-C bonds are sacrificed to make 2 σ C-C bonds. This reaction becomes more interesting when substituted reagents are used. If these are asymmetrical the reaction can lead to two different products, each via its own transition state. The products differ in energy with the lower more exothermic one being named the EXO product and the higher energy more endothermic one being termed the ENDO product. The difference in product energy is mainly a result of steric interactions. The transition state of the more cluttered ENDO product experiences a stabilizing MO interaction causing it to be lower in energy and making the ENDO product the kinetic product, as a result at low temperatures it compromises a majority of the yield.
The transition state adopts an envelope-like structure as this path leads to maximum overlap between reagent's HOMOs and LUMOs.
Ethene and Butadiene
The simplest form of the Diels-Alder reaction is between ethene and butadiene.
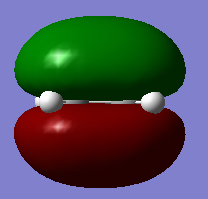
The structures of ethene, butadiene and cyclohexene were optimized to a minimum in a number of ways. Initial an optimization to a minimum was performed using the HF/3-21G method to perform a quick scan of the energy surface. Once complete the structures were optimized again using B3LYP/6-31G(d) to get more accurate values of their properties. Finally the semi-empirical AM1 method was used, which incorporates actual data into the calculations for heightened accuracy. Frequency calculations were also performed in order to get obtain zero-point and thermal energies and hence allow activation energy calculation. The B3LYP structures along with the HOMOs and LUMOs are shown in figures 26 through to 31, while the energies are in tables 12 and 13. Butadiene was chosen to be in the cis-conformation as this is necessary for it to undergo the Diels-Alder addition.
| HF/3-21G | HF/3-21G | HF/3-21G | B3LYP/6-31G(d) | B3LYP/6-31G(d) | B3LYP/6-31G(d) | |
|---|---|---|---|---|---|---|
| Energy | Ethene | Butadiene | Cyclohexene | Ethene | Butadiene | Cyclohexene |
| Total / hartrees | -77.60098814 | -154.05394316 | -231.72915146 | -78.58745865 | -155.98595128 | -234.64829628 |
| Electronic + Zero Point Energy / hartrees | -77.545906 | -153.962189 | -231.571760 | -78.536236 | -155.900838 | -234.501355 |
| Electronic + Thermal Energy / hartrees | -77.542949 | -153.958406 | -231.566590 | -78.533194 | -155.896794 | -234.495863 |
| Electronic + Thermal Enthalpy / hartrees | -77.542005 | -153.957462 | -231.565645 | -78.532250 | -155.895850 | -234.494919 |
| Electronic + Thermal Free Energy / hartrees | -77.566725 | -153.987457 | -231.599568 | -78.557111 | -155.926256 | -234.529336 |
| Ethene | Butadiene | |
| E(RAM1) / hartress | -0.02619028 | -0.04879719 |
| Electronic + Zero Point Energy / hartrees | -0.077198 | -0.134552 |
| Electronic + Thermal Energy / hartrees | -0.080252 | -0.138573 |
| Electronic + Thermal Enthalpy / hartrees | -0.081196 | -0.139517 |
| Electronic + Thermal Free Energy / hartrees | -0.056314 | -0.109172 |
There is a very large difference between the energy values given by the B3LYP/6-31G level of theory and semi-empirical methods. This is because the absolute energy calculated by the various methods is relatively meaningless, only the relative energies between molecules are important. These stay about the same regardless of method.
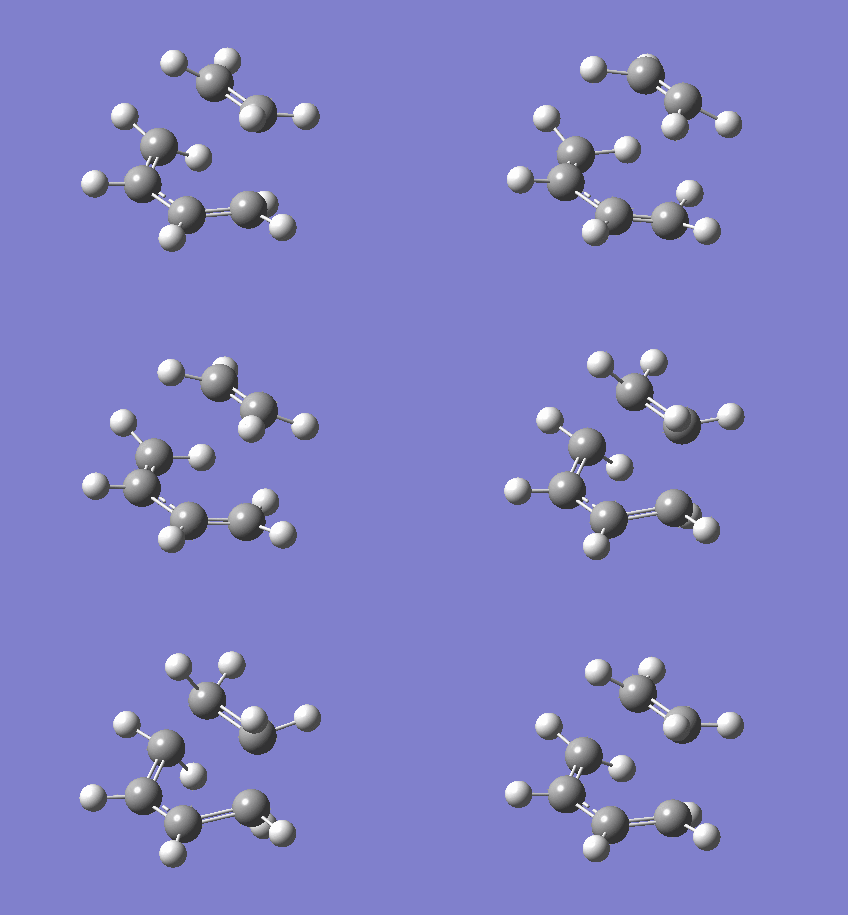
Using the 3 structures optimized above, the QST2 and QST3 methods were applied in an attempt to find the transition structure. This was performed using HF/3-21G level of theory. The transition structure was then re-optimized to a minimum using B3LYP/6-31G(d). Both these methods failed to provide a reasonable transition state however and as a result the Frozen Coordinate Method was utilized. Initially the bond distance between the carbon atom where bond forming occurs was frozen at approximately 2.1 Å and the rest of the structure was optimized to a minimum using the Semi-Empirical AM1 method. The resulting structure was then optimized to a transition state using the Berny algorithm with the Semi-Empirical AM1 method. Frequency constants were calculated once and the opt=noeigen keyword was used. The resulting transition state had a single imaginary frequency at -956.41 cm-1, showing that the stationary point along the reaction path and therefore the transition state was indeed located. The corresponding vibration, shown in Figure 32, clearly corresponds to the Diels-Alder Addition. The energies resulting from this calculation are shown in Table 14.
| E(RAM1) / hartrees | -0.11165466 |
| Electronic + Zero Point Energy / hartrees | -0.253276 |
| Electronic + Thermal Energy / hartrees | -0.259453 |
| Electronic + Thermal Enthalpy / hartrees | -0.260397 |
| Electronic + Thermal Free Energy / hartrees | -0.224016 |
| E(RAM1) / hartrees | -234.54388552 |
| Electronic + Zero Point Energy / hartrees | -234.403327 |
| Electronic + Thermal Energy / hartrees | -234.396906 |
| Electronic + Thermal Enthalpy / hartrees | -234.395962 |
| Electronic + Thermal Free Energy / hartrees | -234.432899 |
Figure 33: Transition State of Simple Diels-Alder |
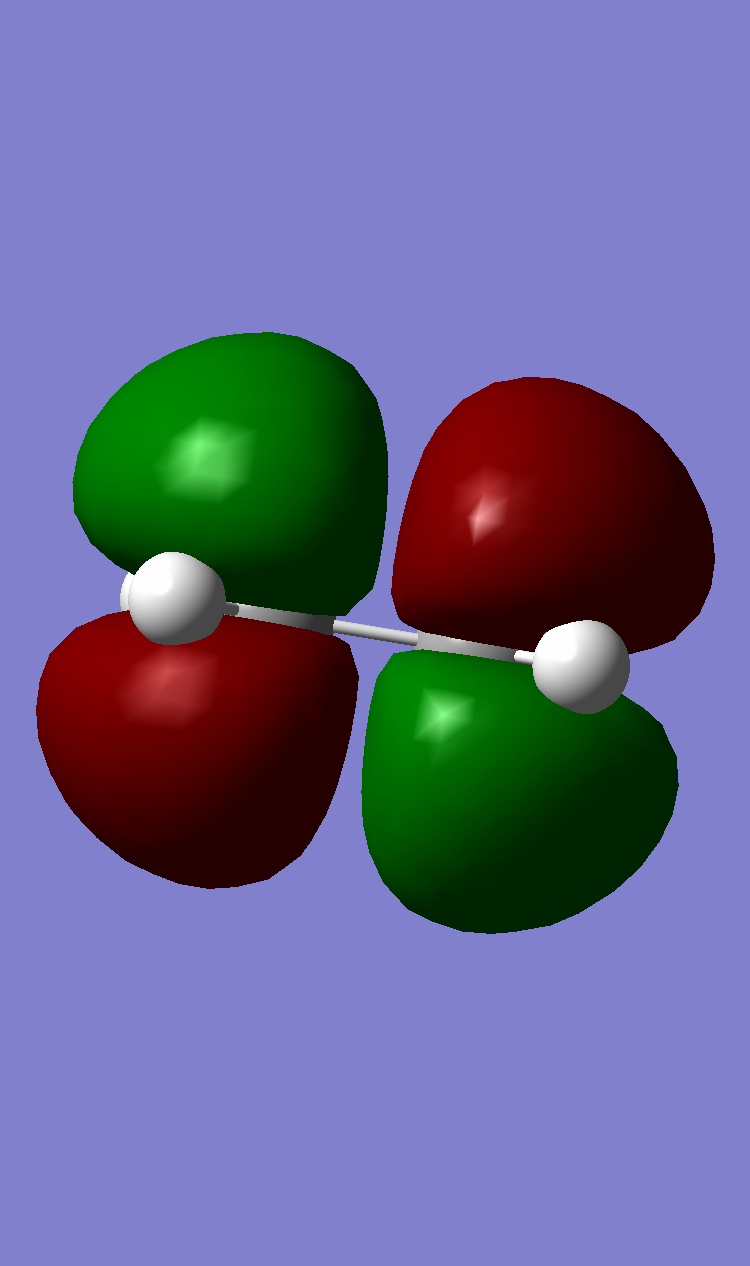
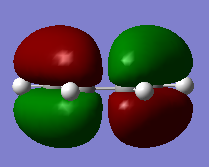
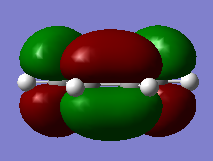
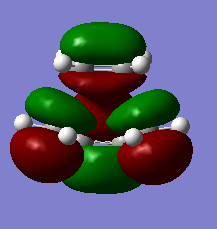
The HOMO and LUMO of the transition state are shown and assigned symmetry in the figures below. This assignment of symmetry is important because according to the Woodward-Hoffmann rules, for a reaction to be allowed under thermal conditions, the HOMO of the dienophile and LUMO of the diene must be of the same symmetry and so must the LUMO of the dienophile and HOMO of the diene. This is in fact the state of the MOs as calculated above. In the TS the HOMO is clearly formed from the overlap of ethenes LUMO and butadienes HOMO. The LUMO of the TS is formed by ethenes HOMO and butadienes LUMO.
 |
 |
The first step to calculating the activation energies energies for this reaction was finding the combined total of electronic and thermal energies of ethene and butadiene. The difference of this value with the TS energy was found for the B3LYP/6-31G(d) level of theory. However the semi-empirical method result shows that the 'transition state' is in fact lower in energy than the reactants. Perhaps it was not found after all. Multiple attempts were made with different frozen bond distances but led to no success.
The activation energy for the B3LYP/6-31G method was 0.033082 hartrees, which is 20.7592729 kcal/mol at 298 K. Due to no experimental reference at this temperature being found. The simulations were repeated at 0K. The results are tabulated below:
| E / hartrees | -234.54388552 |
| Electronic + Zero Point Energy / hartrees | -234.403327 |
| Electronic + Thermal Energy / hartrees | -234.403326 |
| Electronic + Thermal Enthalpy / hartrees | -234.403326 |
| Electronic + Thermal Free Energy / hartrees | -234.403326 |
| Ethene | Butadiene | |
| E / hartrees | -78.58745865 | -155.98595128 |
| Electronic + Zero Point Energy / hartrees | -78.536236 | -155.900838 |
| Electronic + Thermal Energy / hartrees | -78.536235 | -155.900837 |
| Electronic + Thermal Enthalpy / hartrees | -78.536234 | -155.900836 |
| Electronic + Thermal Free Energy / hartrees | -78.536232 | -155.900836 |
The activation energy at 0 K therefore was calculated to be 0.033746 hartrees or 21.1759392 kcal/mol. This is in good agreement with experimental values which place the activation energy at 25.1 kcal/mol at 0K[9].
Cyclohexa-1,3-diene and Maleic Anhydride: A Regioselectivity Study
Optimization of Reagents
As usual, before any transition states can be investigated the reactants themselves must be put in their ground state. As a result maleic anhydrdie and cyclohexa-1,3-diene were optimized to a minimum using HF/3-21G in order to scan the energy surface, then B3LYP/6-31G(d) to get a more accurate value for the minimum. Finally maleic anhydride was optimised using semi-empirical AM1 in order to get a more realistic result due to incorporation of empirical data.
The calculated energies are shown in Table 18.
| Maleic Anhydride | Cyclohexa-1,3-diene | |
| Total Energy / hartress | -377.23016622 | -233.41891187 |
| Electronic + Zero Point Energy / hartrees | -377.168952 | -233.296116 |
| Electronic + Thermal Energy / hartrees | -377.164093 | -233.290937 |
| Electronic + Thermal Enthalpy / hartrees | -377.163149 | -233.289993 |
| Electronic + Thermal Free Energy / hartrees | -377.197807 | -233.324374 |
| Maleic Anhydride | Cyclohexa-1,3-diene | |
| Total Energy / hartress | -0.12182324 | 0.02771129 |
| Electronic + Zero Point Energy / hartrees | -0.063343 | 0.152502 |
| Electronic + Thermal Energy / hartrees | -0.058188 | 0.157726 |
| Electronic + Thermal Enthalpy / hartrees | -0.057244 | 0.158670 |
| Electronic + Thermal Free Energy / hartrees | -0.092497 | 0.123833 |
Finding the EXO Transition State
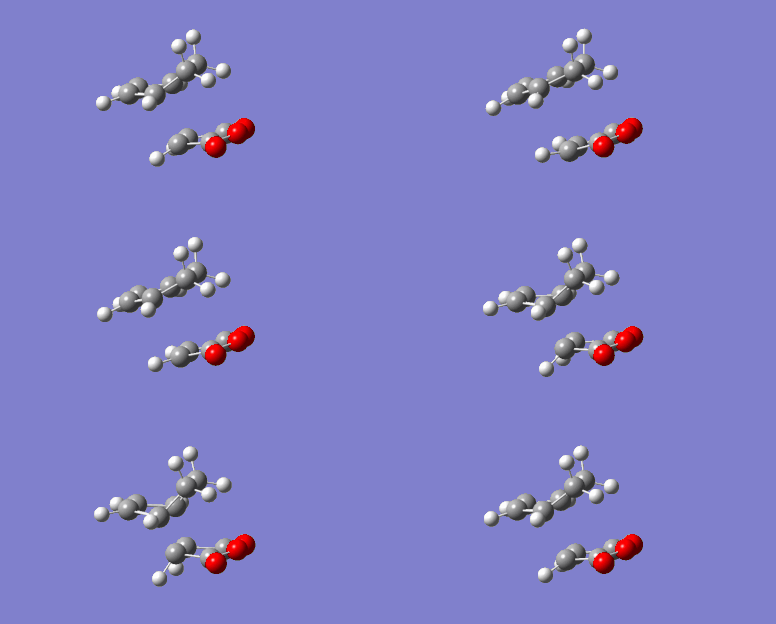
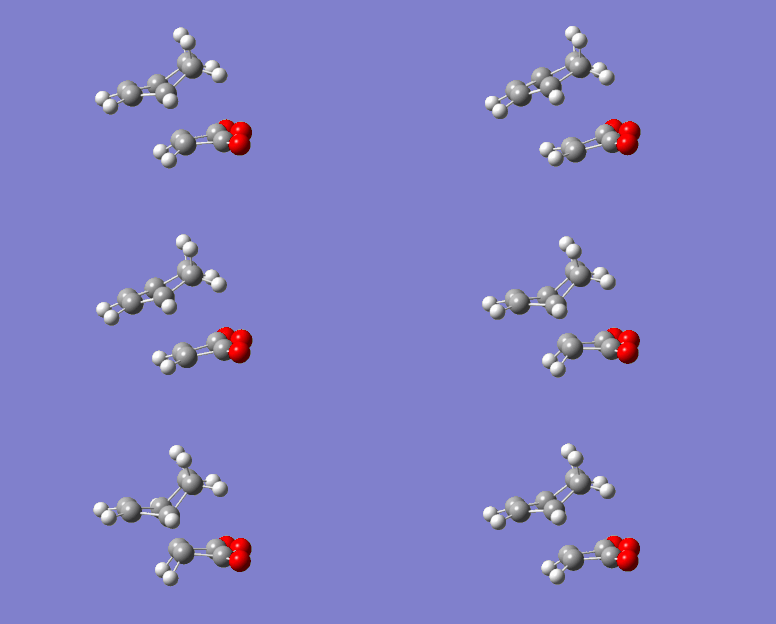
The search for the EXO transition structure of this Diels-Alder reaction was performed using the Frozen Coordinate Method. The initial structure is shown in Figure 36. The bond distances calculated in the figure correspond to the frozen bonds. The calculation was performed using the HF/3-21G method and involved the minimization of the energy of the molecule. The result of this minimization was then optimized to a TS using the Berny algorithm both HF/3-21G, B3LYP/6-31G(d) and Semi-Empirical/AM1 methods. Frequency constants were calculated once and therefore the opt=noeigen keyword was used. The resulting energies are shown in Table 21. All methods provided a single imaginary frequency, though of different magnitudes: -648.16 cm-1 for HF/3-21G,-448.26 cm-1 for B3LYP/6-31G(d) and for -812.36 cm-1 semi-emprical/AM1. The corresponding vibrations are shown in figures 35 and 36 and it can be seen that in both cases they correspond to the Diels-Alder bond formation. The semi-emperical/AM1 vibration was also identical. The transition states are all shown in the figures below with the bond formation lengths shown for comparison.
Figure 36: Initial Guess of EXO TS |
| HF/3-21 | B3LYP/6-31G(d) | Semi-Empirical/AM1 | |
| Total Energy / hartress | -605.60359129 | -612.67933539 | -0.05041975 |
| Electronic + Zero Point Energy / hartrees | -605.408136 | -612.498005 | -0.134881 |
| Electronic + Thermal Energy / hartrees | -605.398677 | -612.487669 | -0.144882 |
| Electronic + Thermal Enthalpy / hartrees | -605.397733 | -612.486725 | -0.145826 |
| Electronic + Thermal Free Energy / hartrees | -605.443684 | -612.534189 | -0.099117 |
|
| ||||||
|
Finding the ENDO Transition State
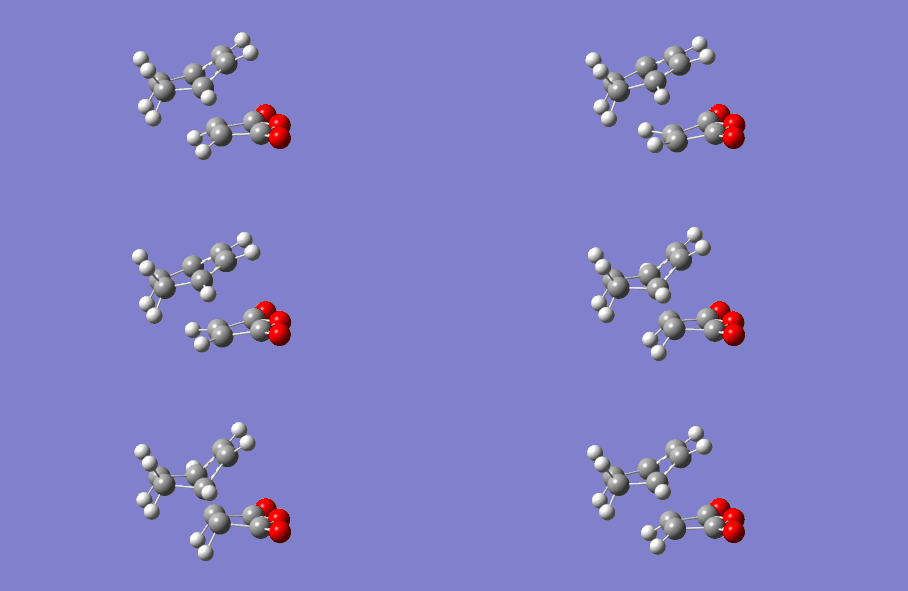
The ENDO transition state was found in the same way as the EXO, using the Frozen Coordiante Method. The intial settings are shown in Figure 42, with the frozen distances again shown by default. The initial minimization of structure energy was performed using HF/3-21G and the result was then optimized to a transition state using the Berny algorithm with both HF/3-21G, B3LYP/6-31G(d) methods and Semi-Empirical/AM1 methods. In all cases a single imaginary frequency was found with magnitudes: -643.54 cm-1 (HF/3-21G), -446.71 cm-1 (B3LYP/6-31G) and -806.03 cm-1 (Semi-Empirical/AM1). The vibrations in all cases corresponded to the bond formation of a Diels-Alder reaction.
Figure 42: ENDO TS Initial Guess |
|
| ||||||
|
The energies obtained using both methods are detailed in Table 22.
| HF/3-21 | B3LYP/6-31G(d) | SE/AM1 | |
| Total Energy / hartress | -605.61036823 | -612.68339575 | -0.05150479 |
| Electronic + Zero Point Energy / hartrees | -605.414904 | -612.502208 | -0.133493 |
| Electronic + Thermal Energy / hartrees | -605.405478 | -612.491837 | -0.143683 |
| Electronic + Thermal Enthalpy / hartrees | -605.404534 | -612.490893 | -0.144627 |
| Electronic + Thermal Free Energy / hartrees | -605.450133 | -612.538434 | -0.097349 |
Discussion
Using SE/AM1 the calculate activation energies are found to be at 298.15 K:
| EXO | 0.24442 hartrees | 153.375898 kcal/mol |
| ENDO | 0.243221 hartrees | 152.6235144 kcal/mol |
The lower activation energy of the ENDO TS shows that the ENDO product is the kinetic product.
The activation energies were calculated as before and the same result as in the ethene + butadiene case was found, the TS was lower in energy than the sum of the products. The experiment should be repeated with better parametrization.
The total energy and hence activation energy of the ENDO TS was found to be lower in energy than the EXO TS with using all of the above calculations, this is summarized in the table below.
| HF/3-21 | B3LYP/6-31G(d) | SE/AM1 | |
| TS Difference | -0.006801 | -0.004168 | -0.001199 |
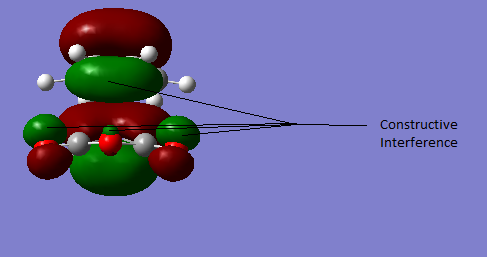
Perhaps somewhat surprisingly the endo, more sterically disfavoured, transition state is the more stable one. The reason for this is secondary orbital effects and can be seen in the figure below. The ENDO HOMO-1 ts is stabilized due to the constructive interference of the oxygen lone pair orbitals and the cyclohexene p-orbital system.
References
<references> Template loop detected: Template:Reflist
- ↑ Philip Pechukas (1981). "Transition State Theory". Annual Review of Physical Chemistry 32: 159-177. doi: 10.1146/annurev.pc.32.100181.001111.
- ↑ Arthur Cope, Elizabeth Hardy (1940). "The Introduction of Substituted Vinyl Groups. V. A Rearrangement Involving the Migration of an Allyl Group in a Three-Carbon System". J. Am. Chem. Soc 62(2): 441–444. doi: 10.1021/ja01859a055.
- ↑ Robert Woodward, Roald Hoffmann (1965). "Stereochemistry of Electrocyclic Reactions". J. Am. Chem. Soc 87(2): 395–397. doi: 10.1021/ja01080a054.
- ↑ Weston Borden, Richard Loncharich, K. Houk (1988). "Cope Rearrangement of 1,5-Hexadiene: Full Geometry Optimizations Using Analytic MR-CISD and MR-AQCC Gradient Methods". The Journal of Physical Chemistry A 107(8): 1175–1180. doi: 10.1021/jp0259014.
- ↑ Elizete Ventura, Silmar Andrade do Monte, Michal Dallos, Hans Lischka (2002). "Synchronicity in Multibond Reactions". Annual Review of Physical Chemistry 39: 213-236. doi: 10.1146/annurev.pc.39.100188.001241.
- ↑ 6.0 6.1 6.2 6.3 6.4 6.5 Brandon Rocque, Jason Gonzales, Henry Schaefer (2002). "An analysis of the conformers of 1,5-hexadiene". Molecular Physics 100(4): 441-446. doi: 10.1080/00268970110081412.
- ↑ 7.0 7.1 Benjamin Gung, Zhaohai Zhu, Rebecca Fouch (1994). "Conformational Study of 1 ,S-Hexadiene and 1,5-Diene-3,4-diols". J. Am. Chem. Soc 117(6): 1783–1788. doi: 10.1021/ja00111a016.
- ↑ 8.00 8.01 8.02 8.03 8.04 8.05 8.06 8.07 8.08 8.09 8.10 8.11 8.12 https://wiki.ch.ic.ac.uk/wiki/index.php?title=Mod:phys3#Appendix_1 - date accessed: 1/11/2014
- ↑ D. Rowley, H. Steiner (1951). "Kinetics of Diene Reactions at High Temperatures". Discuss. Faraday Soc. 10: 198-213.

