Rep:Mod:hdywn47d533
Module 2 - Michael Hurhangee
Introduction
Investigation of molecular Borane - BH3
The purpose of this computational experiment is to investigate the optimised structure, vibrations and molecular orbits of molecular gas-phase borane.
BH3 Optimisation
The first step in investigating borane is to find the lowest energy, i.e. the optimised, structure of molecular gas-phase borane (BH3). This is done using Gaussian with calculation method DFT-B3LYP and the basis set 3-21G. The summary file from the optimisation calculation is included below.
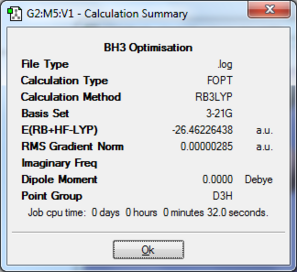
As can be seen above the summary the gradient of the is very small (i.e. less than 0.001) and therefore it is likely that the structure has been optimised. To check this further the output file from Gaussian can be analysed.
         Item               Value     Threshold  Converged?
 Maximum Force            0.000006     0.000450     YES
 RMS     Force            0.000004     0.000300     YES
 Maximum Displacement     0.000022     0.001800     YES
 RMS     Displacement     0.000015     0.001200     YES
 Predicted change in Energy=-1.886451D-10
 Optimization completed.
    -- Stationary point found.
All the forces have converged, meaning no forces are acting on the molecular. In short the structure is optimised. Throughout this report/wiki everytime an optimisation was performed the gradient and convergences were checked to make sure that Gaussian had performed the optimisation correctly. Furthermore for each optimisation the graphs of the molecules energy vs opt. steps and root mean square forces vs opt. steps. These graphically representations of the optimisation are shown below

The total energy graph shows Gaussian travelling across the potential energy surface (PES) of the molecule, with the optimised structure being at a minima of the PES, this is why the gradient should be very small when the structure has optimised. The optimisation continues until the RMS gradient goes below a predefined limit and then stops, this also makes the energy its most negative. The way the molecules changes can also be watched in unison with the graphs to see how the energy changes with the molecules structure.
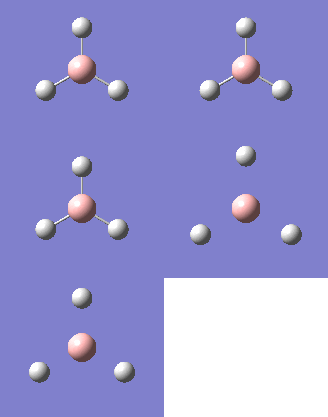
After all of this the final optimised structure of BH3 -
Bond length - 1.18-1.20Å
Bond Angle - 119.9-120.1o
Point group - D3h

Frequency analysis of Borane
During the above optimisation of borane a stationary point was found at which the gradient of the potential energy surface (PES) was close to 0. From mathematics it is known that a stationary point can be a maxima, minima or a point of inflection. Frequency analysis can be employed to check that the stationary point on the PES is minima. If all the vibrational frequencies are positive then we are at a minima.
The frequency analysis was performed on borane.
 Low frequencies ---   -0.6560   -0.0170   -0.0018   20.2020   21.4873   21.4974
 Low frequencies --- 1145.7147 1204.6590 1204.6600
The second line of Low frequencies are the vibrations in borane which have the lowest frequency. Since none of these values are negative the optimisation has found a minima on boranes PES.
N.B. that for frequency analysis following an optimisation it is important to use the same method and basis set. The method and basis method describe the electrons in a molecule in a particular manner, and then if you use different methods for the optimisation method and frequency analysis the molecule will be treated in a different manner each time. Ultimately making the results wrong as they have been produced in an inconsistent manner.
Frequency analysis also allows the vibrations to be visualised and produce a IR spectrum. This is done for borane below.
| Form of the vibration | Frequency | Intensity | Symmetry D3h |
|---|---|---|---|
 |
1146 | 93 | a2" |
 |
1205 | 12 | e' |
 |
1205 | 12 | e' |
 |
2593 | 0 | a1' |
 |
2731 | 104 | e' |
 |
2731 | 104 | e' |
The frequency of the vibrations have a systematic error present in them, which is from the harmonic model used to calculate their values. The error is about 10%, so all the values in the table could be up to about 10% out. Below is a computed IR spectrum of borane.
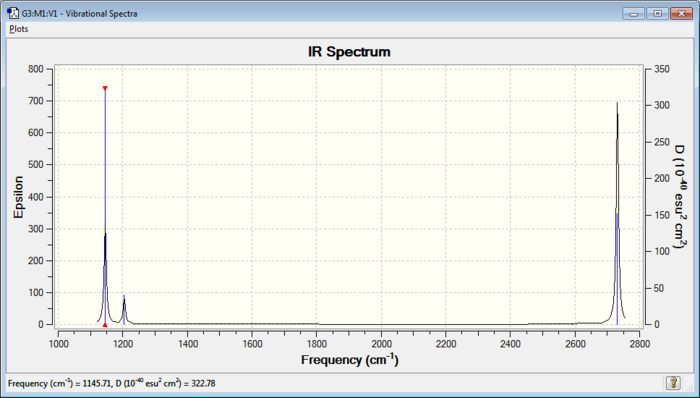
It can be seen in the above table that borane has 6 vibrations (3N-6), whilst the IR has only 3 discernible peaks. It can be seen that vibration #4 has an IR intensity of 0, making it IR inactive. This is because the stretch is symmetric (rest are asymmetric). The symmetric stretch results in no change in dipole moment of the molecule and thereofre cannot be seen by IR.
Furthermore, peaks 2 & 3 and peaks 5 & 6 are doubly degenerate, with both pairs having the label e'. Their degeneracy makes them have similar (i.e. non IR resolvable) peaks. There peaks therefore overlap and appear as only 1 between the pair.XXXXXXXXXXXXXXXXXXXXXXXXXXXXXXXXXXXXXXXXX
Natural bond orbital analysis
Natural bond orbital's (NBO) are formed from natural hybrid orbitals of atoms.[1] They take a delocalised MO and form a representation of 2e-2c bonding, which is favoured by "organic chemists". NBO's allow analysis of lewis acidity/basicity, electron deficiency/richness and hybridisation in a molecule.
NBO analysis was performed on BH3.
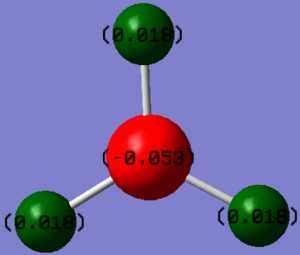
 Summary of Natural Population Analysis:
                                       Natural Population
                Natural  -----------------------------------------------
    Atom  No    Charge         Core      Valence    Rydberg      Total
 -----------------------------------------------------------------------
      B    1    0.33127      1.99904     2.66969    0.00000     4.66873
      H    2   -0.11042      0.00000     1.11010    0.00032     1.11042
      H    3   -0.11042      0.00000     1.11010    0.00032     1.11042
      H    4   -0.11042      0.00000     1.11010    0.00032     1.11042
 =======================================================================
   * Total *    0.00000      1.99904     6.00000    0.00097     8.00000
This summary of Natural Population Analysis shows the natural charge of the atoms in the molecules. It shows that borane is more slightly positive and hydrogen slightly negative. Reaffirming the view that boron is more electropositive than hydrogen. The electron deficiency at boron contributes to borane's well known lewis acidicity.
       (Occupancy)   Bond orbital/ Coefficients/ Hybrids
 ---------------------------------------------------------------------------------
     1. (1.99851) BD ( 1) B   1 - H   2
                ( 44.49%)   0.6670* B   1 s( 33.33%)p 2.00( 66.67%)
                                            0.0000  0.5774  0.0000  0.0000  0.0000
                                            0.8165  0.0000  0.0000  0.0000
                ( 55.51%)   0.7451* H   2 s(100.00%)
                                            1.0000  0.0000
     2. (1.99851) BD ( 1) B   1 - H   3
                ( 44.49%)   0.6670* B   1 s( 33.33%)p 2.00( 66.67%)
                                            0.0000  0.5774  0.0000 -0.7071  0.0000
                                           -0.4082  0.0000  0.0000  0.0000
                ( 55.51%)   0.7451* H   3 s(100.00%)
                                            1.0000  0.0000
     3. (1.99851) BD ( 1) B   1 - H   4
                ( 44.49%)   0.6670* B   1 s( 33.33%)p 2.00( 66.67%)
                                            0.0000  0.5774  0.0000  0.7071  0.0000
                                           -0.4082  0.0000  0.0000  0.0000
                ( 55.51%)   0.7451* H   4 s(100.00%)
                                            1.0000  0.0000
     4. (1.99904) CR ( 1) B   1           s(100.00%)
                                            1.0000  0.0000  0.0000  0.0000  0.0000
                                            0.0000  0.0000  0.0000  0.0000
     5. (0.00000) LP*( 1) B   1           s(100.00%)
NBO analysis can also show much more information about molecules such as the hybridisation of the atomic orbitals and each atoms relative contribution to bonding. From the above NBO analysis it can be seen that boron has a empty p orbital (5.), this orbital also contributes to borane lewis acidity.
These are artificial concepts but help in the understanding of molecules electronic structure. From the
Borane's Molecular Orbitals
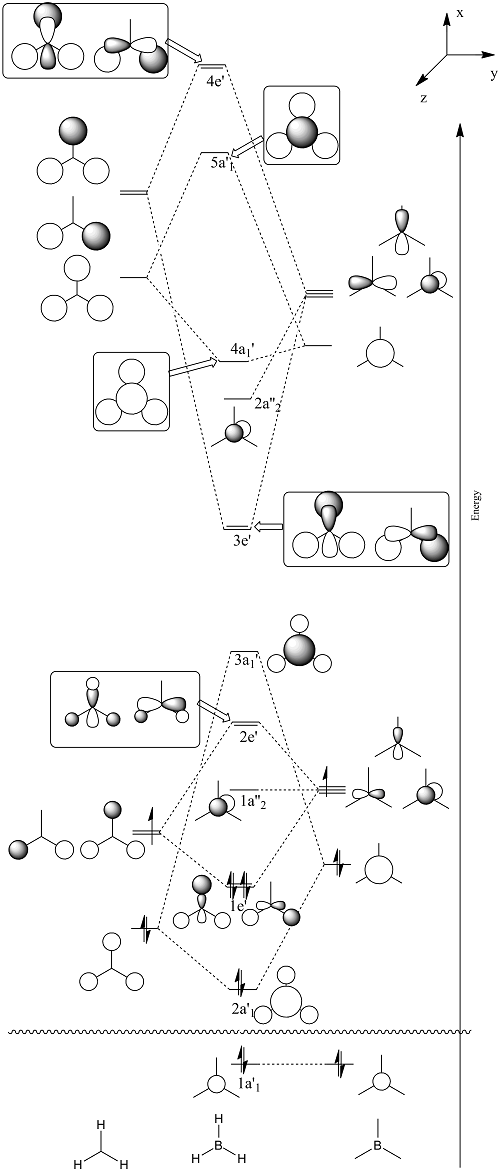
One of computational chemistry's powerful assets is its ability to quantitatively compute MO orbitals. Allowing the comparison of qualitative MO diagrams and their computed counterparts. This shall be done for BH3. The repository file for the calculation can be found here.
The LCAO MO's and the "real" MO's match extremely well for the first 8 MO orbitals (which are from the (H's 1sAO and B's 2sAO & 2pAO) interactions. The LCAO drawings get all of the shapes, sizes and the number & location of nodes of the 8 first orbitals very well (except MO7 of the 2e' label).
A downside with the LCAO method is that it givs no indication of energy, and therefore order, of the resulting MOs. For example without calculation it is extremely hard put in the correct order 3a1' and 2e'.
For the valence MO's (H's 2sAO and B's 3sAO & 2pAO) the match is less good. The LCAO method shows the general shape and pattern to a reasonable degree however it does not predict certain nodes and patterns in the more complicated "real" MOs. Therefore for higher orbitals it is also likely that a quantitative computational treatment is needed to get an accurate picture of their size and shape.
Overall LCAO method is of a limited value outside its niche area of simple and smallish molecules. However in this niche area it can be used to understanding the bonding and structure of the small molecules and explain certain properties such as boranes lewis acidity. Since BH3 has a unoccupied non-bonding orbital 1a"2 other molecules can donate electron density into this orbital and form adducts. This does not weaken the 3x B-H bonds in borane. But in fact leads to a stabilisation on the new adduct.
Thallium (III) bromide (TlBr3) Optimisation
The purpose of this computational experiment is to find the optimised ground state structure of D3h thallium tribromide (TlBr3), confirm the optimised structure by frequency analysis and illustrate how computational chemistry can be applied to elements far down in the periodic table. The application to heavier elements is important for inorganic chemistry and catalysts studies, as these involve the heavy atoms. The standard Schroedinger equation for elements like thallium and bromine, with 81 and 35 electrons respectively, does not take into account the relativistic effects which occur. To solve this issue some of the relativistic effects are recovered using a so called pseudo-potential. The pseudo potential models the core electrons, which do not participate in bonding electrons, and then the usual methods are applied to valence electrons which do participate in bonding. Furthermore, to allow calculations on these higher elements the basis sets that we use need to be larger, allowing more accurate descriptions of the higher elements.
Calculation method & Basis sets for optimisation of TlBr3
The calculation method DFT-B3LYP with basis set LANL2DZ was employed for both the optimisation and frequency analysis. These settings are medium level calculations, i.e. a comprise between accuracy, processing time and cost. Before the calculation was performed the symmetry of the thallium (III) bromide was limited very strictly to D3h point group. Meaning that the optimisation had to return a molecule with very good D3h symmetry. Included is a summary and .log file for the optimisation calculation run on Gaussian.

    Item               Value     Threshold  Converged?
 Maximum Force            0.000002     0.000450     YES
 RMS     Force            0.000001     0.000300     YES
 Maximum Displacement     0.000022     0.001800     YES
 RMS     Displacement     0.000014     0.001200     YES
 Predicted change in Energy=-6.103219D-11
 Optimization completed.
    -- Stationary point found.
The gradient is small and the forces have converged showing that the a stationary point on the PES of TlBr3 has been located.
Frequency analysis was then needed performed to check that the stationary point is a minima. The same method and basis set was used for opt. and freq. analysis for the reasons stated previously. The low frequencies of TlBr3 are included below.
Low frequencies --- 46.4288 46.4291 52.1449
The low frequencies are greater than 0 showing that the optimised structure is a minima and not a transition state. The lowest "real" normal model is at 46cm-1.
This give the optimised structure of TlBr3 to have the following properties.
Bond length - 2.64-2.66 Bond angle - 119.9-120.1
This can then be compared to the literature value[2]. Bond length 2.52 and structure as trigonal planar. This shows a reasonable correlation to the computational results, and shows that computational results are in the right area and not producing ridiculous results. If a higher end calculation was used perhaps a more accurate result could be attained.
Sometimes when using Gaussview molecules do not also come back with the bonds drawn in. Gaussview uses predefined values of bond lengths to decide whether or not it should draw a bond. If an interaction between two atoms is longer than the predefined value then Gaussview does not draw a bond even though there might be favourable interactions between the atoms. The nature of this problem brings into question what is a bond and how can it be defined. It may be said that a chemical bond is an energy or force that holds atoms together. Therefore, to break a bond energy must be put into the system.
Mo(CO)4(PPh3)2
Computational chemistry can be used to answer key questions about molecules and in this case about isomers. The aim of this computational experiment is to investigate the cis and trans isomers of Mo(CO)4(PPh3)2. However, to save time and money the triphenyl phosphine groups are going to swapped for Cl atoms, which have similar electrons to PPh3 but are less computational less intensive.
Optimisation and frequency analysis of Mo(CO)4(PPh3)2
The first step is to create optimised structures of the cis and trans isomers. Firstly, the structure was optimised roughly using DFT-B3LYP method with LANL2MB basis set. The structure was then tweaked manually to give set dihedral angles. This step was done so as to guide the final optimisation into the correct minima in the potential energy surface.
The final optimisation calculation was then run with the DFT-B3LYP method and the "better" basis set LANL2DZ, and the additional keywords int=ultrafine scf=conver=9. Furthemore, since LANL2DZ does not give phosphorous dAO they were added manually. This was done as phosphorous likes to become hypervalent by using its low lying dAOs. The dAO were added manually by editing the output file manually and adding them.
The D-space repository files for cis and trans isomer optimisations.
After this the optimisations were checked to be minima by frequency analysis. The cis and trans low frequencies are shown below.
CIS Low frequencies --- 11.4976 20.1054 45.8017
TRANS Low frequencies --- 4.7042 7.0704 40.4731
For both isomers low frequency vibrations are positive showing that a minima has indeed been found.
The D-space repository files for cis and trans isomer frequency analysis.
Structural analysis of cis and trans isomers
| Cis-isomer | Trans-isomer | ||||||
|---|---|---|---|---|---|---|---|
|
|
| Bond | Bond length trans-complex (Å) | Bond length complex (Å) |
|---|---|---|
| Mo-P(10) | 2.42 | 2.48 |
| Mo-P(11) | 2.42 | 2.48 |
| Mo-C(2) | 2.06 | 2.05 |
| Mo-C(3) | 2.06 | 2.02 |
| Mo-C(4) | 2.06 | 2.02 |
| Mo-C(5) | 2.06 | 2.05 |
| Bond | Angle trans-complex (o) | Angle cis-complex (o) |
|---|---|---|
| P(10)-Mo-P(11) | 177 | 94 |
| P(10)-Mo-C(4) | 90 | 176 |
| P(11)-Mo-C(4) | 90 | 176 |
| C(2)-Mo-C(5) | 90 | 179 |
| C(3)-Mo-C(5) | 180 | 179 |
The calculated trans complex adopts a octahedral geometry much closer to ideal than the cis complex. This is from the reduced steric clash of placing the largest ligands trans to one another. In the trans complex the P-Mo-P angle is slightly off from ideal, meaning that the Cl groups are causing steric strain. In the complex when L=PPh3 the ligands bulkier and this may result in even greater strain and a further step from ideality.
Whereas in teh cis complex the two buliest ligands are next to each other and this causes strain which is slightly relieved by moving the other ligans. (Cis complex discussed in more detail later.)
A big difference between the complexes is that in the trans-complex the Mo-C bonds are all longer than the cis-complex. This is likely to be from that fact that the Mo-C backbonding in a trans complex backbonds to less metal orbitals. As ligands in the same plane backbond to the same orbitals. Therefore, in trans compelxes since all the carbonyl ligands are in the same plane they backbond with all the same orbitals. However in cis complex the carbonyl ligands are in two planes and therefore can backbond with more of the molybdenum d-orbitals resulting in more double bond character in the cis-complex Mo-C bonds, which results in them being shorter.
Comparison of cis-isomer to literature data
The cis-complex will have its bond lengths and angles compared to the literature[3].
N.B. only the cis-isomer was literature analysed due to time constraints of finding literature data.
| Bond | Bond length lit. cis-complex (Å) | Bond length calc. complex (Å) |
|---|---|---|
| Mo-P(10) | 2.576 | 2.48 |
| Mo-P(11) | 2.577 | 2.48 |
| Mo-C(2) | 2.059 | 2.05 |
| Mo-C(3) | 1.973 | 2.02 |
| Mo-C(4) | 1.973 | 2.02 |
| Mo-C(5) | 2.022 | 2.05 |
| Bond | Angle lit. cis-complex (o) | Angle calc. cis-complex (o) |
|---|---|---|
| P(10)-Mo-P(11) | 104.62 | 94 |
| P(10)-Mo-C(4) | 163.7 | 176 |
| P(11)-Mo-C(4) | 173.2 | 176 |
| C(2)-Mo-C(5) | 174.1 | 179 |
The values for the bond lengths and angles are reasonable compared to that of lit. showing that the calculation results for both comlexes are not ridiculous.
For every measurement there are noticeable differences between the X-ray crystallographic bonds & angles and the computed values. However, the values although not exactly correct are reasonably similar and appear to show a number of patterns in the complex. For example both methods show the carbons trans to each other (2&5) to have a longer Mo-C bond length than the carbons trans to phosphorous. The carbonyl groups trans to phosphorous therefore are likely to undergo more backbonding with the molybdenum and therefore shorten their bonds. Perhaps this backbonding situation is not accurately/fully modelled by the method/basis set used and this could account for the increased length of the Mo-C calculated bonds compared to x-ray. This is also likely why it is important to include phosphorous dAO as they can also accept electron density from the molybdenum centre.
For the angle calculations the crystallographic data shows the complex to be much more distorted from ideal with the P-Mo-P angle being ~10o larger in the x-ray data. Other the other hand both techniques show that it is larger than ideal octahedral. There are two possible explanations for this firstly the substitution of PPh3 for Cl may lead to less steric clash and therefore the angle may reduce or maybe the larger angle occur during the crystal packing of the Mo complex.
The computational approach shows elements of symmetry with both P-Mo-C angles, C-Mo-C bonds and C-Mo-P bonds being the same angles and lengths. This is not seen in experimental data. Real molecules tend to lose their symmetry and lower energy from this (an example is the Jahn-Teller distortion) it may be in this molybdenum complex that it is losing its symmetry to lower its energy.
Comparison of relative energies of the cis and trans isomers
The relative energies of the two complexes can be compared to find which is more thermodynamically stable.
| Isomer | Energy (Hartree) | Energy (kJ/mol) |
|---|---|---|
| Cis | -623.693 ± ~0.004 | 1637506 ± ~10 |
| Trans | -623.694 ± ~0.004 | -1637505 ± ~10 |
It can be seen that the trans isomer can be calculated to be the more stable isomer.
The energy difference between the two isomers is ~1kJ/mol, which is an order of magnitude less than the error associated with such a calculation[4]! Hence, it cannot be said with certainty which isomer is more stable.
In the complex Mo(CO)4L2 where L=PPh3 there would be more steric clash in the cis isomer which would perhaps raise the cis isomer in energy enough to tell between the two computationally. Literature supports this with [5] showing that the trans isomer is more stable.
A possible further investigation into the stability of these isomers could be carried out computationally with the L=PR3 where R could be swapped for less sterically intensive groups than Ph, such as Me or F, or a mixture of then smaller groups and Ph. And then it could also be tested with much larger groups such as R=t-Bu or i-P. By comparing both it would be possible to see if teh difference in stability is from sterics or is there some other underlying thermodynamic preference for trans over cis in this complex.
Vibrational analysis of cis and trans complexes
Mini Project - Investigation in group 1 dicyanide complexes
Aim
The aim of my mini project is to investigate M(CN)2 (where M=Li,Na,K,Rb,Cs) molecules. In particular investigate the trends in the MC bond and the CN bonding for group 1. Also a MO diagram of Li(CN)2 will be constructed to further understand the bonding in the group 1 dicyanide molecules.
Method and basis set for investigation
The first problem that presents itself is what method and basis set will accurately cover the elements in group 1. The short answer is that there isn't one! Lithium and sodium cannot be accurately modelled using a pseudo-potential as there core electron may interact with the valence ones. And rubidium and caesium cannot be made purely for accurate basis sets as they don't exist.
Instead a one method, MP2, and two basis sets, 6311G(d,p) for "light" elements & LANL2DZ for heavy elements, shall be employed to give the trend of the group. This seems counter-intuitive as using two basis sets means that the calculations aren't equivalent and therefore cannot be compared directly. However they can firstly a medium element, potassium in this case, will have both basis sets applied and the calculations once of each. The two sets of results can then be compared with all the other results and one should be able to tell if the results of the two basis sets can be compared for the trends. The aim is to mainly look at trends rather than the specifics, therefore the use of two basis sets if applied correctly shouldn't cause too much error.
Optimisations and frequency analysis for M(CN)2
The molecules were optimised using their respective methods and then had frequency analysis performed of them to check that the stationary point the optimisation stopped at on the potential energy surface is a minima.
| Molecule | Method | RMS Gradient | Low Frequencies | D-space files |
|---|---|---|---|---|
| Li(CN)2 | MP2-6311G(d,p) | 0.00003084 | Low frequencies --- -346.7421 -346.7421 -326.3061 -326.3061 -26.0610 -26.0610 Low frequencies --- -0.0007 -0.0006 -0.0006 |
Opt Freq |
| Na(CN)2 | MP2-6311G(d,p) | 0.00000015 | Low frequencies --- -78.9605 -78.9605 -25.9927 -25.9927 -0.0016 -0.0015 Low frequencies --- -0.0008 0.2447 0.2447 |
Opt Freq |
| K(CN)2 | MP2-6311 | 0.00002577 | Low frequencies --- -34.1419 -34.1419 0.0007 0.0036 0.0037 1.6982 Low frequencies --- 1.6982 2.1657 2.1657 |
Opt Freq |
| K(CN)2 | MP2-LANL2DZ | 0.00000815 | Low frequencies --- -29.5052 -29.5052 -28.8708 -28.8708 0.0003 0.0008 Low frequencies --- 0.0008 1.9667 1.9667 |
Opt Freq |
| Rb(CN)2 | MP2-LANL2DZ | 0.00000555 | Low frequencies --- -25.4330 -25.4330 -8.4291 -8.4291 -0.6020 -0.6020 Low frequencies --- 0.0009 0.0009 0.0010 |
Opt Freq |
| Cs(CN)2 | MP2-LANL2DZ | 0.00000285 | Low frequencies --- -12.1530 -12.1530 -0.0002 -0.0002 0.0002 0.4549 Low frequencies --- 0.4549 10.9824 10.9824 |
Opt Freq |
At first I thought It should be noted that the "zero" vibrations appear to be quite large for some of the molecules especially the lighter elements. This is expected for a small linear molecule about which atoms can vibrate. For example for lithium mass ~7g/mol, has two cyanide groups 26 g/mol vibrating on either side. Therefore an asymmteric vibration in the mass can cause the centre of mass of move away from the lithium atom easily. The zero vibrations get larger as the central metal gets lighter as the cyanide vibrations can more easily move the centre of mass for lighter metals. The 3 low frequency calculations for each of molecules are all positive or only contain very small negatives and they are all therefore minima and optimised structures. This means that the bond lengths, vibrations and molecular orbitals can be investigated further.
However, this is not correct. The structure were changed until new genuine optimised structures were found.
| Molecule | Method | Low Frequencies |
|---|---|---|
| Li(CN)2 | DFT-B3LYP-6311G(d,p) | Low frequencies --- -15.1297 -4.7109 -0.0006 -0.0001 0.0002 5.7521 Low frequencies --- 34.0153 51.5761 109.7639 |
| Na(CN)2 | DFT-B3LYP-6311G(d,p) | Low frequencies --- -3.9798 -2.7208 -0.0008 -0.0008 0.0015 28.4033 Low frequencies --- 28.4119 45.4344 46.1809 |
| K(CN)2 | DFT-B3LYP-6311G(d,p) | Low frequencies --- -15.1389 -15.1389 0.0033 0.0034 0.0037 16.5931 Low frequencies --- 16.5931 50.3908 50.3908 |
| K(CN)2 | DFT-B3LYP-LANL2DZ | Low frequencies --- -13.1323 -13.1323 0.0002 0.0007 0.0008 17.2061 Low frequencies --- 17.2063 71.8185 71.8196 |
| Rb(CN)2 | DFT-B3LYP-LANL2DZ | Low frequencies --- -19.2040 -19.2040 -10.9904 -10.9904 0.0006 0.0007 Low frequencies --- 0.0008 66.7017 66.7017 |
| Cs(CN)2 | DFT-B3LYP-LANL2DZ | Low frequencies --- -26.7407 -21.3410 -0.0004 0.0006 0.0006 15.8037 Low frequencies --- 24.4510 63.4711 69.3904 |
Now it can be seen that the frequencys are positive and non-transition structure have been found!
Bond lengths of M(CN)2 molecules
The bond lengths of the optimised structures can be measured.
| Molecule | CN bond length (Å) | MC bond length (Å) | N-C-M bond angle |
|---|---|---|---|
| Li(CN)2 | 1.170 | 2.043 | 156.7 |
| Na(CN)2 | 1.165 | 2.387 | 179.9 |
| K(CN)2 | 1.166 | 2.731 | 180.0 |
| K(CN)2 | 1.198 | 2.768 | 180.0 |
| Rb(CN)2 | 1.119 | 2.942 | 180.0 |
| Cs(CN)2 | 1.120 | 3.012 | 179.3 |
From this pattern it can be seen that the values for potassium are similar for both, as well as the the pattern being continued one. Showing that the technique on using two different basis sets works!
Both bond lengths show a trend, in general the bond length gets longer as you descend the group. The literature bond length CN is 1.159[6]. Showing the bond is longer than expected. From the MO argument below, the sigma 2p bonding orbitals not only bond the CN but also contribute to the MC bond. This reduces electron density in the bond and makes it weaker. This happens more as you descend the group as the C-M bond becomes larger so more electron denisty needs to be donated. Li is a notable exception to this trend, its odd nature is likely to be form the fact that it is the only one of the series to be bent.
The MC bond length increase as you descend the group due to increase covalent radii.
IR analysis the metals
The IR for the 6 computed molecules is included here.
 |
 |
 |
 |
 |
 |
The IR stretch for CN appears in 4 of them Li, K(LANL2DZ), Rb & Cs dicyanide molecules. They are all about the same stretch and do not show a significant weaken in the CN for the different molecules. This supports the view from the bond length in which it chaged very little for the different molecules.
A noteworthy point is that the two different basis sets show the potassium cyanide molecule to be IR inactive and active depending on the method. These results are unexpected, perhaps the non IR active one is actually a transition state and not a minima.
MO diagram of Li(CN)2
N.B. the MO diagram of Li(CN)2 was done drawn on a wrong structure of Li(CN)2, due to an error on my behalf. But due to time constraints I am unable to redraw the diagram :( . The optimised version of Li(CN)2 (bent version) MOs are similar to the linear version and the MO diagram will be similar for the rest of the linear series.
The MO diagram of LI(CN)2 can be built up from two CN fragments and a Li atom. The MO for the diatomic CN fragment is well known and shown below -

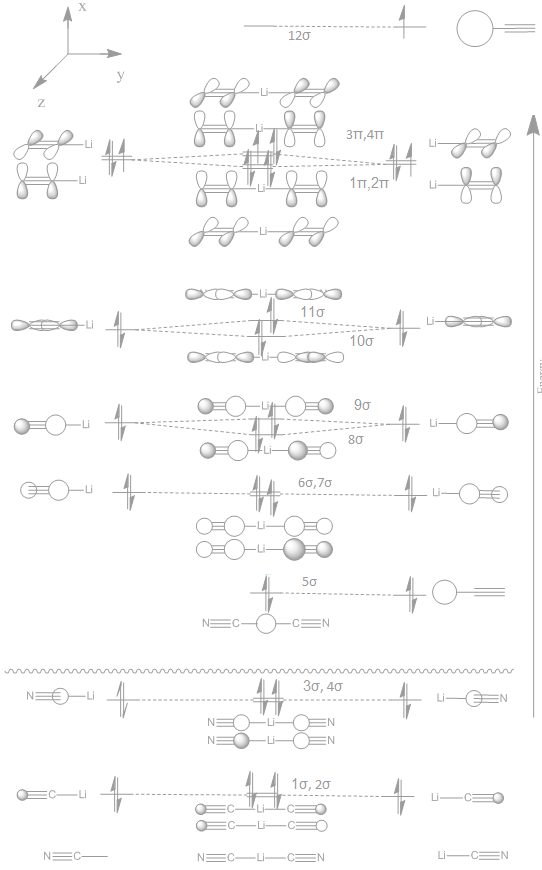
To then construct the MO diagram of the whole molecule the two CN fragments and a Li must be added together. This is done below with the right side containing both the Li atom and CN fragments for simplicity.
 |
|
Firstly, it should be noted for the occupied orbitals above the LCAO drawings match the "real" very well. With the first 16 MO's of Li(CN)2 being described very accurately by LCAO drawings. This continues the argument from before about the strength of LCAO at predicting orbital shapes. However, the relative positioning of the orbitals such as Li 1sAO relative to CN fragment orbitals would have been extremely difficult without the aid of computational chemistry.
There is a slight difference between the CN fragment orbital and the one used for Li(CN)2, that being the order of the pi and sigma orbitals from the 2p AOs. This is hard to tell the order of without knowing the energy values and therefore the ordered was changed after seeing the computational results
There are a number of interesting things to note in the above MO diagram, such as the loss of degeneracy for orbitals pairs 8σ & 9σ, 10σ & 11σ and the splitting of 1π, 2π from 3π, 4π. For the sigma orbitals 8 & 9 one would expect from LCAO that 9 should be lower in energy. This is because the orbitals have the same phase lobe pointing off the CN fragment towards the central Li atom, therefore there might be slight positive overlap and this would cause a lowering of energy. However, actually 8 is lower in energy which has a phase change from one CN fragment to the other! One would expect the phase change to give a node with would in turn give an increase in energy. But this is lower in energy. It can be concluded that having a node over the Li atom offers some stabilisation compared to a small potential overlap. Sigma orbitals 10 and 11 also support this view.
The 4 x π orbitals are split into two pairs. This is because for 1π and 2π they can undergo favourable π interactions across the whole length of the molecule, giving a slight stabilisation. In contrast, 3π and 4π have a node in the middle of the molecule and do not have in-phase perpendicular lobes along the whole length.
The MO diagram shows that Li-CN bondings occurs for the 8-12σ orbitals. These orbitals are relativity high in energy, perhaps suggesting the Li-C bond isn't desperately strong, which is to be expected from intuition. The MO diagram also shows that the cyanide group goes from a bond order of 2.5 in the CN fragment to 2.75 in lithium dicyanide. However, it is less than the cyanide anion which has bond order of 3. Therefore, one would expect vibrational frequency to be less than the CN anion.
Conclusion on miniproject
In conclusion the mini project wasn't successful as hoped! A misinterpretation of the low frequency data lead to me following a wrong path using bad data. After this was corrected it can be seen that the cyanide group changes length down the group, but teh change is small and this does not result in a significant change in IR frequency.
References
- ↑ IUPAC Goldbook - http://old.iupac.org/goldbook/NT07077.pdf
- ↑ J. Blixt, J. Glaser, J. Mink, I. Persson, P. Persson, M. Sandstroem, J. Am. Chem. Soc., 1995, 117, 5089
- ↑ F. Cotton, D. Darensbourg, S. Klein, B. Kolthamme, Inorg. Chem., 1982, 21, 294
- ↑ http://www.huntresearchgroup.org.uk/teaching/teaching_comp_lab_year3/8a_accuracy.html
- ↑ D. J. Darensbourg, Inorg. Chem., 1979, 18, 14 DOI:10.1021/ic50191a003
- ↑ V. Typke, M. Dakkouri and F. Schlumberger, Journal of Molecular Structure,1980, 62, 111

