Rep:Mod:hcn06report2
Introduction
The general aim of this computational lab is to gain an insight into the structure and bonding of complexes using the Gaussian and GaussView computer programmes. Gaussview is a graphical interface that takes information from a file such as the .gif, .chk and .out files and presents it graphically. Sometimes there is information that Gaussview cannot process and so the file output must be looked at by the program Gaussian.
Optimising a Molecule
BH3
We will start by optimising a small molecule BH3 using GaussView with the B3LYP method and 3-21G basis set.
The method BLYP determines the type of approximations that are made in solving the Schrodinger equation. The basis set determines the number of functions used to describe the electronic structure and hence the accuracy. It increases in a rough order: 3-21G, 6-31G(d,p), 6-311+G(d,p). Therefore, the molecule of BH3 is optimised with a very low accuracy. However this means the calculations should be very quick. In carrying out an optimization, the optimum position of the nuclei for a given electronic configuration is being determined. This is the first step for any quantum chemical calculation.
When the optimisation completes, the optimised bond distance and optimised bond angle of the molecule can be determined.
- Optimised B-H bond distance: 1.19453A
- Optimised H-B-H bond angle: 120.000°
A list of important information about the calculation made can be found in the “Summary” and that for a molecule of BH3 is shown below:
- File Type: .log
- Calculation type: FOPT
- Calculation method: RB3LYP
- Basis set: 3-21G
- Final energy: -26.46226433 a.u.
- Dipole moment: 0.0000 Debye
- Point group: D3h
- How long did your calculation take? 11.0 seconds
Optimization plots showing the energy and the gradient of energy at each step of the optimisation and structures of the molecule at each step of the optimisation can also be obtained after the optimisation of the molecule. The Total Energy curve shows the program traversing the Potential Energy Surface of BH3 and finding the minimum energy structure. The Root Mean Square Gradient curve, with the gradient showing the average change in energy at each step of optimisation, shows the gradient going to zero as the minimum is approached. There is no bond shown on the structure of BH3 at the first step of optimisation because GaussView draws bonds based on distance criteria; as the bond distance exceeds the pre-defined value, the bonds are not shown. However, in reality, a bond forms whenever there is electron density in the overlap of orbitals with similar energies and same symmetry. The structure of BH3 at the last step of optimisation has the most negative energy and the smallest gradient.
BCl3
When treating larger molecules with second row atoms and above, larger basis sets and pseudo-potenitals have to be used to improve the accuracy of the calculations and reduce the computational difficulty. A larger molecule BCl3 will be optimised using GaussView.
Cl is in the second row and has 17 electrons, which is a lot at the level of quantum mechanics. However, it is the valence electrons that dominate in bonding interactions. Therefore, a special function called pseudo-potential, which is accurate and does not affect the calculation significantly, can be used to only model the 10 core electrons. When treating second row atoms and above, larger basis set has to be used to improve the accuracy of the calculation. The best basis set and pseudo-potential are more technical to implement and will make the calculations take much longer. Therefore, as a compromise between the time taken to run the calculation and the accuracy, the molecule of BCl3 is optimised with LanL2MB basis set, which is a medium level basis set.
Results obtained after the optimisation are shown as follows:
- Optimised B-Cl bond distance: 1.86592A
- Optimised Cl-B-Cl bond angle: 120.000°
A list of important information about the calculation for the optimisation of a molecule of BCl3 is shown below:
- File Type: .log
- Calculation type: FOPT
- Calculation method: RB3LYP
- Basis set: LANL2MB
- Final energy: -69.43928112 a.u.
- Dipole moment: 0.0000 Debye
- Point group: D3h
- How long did your calculation take? 12.0 seconds
Own small molecule: SO2
A small molecule SO2 is optimised and the completed optimisation is deposited in the chemical database SCAN. The results obtained after the optimisation are shown below:
- The xyz coordinates of the molecule:
---------------------------------------------------------------------
Center     Atomic     Atomic              Coordinates (Angstroms)
Number     Number      Type              X           Y           Z
---------------------------------------------------------------------
   1         16             0        0.000000    0.000000    0.481916
   2          8             0        0.000000    1.363791   -0.481916
   3          8             0        0.000000   -1.363791   -0.481916
---------------------------------------------------------------------
- Optimised S-O bond distance: 1.73585A
- Optimised O-S-O bond angle: 36.811°
- Calculation method: RB3LYP
- Basis set: LANL2MB
- Final energy: -158.23587098 a.u.
- Dipole moment: 0.0075 Debye
- Point group: C2v
- How long did your calculation take? 18.0 seconds
- Unique identifier on chemistry database: 9975
As expected, time taken to optimise a larger molecule with larger basis set is longer than the time taken to optimise a smaller molecule with smaller basis set, given that the optimisations are made using the same method.
Frequency / Vibrational analysis and confirming minima
When the first derivative of a function defines the slope, it doesn't tell if it is at a maximum or a minimum point. Therefore, a second derivative which gives the curvature of the function has to be taken. If the second derivative is positive, a minimum is obtained and if the second derivative is negative, a maximum is obtained.
The frequency analysis is the second derivative of the potential energy surface. If the frequencies are all positive, a minimum is obtained. If one of them is negative, a transition state is obtained. If any more are negative, it is fail for finding a critical point and the optimisation has not completed or has failed. The frequency analysis also provides the IR and Raman modes to compare with experiment.
Frequency analysis for the fully optimised structure of BH3 is carried out to confirm that a minimum structure has been obtained.
The energy stated in the Summary of the calculation for frequency is the same as that recorded for optimisation. Therefore, the two structures are confirmed to be the same.
The results of the frequency analysis for BH3 are shown in the following table:
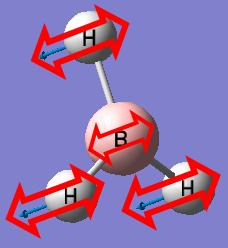
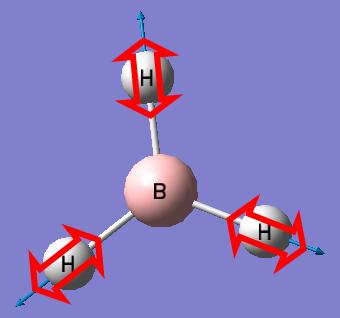
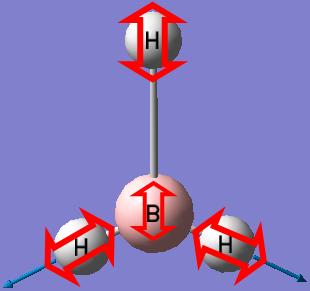
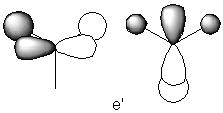
Looking at the table, it can been seen that there are two pairs of vibrations (number 2 as a pair with number 3 and number 5 as a pair with number 6), each pair with the same frequency and intensity. This shows that they correspond to the doubly degenerate orbitals with symmetry labels, E’ and E’’. It is known from the MO diagram of the BH3 molecule that the E’ doubly degenerate orbitals look as follows:
Vibration number 2 corresponds to the orbital on the left and vibration number 3 corresponds to the orbital on the right. Vibration number 5 and 6 are confirmed to have a symmetry of E” as they remain the same under the 2S3 symmetry operations.
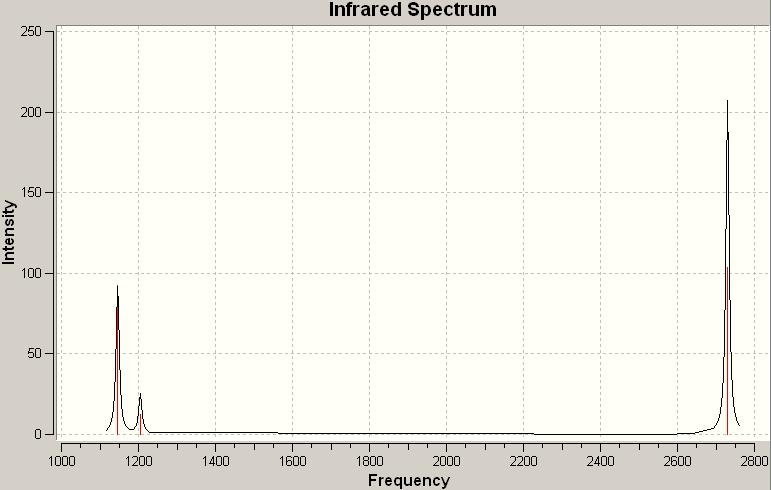
The computed IR spectrum for BH3:
There are only three peaks in the spectrum but there are six vibrations in the BH3 molecule. This is because vibration number 2 and 3 are doubly degenerate orbitals, which have the same frequency at 1204.86 and similar intensity, and only appear as one peak in the spectrum. The same thing applies to vibration number 5 and 6 with the frequency at 2730.07. Although vibration number 4 has a frequency at 2591.65, it has got an intensity of 0 and will not be shown as a peak in the spectrum. The peak at 1146.03 corresponds to vibration number 1.
Molecular Orbitals of BH3
Some quantitative or computed MOs of BH3 will be produced and then they can be compared with the qualitative or approximate MOs produced via MO diagrams.
A MO diagram of trigonal planar D3h BH3 showing the qualitative or approximate MOs is shown below:
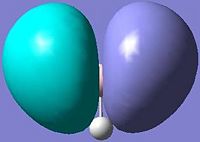
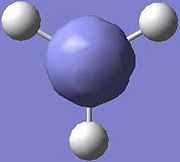
The table below shows the predicted qualitative MOs of BH3 with their corresponding quantitative MOs:
| Predicted qualitative MOs | Quantitative MOs | |
|---|---|---|
| LUMO | 
|

|
| Degenerate HOMO | 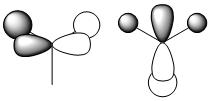
|
|
| Occupied MO with the second lowest energy | 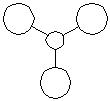
|

|
| Occupied MO with the lowest energy | 
|
|
By comparing the predicted qualitative and quantitative MOs, it can be seen that the predicted qualitative MO theory is very accurate and useful as the qualitative MOs are almost correct.
An organometallic complex
Cis and Trans Isomerism of Mo(CO)4L2 where L=P(CH3)3
Calculations will be carried out for the cis and trans isomers of Mo(CO)4L2 where L=P(CH3)3 to predict their thermal stabilities and spectral characteristics. As Mo(CO)4L2 is a larger molecule, calculations will be significantly more intensive that the ones carried out so far.
In order to get a good result, the calculations are carried out in three steps:
1. The molecules are optimised for a rough geometry using the B3LYP method and LanL2MB basis set, which is a low level basis set and pseudo-potential. Loose convergence criteria are also set. Convergence here relates to the first derivative of the energy. If the normal convergence critera are used, the limits set are more accurate than the method employed and the calculation will not converge because this limit will never be reached.
The optimisations are deposited in the chemical database SCAN.
- Unique identifier for the cis-Mo(CO)4L2 model: 10138
- Unique identifier for the trans-Mo(CO)4L2 model: 10196
2.The ground state optimised geometry is then optimised again using the B3LYP method with the LanL2DZ pseudo-potential and basis sets (a much better basis set and pseudo-potential option) using the normal optimisation criteria. The increased convergence criteria are used because a much better pseudo-potential and basis set is used.
The optimisations are again deposited in the chemical database SCAN.
- Unique identifier for the cis-Mo(CO)4L2 model: 10260
- Unique identifier for the trans-Mo(CO)4L2 model: 10261
3. The IR frequencies of the cis and trans isomers are computed and the deposited in the chemical database SCAN.
- Unique identifier for the cis-Mo(CO)4L2 model: 10350
- Unique identifier for the trans-Mo(CO)4L2 model: 10351
Cis-isomer
The geometric parameters of the optimised structure of the cis-Mo(CO)4(P(CH3)3)2 are shown as follows:
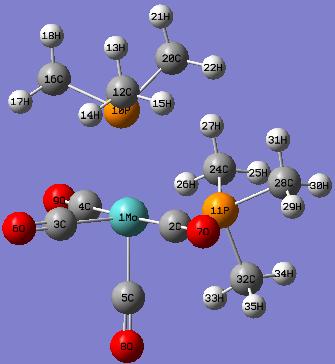
Actually, there are P-Mo bonds exsist in the model. However, GaussView draws bonds based on distance criteria; as the P-Mo bond distances exceed the pre-defined value, the bonds are not shown.
A table to compare the optimised bond distances of cis-Mo(CO)4(P(CH3)3)2 and the experimental values of cis-Mo(CO)4(P(Me2)Ph)2
| Bond | Optimised bond distance (A) | Experimental bond distance from literature (A) |
|---|---|---|
| Mo-P(10) | 2.64787 | 2.525 |
| Mo-P(11) | 2.65190 | 2.533 |
| Mo-C(2) | 2.03245 | 1.997 |
| Mo-C(3) | 1.98102 | 1.981 |
| Mo-C(4) | 2.03249 | 2.034 |
| Mo-C(5) | 1.98300 | 1.983 |
| C(2)-O(7) | 1.18793 | 1.150 |
| C(3)-O(6) | 1.19237 | 1.163 |
| C(4)-O(9) | 1.18796 | 1.150 |
| C(5)-O(8) | 1.19126 | 1.125 |
| P(10)-C(12) | 1.89042 | 1.819 |
| P(10)-C(16) | 1.89043 | 1.837 |
| P(10)-C(20) | 1.89570 | 1.862 |
| P(11)-C(24) | 1.89290 | 1.836 |
| P(11)-C(28) | 1.89295 | 1.863 |
| P(11)-C(32) | 1.89002 | 1.815 |
A table to compare the optimised bond angles of cis-Mo(CO)4(P(CH3)3)2 and the experimental values of cis-Mo(CO)4(P(Me2)Ph)2
| Bond | Optimised bond angle (°) | Experimental bond angle from literature (°) |
|---|---|---|
| P(10)-Mo-P(11) | 95.324 | 94.75 |
| P(10)-Mo-C(2) | 89.807 | 87.8 |
| P(10)-Mo-C(3) | 86.210 | 89.3 |
| P(10)-Mo-C(4) | 89.585 | 87.1 |
| P(10)-Mo-C(5) | 175.165 | 175.5 |
| P(11)-Mo-C(2) | 88.721 | 87.8 |
| P(11)-Mo-C(3) | 178.464 | 176.3 |
| P(11)-Mo-C(4) | 88.872 | 89.7 |
| P(11)-Mo-C(5) | 89.510 | 94.0 |
| C(2)-Mo-C(3) | 91.200 | 89.9 |
| C(2)-Mo-C(4) | 177.452 | 177.0 |
| C(2)-Mo-C(5) | 90.393 | 89.2 |
| C(3)-Mo-C(4) | 91.229 | 92.9 |
| C(3)-Mo-C(5) | 88.956 | 88.4 |
| C(4)-Mo-C(5) | 90.422 | 89.9 |
| Mo-C(2)-O(7) | 179.353 | 178.0 |
| Mo-C(3)-O(6) | 179.798 | 179.1 |
| Mo-C(4)-O(9) | 179.386 | 178.5 |
| Mo-C(5)-O(8) | 178.883 | 178.0 |
It can be seen that the optimised and experimental values are very similar, except for the P-C bond distances and P-Mo-C bond angles as the ligands L used are different. Thus, the calculations for the cis-isomer should be completed and the cis-isomer optimised.
Trans-isomer
Similarly, the geometric parameters of the optimised structure of the trans-Mo(CO)4(P(CH3)3)2 are shown as follows:
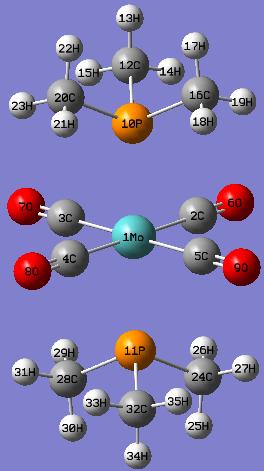
Again, the P-Mo bond distances exceed the pre-defined value in GaussView and are not shown in the model.
A table to compare the optimised bond distances of trans-Mo(CO)4(P(CH3)3)2 and the experimental values of trans-Mo(CO)4(Ph2)PNHMe)2
| Bond | Optimised bond distance (A) | Experimental bond distance from literature (A) |
|---|---|---|
| Mo-P(10) | 2.57178 | 2.4584 |
| Mo-C(2) | 2.02855 | 2.024 |
| Mo-C(3) | 2.02857 | 2.035 |
| C(2)-O(6) | 1.18983 | 1.144 |
| C(3)-O(7) | 1.18982 | 1.135 |
| P(10)-C(12) | 1.88994 | 1.840 |
| P(10)-C(16) | 1.88955 | 1.826 |
A table to compare the optimised bond angles of trans-Mo(CO)4(P(CH3)3)2 and the experimental values of trans-Mo(CO)4(Ph2)PNHMe)2
| Bond | Optimised bond angle (°) | Experimental bond angle from literature (°) |
|---|---|---|
| P(10)-Mo-C(2) | 88.995 | 89.26 |
| P(10)-Mo-C(4) | 88.931 | 88.34 |
| Mo-C(2)-O(6) | 179.712 | 179.2 |
| Mo-C(3)-O(7) | 179.685 | 179.0 |
| Mo-P(10)-C(12) | 115.679 | 119.77 |
| Mo-P(10)-C(16) | 117.123 | 113.95 |
Again, the optmised and experimental values are similar to each other. Thus, the calculations for the trans-isomer should also be completed and the trans-isomer optimised.
Comparing the Cis and Trans Isomers
There are a few interesting points for the bond distances of the optimised cis and trans isomers:
- The Mo-P bond lengths of the trans-isomer (2.57178A) is shorter than those of the cis-isomers (2.64787A and 2.65190A). This is due to the fact that the P(CH3)3 ligands are trans to each other in the trans-isomer.
- In the cis-isomer, the Mo-C bond lengths of the carbonyl ligands trans to another carbonyl ligand (2.03245A and 2.03249A) are longer than those trans to the P(CH3)3 ligands (1.98102A and 1.98300A). This is because the carbonyl ligands are better π-acceptors than the P(CH3)3 ligands. When the carbonyl ligands are trans to each other, they compete for electron density in the same 4d orbital of Mo and thus, reduce the Mo-C back-bonding.
- In the trans-isomer, all the Mo-C bond lengths are similar (2.02855A and 2.02857A) as all the carbonyl ligands are trans to each other.
A table to compare the energies of the optimised cis and trans isomers
| Cis isomer | Trans isomer | |
|---|---|---|
| Energy (a.u.) | -773.36024012 | -773.35731208 |
| Energy (kJ/mol) | -2030457 | -2030449 |
The cis-isomer is 8kJ/mol lower in energy than the trans-isomer, showing that the cis-isomer of the Mo(CO)4( P(CH3)3)2 is thermodynamically slightly more stable than the trans-isomer probably due to electronic factors. This is interesting because the trans-isomer is sterically more stable than the cis-isomer due to the steric crowding of the two P(CH3)3 groups, which have a cone angle of 118°, caused by the cis ligand arrangement. However, the result here shows that the electronic stabilisation wins over the steric stabilisation.
Ways to Alter the Relative Ordering of the Cis and Trans Isomers
- From the results obtained, it can be seen that by using ligands L with large cone angles can shift the equilibrium to the side with the trans-isomer due to steric crowding of the cis-isomer.
- In contrast, if the equilibrium is aimed to shift to the side with the cis-isomer deliberatly, intermolecular hydrogen bonding can be introduced into the ligands L (e.g. using protonated pyridyl rings as Ls) so that one of the atom that can hydrogen bond (e.g N) in one ligand can be connected to that in the other ligand, forcing the ligands to be cis to each other.
- Another way to shift the equilibrium to the side with the cis-isomer is to introduce intramolecular hydrogen bonding by using a ligand that can hydrogen bond as one of the L and a protonated form of this ligand as the other L so that intramolecule hydrogen bonding will connect these two Ls together, forcing them to be cis to each other.
- Similarly, attractive cation-π or NH-π interactions (e.g. using pyridinium and phenyl ring)can be used in the same way to force the equilibrium to the side with the cis-isomer.
IR Frequencies of the Cis and Trans Isomers
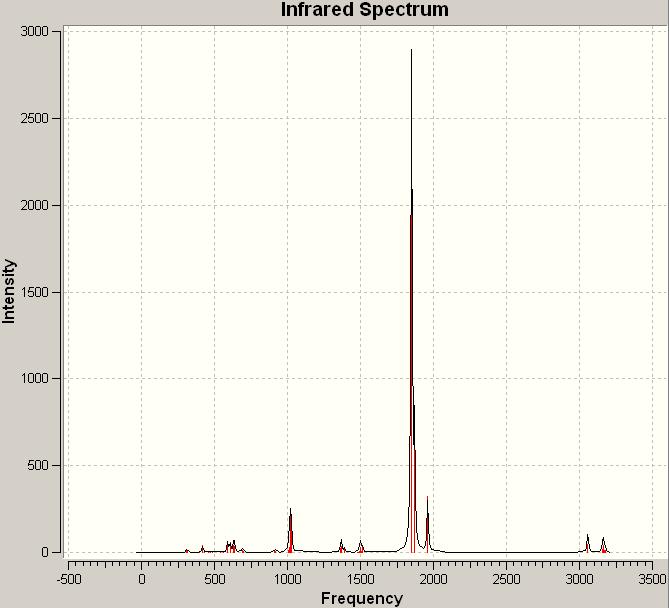
Computed IR spectrum of the cis-isomer
The most intense computed peak for the cis-isomer is at a frequency of 1850.72 with an intensity of 1960.94 while the peaks on the experimental IR spectrum of cis-[Mo(CO)4(PPh3)2]corresponding to the C=O stretches are in the range of frequency of 1884.12 to 2013.33.
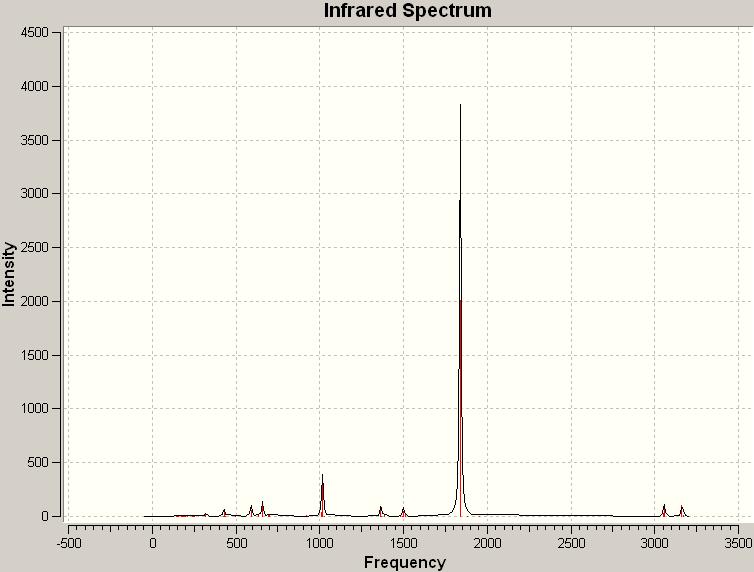
Computed IR spectrum of the trans-isomer
The most intense computed peak for the cis-isomer is at a frequency of 1839.35 with an intensity of 2009.69 while the peak on the experimental IR spectrum of trans-[Mo(CO)4(PPh3)2]corresponding to the C=O stretches has a frequency of 1886.05.
The frequencies of the peaks corrsponding to the C=O stretches for the [Mo(CO)4(P(CH3)3)2] complexes are smaller than those for the [Mo(CO)4(PPh3)2] complexes because CH3 is a better electron donor than Ph, thus, the electron density at the Mo of the [Mo(CO)4(P(CH3)3)2] complexe is greater and therefore, there are greater back-bondings from the Mo d-orbital to the C=O π* orbitals, which lower the frequencies of the C=O stretches. This shows that the values obtained in the computed IR spectra are reasonable.
Reference
- Gary M. Gray and Yalin Zhang, Journal of Chemical Crystallography, 1993, 23, 9 DOI:10.1007/BF01187272
- F. Albert. Cotton, Donald J. Darensbourg, Inorg. Chem., 1982, '21'9 (1), 294-299 DOI:10.1021/ic00131a055
- Judy Ng, Second Year Synthesis Lab Report S5, "Identification of stereochemistry (geometrical) isomers of [Mo(CO)4L2] by infrared spectroscopy"
- Leeni Hirsivaara, Matti Haukka and Jouni Pursiainen, Inorg. Chem. Comm., 2000, 3, 508-510 DOI:10.1016/S1387-7003(00)00131-3
- Dennis W. Bennett, Tasneem A. Siddiquee, Daniel T. Haworth, Shariff E. Kabir and Farzana Camellia, J. Chem. Cryst., 2004, 34, 6, 353-359 DOI:10.1023/B:JOCC.0000028667.12964.28
Following a Reaction Path, the Quantum Nature of Ammonia
A low potential barrier exists between the two inverted structures of ammonia by the hydrogen atoms quantum tunnelling from one side of the nitrogen atom to the other. This purely quantum phenomenon causes "inversion doubling" of the vibrational modes of ammonia.
Calculations of ammonia will be carried out to understand more about the inversion processes of ammonia.
Symmetry
Different isomers of NH3 are going to be optimised using the 6-31G basis set and the B3LYP method to investigate the effect of symmetry on the structures, energies and optimisation time.
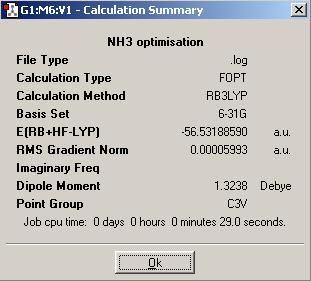
The calculation summary of the isomer of NH3 (ground state), in which the three bonds have the same length, is shown below:
The ground state NH3,with all the N-H bond lengths equal, has a point group of C3v.
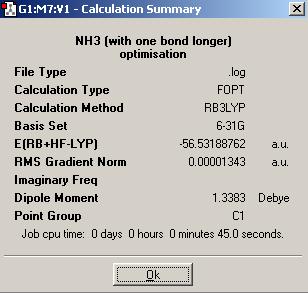
The calculation summary of the isomer of NH3, in which one of the bond is longer (1.01Å), is shown below:
The isomer of NH3 with one longer N-H bond length has a point group of C1.
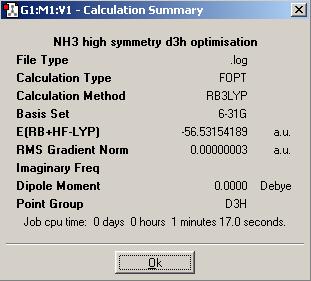
The calculation summary of the isomer of NH3 (the planar inversion transition state) with high symmetry is shown below:
The planar inversion transition state of NH3 with high symmetry has a point group of D3h.
It is known from the flow chart of point groups that these symmetry groups are related to one another (C1 is a sub-group of C3v and C3v is a sub-group of D3h).
A table to show the differences between the symmetry groups C3v, C1 and D3h is shown below:
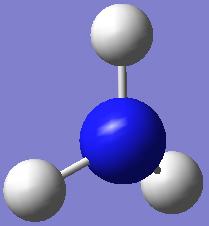
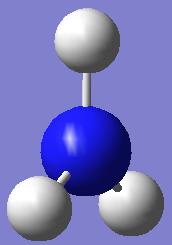
The final structure of the NH3 with the C3v has a trigonal pyramidal shape with all the N-H bond lengths (1.00591A) and H-N-H bond angles (116.251°) identical.
The final structure of the NH3 with the C1 has a distorted trigonal pyramidal with the three N-H bond lengths (1.00594A, 1.00595A and 1.00595A) and H-N-H bond angles (116.162°, 116.158° and 116.163°) similar to each other. This structure has no symmetry at all.
The final structure of the NH3 with the D3h symmetry has a trigonal planar shape with all the N-H bond lengths (1.00037A) and H-N-H bond angles (120.000°) identical.
The time taken to optimise the geometry of the NH3 with the D3h symmetry is the longest, following by the C1 symmetry and finally, the C3v symmetry, while C1 is a sub-group of C3v and C3v is a sub-group of D3h. This shows that the D3h symmetry has more symmetry elements for the programme to solve and hence is more symmetrical than the C3v symmetry, followed by the C1 symmetry.
Having looked at the structure of the molecules at each optimisation step, it can be seen that a molecule cannot "break symmetry" during an optimisation. This implies that if a high symmetry structure is entered to be optimised, the symmetry with the best optimisation may not be able to be produced for the final geometry but this is useful when a geometry with a particular symmetry is aimed to be produced.
The NH3 with the point group of D3h has the lowest energy geometry. The energy of the other two isomers above the energy of the lowest energy structure is 0.9 kJ/mol, which is not significant at all as the NH3 molecule itself is quite small. The only difference between NH3 molecules with different symmetries is just the relative positions of the three small H atoms and the interactions between these H atoms with the central N atom.
The Effect of Using Different Methods
The effect of using a better method and baisis set on the time it takes to do a calculation and on the final geometry and energies obtained is going to be investigated.
A NH3 molecule is created in the same way as before and optimised using a 6-311G basis set and the B3LYP method while the NH3 molecule with high symmetry is optimised using a 6-311 basis set and the MP2 method. This produces the ground state for NH3 under C3v symmetry and the planar inversion transition state which has D3h symmetry. The results are shown on the table below, together with the results obtained using the lower basis sets.
| Ground state with higher level basis set | Planar inversion transition state with higher level basis set | Ground state with lower level basis set | Planar inversion transition state with lower level basis set | |
|---|---|---|---|---|
| Method and basis set | 6-311G, B3LYP | 6-311G, MP2 | 6-31G, B3LYP | 6-31G, B3LYP |
| Time taken for calculation | 29 seconds | 1 minute 47 seconds | 29 seconds | 1 minute 17 seconds |
| Energy (a.u.) | -56.55181054 | -56.42664911 | -56.53188590 | -56.53154189 |
| Energy (kJ/mol) | -148477 | -148148 | -148424 | -148424 |
There is almost no effect of changing the basis set from 6-31G to 6-311G (a level higher) on the time taken for optimisation but the calculation takes longer (half a minute) for changing the method from B3LYP to MP2. With better basis set and method used, the energy difference between the ground state and the transition state changes quite a lot (from 0.00034401 to 0.12516143 a.u.) and becomes more reasonable.
However, the barrier height to inversion at these higher level of calculations is 329kJ/mol, which is 13.5 times larger than the experimentally determined barrier of 24.3 kJ/mol. This shows that even higher level of calculations should be used.
The Inversion Mechanism
In order to connect the ground state and transition state structures together on a "reaction path", something called a "scan" has to be computed by varying one coordinate while allowing all others to optimise. For the NH3, the H atoms are set to move down from the plane of the N atom. This allows us to follow the chemical reaction over time.
Vibrational Analysis
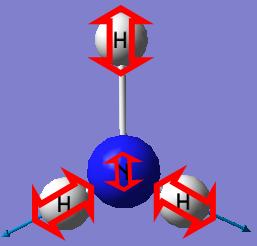
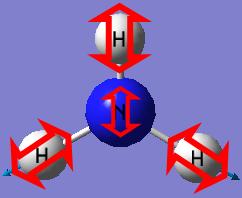
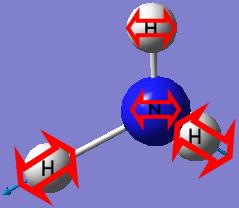
There are six positive frequencies for the C3v structure (all the frequencies obtained are positive) as the C3v structure is a ground state structure.
There is five positive frequencies for the D3h structure (only one negative frequency of -318.051) as the D3h structure is a transition state structure.
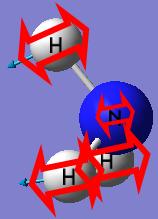
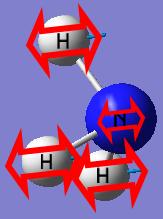
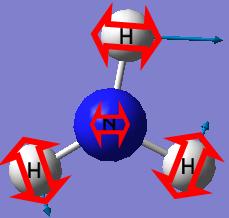
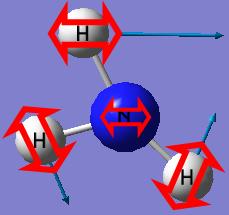
Vibration number 2 in the C3v and D3h structures follows the inversion reaction path. It forms a pyramidal shape under the C3v symmetry and a planar shape under the D3h symmetry.
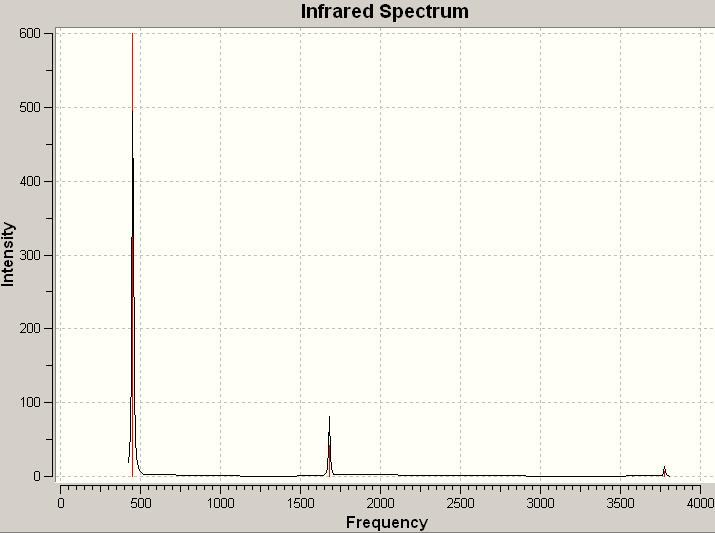
The computed IR spectrum for the C3v structure:
The computed IR spectrum for the D3h structure:
The shapes of the peaks in the two spectra are similar to each other.
Mini Project
Dinitrogen tetroxide, N2O4, is a powerful oxidising agent which attacks many metals; it has been used, with hydrazine as fuel, in rocket propellants. It coexists with nitrogen dioxide, NO2, in a rapidly established equilibrium.
The solid which consists of the dimer (N2O4) only is colourless and diamagnetic. It melts at -9°C to give a yellow liquid due to the presence of a little of the monomer (NO2), which is paramagnetic and is formed by the dissociation of N2O4. At 140°C, almost all the N2O4 is dissociated into NO2, resulting in a dark brown vapour. Above 140°C, the colour becomes lighter again due to the dissociation of NO2 to NO and O2.
The geometries, energies, MOs and vibrations of N2O4 and NO2 are going to be compared.
As both the N (with 7 electrons) and the O (with 8 electrons) are first row elements near to the second row, a 6-311+G(d,p) basis set and the B3LYP method are used for optimisations. 6-311+G(d,p) is a low level basis set but provides better level calculations than the 3-21G and 6-31G(d,p).
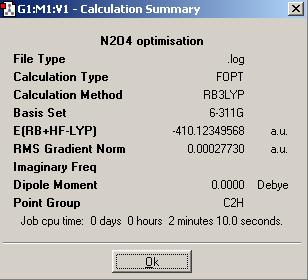
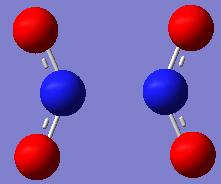
A calculation summary of the N2O4 molecule is shown below:
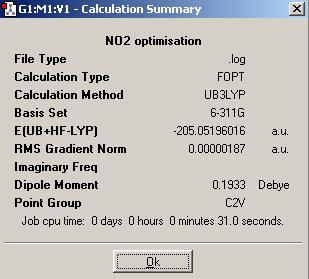
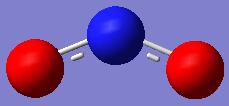
A calculation summary of the NO2 molecule is shown below:
Geometries and Energies
The bond lengths and bond angles obtained from the optimised structures are close to those reported in the literature. However, the bond lengths can still be improved by using higher level of calculations.
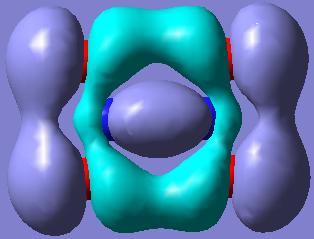
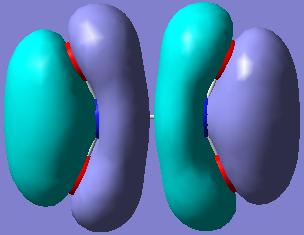
The O-N-O bonds in both of the N2O4 and NO2 structures are delocalised due to the (p-p)π-interactions between the N and the O atoms.
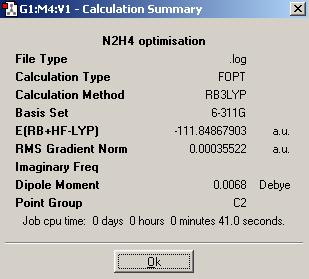
By optimising a molecule of N2H4 using the same level of calculations as before, it can be seen that the N-N bond length of the N2O4 is particularly long.
- Optimised N-N bond distance for N2H4: 1.05110A
- Optimised N-N bond distance for N2O4: 1.83151A
This arises because the delocalised O-N-O bonds pull the electron density away from the central N-N bond and weaken it.
Molecular Orbitals
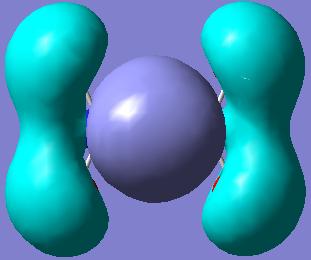
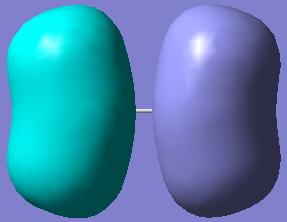
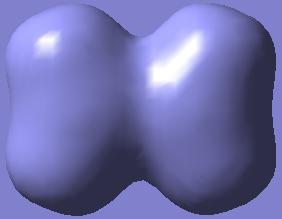
There are 23 occupied MOs, each filled with a pair of electrons, for the N2O4 molecule. This aligns with the fact that the solid, which consists of the pure dimer, is paramagnetic.
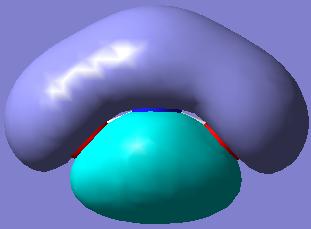
The MOs showing the (p-p)π-interactions of the N and the O atoms are shown below:
|
|
|
|---|---|---|
|
|
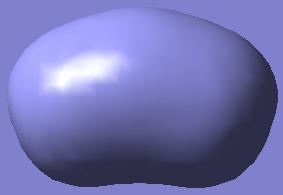
There are 12 occupied MOs for the NO2 molecule with an unpaired electron in the HOMO. This aligns with the paramagnetism of the monomer found in the vapour above -9°C.
Again, the MOs showing the (p-p)π-interactions of the N and the O atoms are shown below:

|
|
|
|---|
Vibrational Analysis
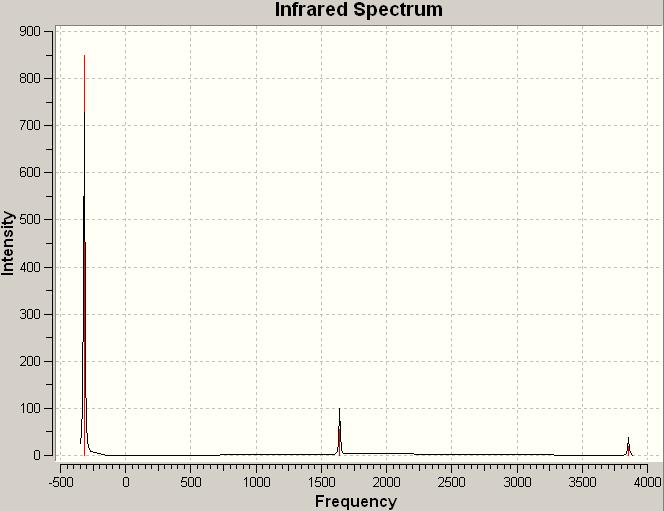
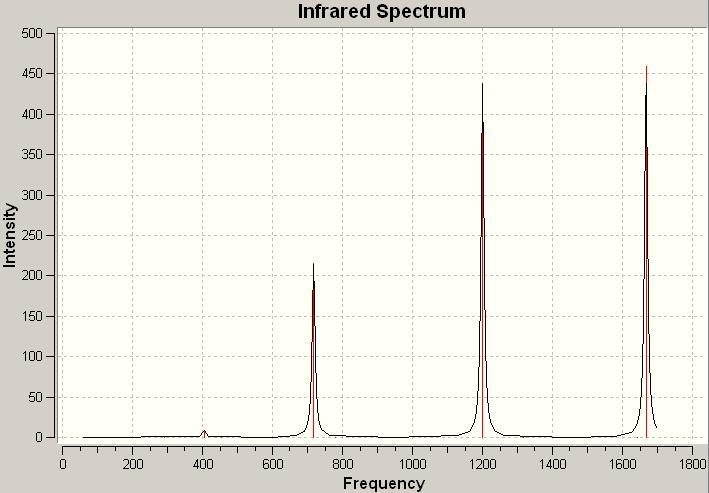
The computed IR spectrum for N2O4:
| No. | Frequency | Infrared |
|---|---|---|
| 1 | 89.2174 | 0 |
| 2 | 209.778 | 0.2311 |
| 3 | 290.74 | 0 |
| 4 | 406.031 | 9.1042 |
| 5 | 453.029 | 0 |
| 6 | 615.379 | 0 |
| 7 | 717.571 | 215.745 |
| 8 | 780.749 | 0 |
| 9 | 1200.25 | 438.262 |
| 10 | 1316.67 | 0 |
| 11 | 1642.65 | 0 |
| 12 | 1667.47 | 459.62 |
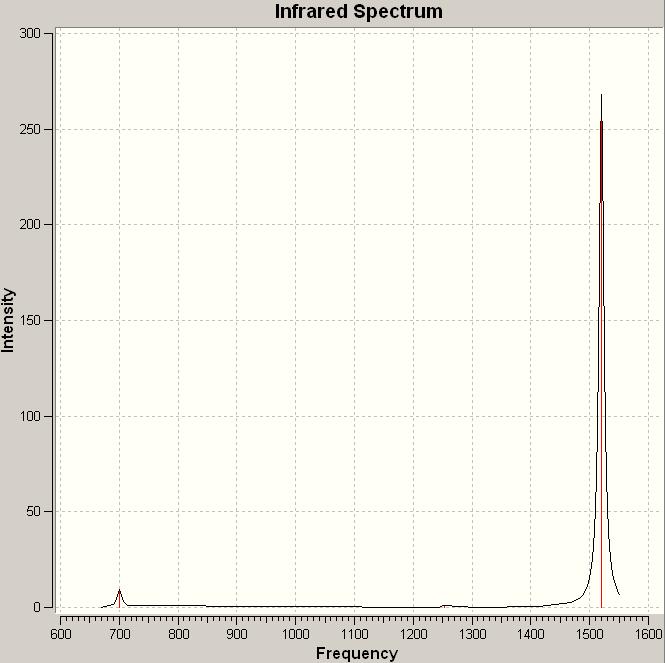
The computed IR spectrum for NO2:
| No. | Frequency | Infrared |
|---|---|---|
| 1 | 700.321 | 9.1488 |
| 2 | 1252.72 | 0.9094 |
| 3 | 1520.08 | 268.132 |
Reference
- Catherine E. Housecroft and Alan G. Sharpe, "Inorganic Chemistry", 2005, 2nd Ed., p.412-415
Do N2S4 and NS2 also form an equilibrium?
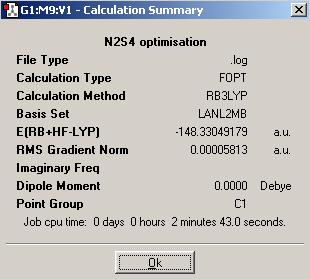
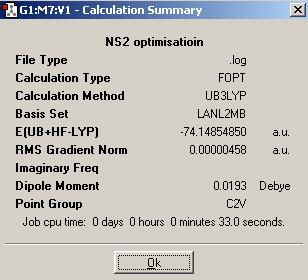
As S is a second row element with 16 electrons, a medium basis set, LanL2MB, and the B3LYP method should be used for optimisation of the N2S4 and NS2 structures.
| N2S4 | NS2 | |
|---|---|---|
| Geometry | 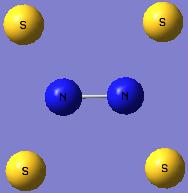
|

|
| Optimised N-S bond distance (A) | 1.82960 | 1.73550 |
| Optimised S-N-S bond angle (°) | 125.060 | 139.452 |
N2S4 and NS2 do not form equilibrium like N2O4 and NO2.

