
Rep:Mod:halfbaked09
Module 2
Introduction
The aim of this module is to investigate the structure of a variety of compounds using computational methods. The molecules are optimised to find their most stable structures and then the MOs can be displayed to show the electronic structure of the molecule. Frequency analysis is performed to support the optimisation process and determine whether a true minimum in energy has been reached for each molecule. In the latter stages, differences between geometric isomers will be analysed as well as variations on a similar structure in the mini project section.
BH3
The trigonal planar BH3 was drawn using Gaussian 09W 5.0 with B-H bond lengths of 1.5Å. The molecule was then optimised using the B3LYP method and 3-21G basis set. The optimised molecule has B-H bond length: 1.19 and H-B-H bond angle: 120o, both of these corresponded well to literature values.[1]
BH3 Optimisation
The parameters used for the optimisation were as follows:
File Name = BH3_OPT
File Type = .log
Calculation Type = FOPT
Calculation Method = RB3LYP
Basis Set = 3-21G
Charge = 0
Spin = Singlet
E(RB3LYP) = -26.46226338 a.u.
RMS Gradient Norm = 0.00020672 a.u.
Imaginary Freq =
Dipole Moment = 0.0000 Debye
Point Group = D3H
Job cpu time:  0 days  0 hours  0 minutes 12.0 seconds.
The calculation method of B3LYP determined the exact approximations used in the computational quantum mechanical calculations, while the basis set of 3-21G determined the accuracy to which the calculations were performed. The RMS (root-mean squared) of the energy gradient is used to confirm that the optimisation has been successful. Since the value of this is negligible (<0.001), indicating that there is no change in energy for small displacements, an energy convergence is shown to have been reached during the optimisation process. This is confirmed to be an energy minima using frequency analysis. The lowest energy attained is -26.5 a.u., which corresponds to literature values.[2]
       Item               Value     Threshold  Converged?
 Maximum Force            0.071036     0.000450     NO
 RMS     Force            0.046504     0.000300     NO
 Maximum Displacement     0.173205     0.001800     NO
 RMS     Displacement     0.113389     0.001200     NO
 Predicted change in Energy=-3.181185D-02
                           ----------------------------
                           !   Optimized Parameters   !
                           ! (Angstroms and Degrees)  !
 --------------------------                            --------------------------
 ! Name  Definition              Value          Derivative Info.                !
 --------------------------------------------------------------------------------
 ! R1    R(1,2)                  1.1935         -DE/DX =    0.0004              !
 ! R2    R(1,3)                  1.1935         -DE/DX =    0.0004              !
 ! R3    R(1,4)                  1.1935         -DE/DX =    0.0004              !
 ! A1    A(2,1,3)              120.0            -DE/DX =    0.0                 !
 ! A2    A(2,1,4)              120.0            -DE/DX =    0.0                 !
 ! A3    A(3,1,4)              120.0            -DE/DX =    0.0                 !
 ! D1    D(2,1,4,3)            180.0            -DE/DX =    0.0                 !
 --------------------------------------------------------------------------------
 |
 |
 |
BH3 NBO Analysis
A 'Natural Bond Orbital' analysis was performed on the optimised structure to determine the charge density on each of the atoms. As expected the resulting NBO charge distribution shows that the electron-deficient boron atom has a high positive charge and the hydrogen atoms a slight negative charge: B=0.332 and H=-0.111 (for all 3 H atoms). The equivalence of the charge of all three hydrogens
 |
 |
The data obtained is detailed in the below section of the Gaussian LOG file.
Summary of Natural Population Analysis:

                                       Natural Population
                Natural  -----------------------------------------------
    Atom  No    Charge         Core      Valence    Rydberg      Total
 -----------------------------------------------------------------------
      B    1    0.33161      1.99903     2.66935    0.00000     4.66839
      H    2   -0.11054      0.00000     1.11021    0.00032     1.11054
      H    3   -0.11054      0.00000     1.11021    0.00032     1.11054
      H    4   -0.11054      0.00000     1.11021    0.00032     1.11054
 =======================================================================
   * Total *    0.00000      1.99903     6.00000    0.00097     8.00000
NBO analysis can also provide information on the character of the molecular orbitals. The below section of the Gaussian LOG file details the s and p character of the four occupied MOs, where the first three orbitals show the formalised 'sp2' character and the fourth orbital has 100% s character and is entirely localised on the boron atom. This all aligns with the theory that BH3 is a trigonal planar molecule.
(Occupancy)   Bond orbital/ Coefficients/ Hybrids
 ---------------------------------------------------------------------------------
     1. (1.99853) BD ( 1) B   1 - H   2
                ( 44.48%)   0.6669* B   1 s( 33.33%)p 2.00( 66.67%)
                                            0.0000  0.5774  0.0000  0.0000  0.0000
                                            0.8165  0.0000  0.0000  0.0000
                ( 55.52%)   0.7451* H   2 s(100.00%)
                                            1.0000  0.0000
     2. (1.99853) BD ( 1) B   1 - H   3
                ( 44.48%)   0.6669* B   1 s( 33.33%)p 2.00( 66.67%)
                                            0.0000  0.5774  0.0000  0.7071  0.0000
                                           -0.4082  0.0000  0.0000  0.0000
                ( 55.52%)   0.7451* H   3 s(100.00%)
                                            1.0000  0.0000
     3. (1.99853) BD ( 1) B   1 - H   4
                ( 44.48%)   0.6669* B   1 s( 33.33%)p 2.00( 66.67%)
                                            0.0000  0.5774  0.0000 -0.7071  0.0000
                                           -0.4082  0.0000  0.0000  0.0000
                ( 55.52%)   0.7451* H   4 s(100.00%)
                                            1.0000  0.0000
     4. (1.99903) CR ( 1) B   1           s(100.00%)
                                            1.0000  0.0000  0.0000  0.0000  0.0000
                                            0.0000  0.0000  0.0000  0.0000
BH3 Frequency Spectrum Analysis
The six vibrational modes of BH3, below, were calculated using Gaussview09 frequency analysis. The frequencies obtained can not only be used to determine whether the energy optimisation process has led to an energy minima rather than maxima or transition state, but also to illustrate the vibrational modes which are excited during IR spectroscopy and hence can be used to obtain a reasonably accurate IR spectrum for the molecule.
| Vibration | Illustration | Description of Vibration | Frequency cm-1 | Intensity | Symmetry Label |
|---|---|---|---|---|---|
| 1 |  |
"Wagging motion", out of plane of molecule bending where all hydrogens oscillate in a concerted motion | 1144 | 92.9 | a2" |
| 2 |  |
Scissoring motion in the plane of molecule where two hydrogens oscillate concertedly | 1204 | 12.3 | e" |
| 3 |  |
Twisting in the plane of molecule | 1204 | 12.3 | e" |
| 4 |  |
Symmetric stretch of all B-H bonds, boron remains static | 2598 | 0.0 | a1' |
| 5 |  |
Asymmetric stretch, where one B-H stretches as another compresses | 2737 | 103.7 | e' |
| 6 |  |
Asymmetric stretch, with one strong B-H stretch and two weaker stretches | 2737 | 103.7 | e' |
The low frequencies were observed in the output file (cm-1): -66.8, -66.4, -66.4, 0.0, 0.0, 0.2 These are all very close to zero and hence show that the calculation was successful, with the frequencies relating closely to the centre of mass of the BH3 molecule. Since all of the 'Real' frequencies are positive, the energy values obtained are indeed all minima. The frequency values correspond well with those found in literature.[3]
The IR spectrum produced by the Gaussian Frequency analysis is shown below. Despite there being six vibrational modes, only three peaks are present on the spectrum as not all vibrations are IR active. Since 'Vibration 4' is symmetric with symmetry label a1', it has an intensity of zero and hence does not appear on the IR spectrum. In addition to this, there are two sets of degenerate vibrational modes, each giving rise to one peak , resulting in only three peaks arising on the IR spectrum in total.

BH3 MO Analysis
The MO diagram, below, was produced using the optimised BH3 structure. The BH3 molecule has a highly symmetric structure and belongs to the D3h point group. The only variation from literature sources, based on theory, was that the 3a'1 orbital and 2e' orbitals have been interchanged in position.[4] The reason for this disparity between the computational calculations and LCAO theory can be explained by the inability of LCAO theory to accurately predict the relative strength of s-s orbital interactions in comparison with s-p orbital interactions, and hence the relative energies of the 3a'1 and 2e' energy orbitals. The computational method is in fact more accurate since it uses quantum mechanics, by solving the Schrödinger Equation, to calculate the relative MO energies, allowing for a more accurate MO diagram to be constructed. MO theory is still useful as it is a relatively reliable and accurate method to calculate the energy and provide a general understanding of molecular orbitals without requiring the complex calculations and processing power necessary for computational based calculations.

Thalium Tribromide, TlBr3
As with BH3, the TlBr3 molecule was optimised using Gaussian09 and the calculation method of B3LYP. However, a more sophisticated basis set of LANL2DZ (pseudo-potential) was used with the tolerance set very tight as required by the use of heavier atoms and hence a more complex electronic structure.
Optimisation of Thalium Tribromide
The parameters used for the optimisation were as follows:
File Name = TlBr3_opt
File Type = .log
Calculation Type = FOPT
Calculation Method = RB3LYP
Basis Set = LANL2DZ
Charge = 0
Spin = Singlet
E(RB3LYP) = -91.21812851 a.u.
RMS Gradient Norm = 0.00000090 a.u.
Imaginary Freq =
Dipole Moment = 0.0000 Debye
Point Group = D3H
Job cpu time:  0 days  0 hours  0 minutes 12.0 seconds.
The optimised molecule has Tl-Br bond length: 2.65Å and Br-Tl-Br bond angle: 120o, both of these are in agreement, to a reasonable degree of accuracy, with the literature value of 2.52Å and 120o, respectively.[5] Once again the energy gradient value is negligible (<0.001), indicating an energy convergence has been reached during the optimisation process. Again, this is confirmed to be an energy minima using frequency analysis.
The same method and basis set must always be used for both the optimisation and frequency calculations since it determines the accuracy with which the results are given. If different basis sets were to be used, the result would be incomparable as different parameters would have been used, resulting in differing outputs.
 |
 |
 |
Thalium Tribromide Frequency Spectrum Analysis
A frequency analysis must be carried out on the molecule to determine whether the energies obtained during the optimisation process are energy minima or merely transition states. The frequency is the second derivative of the potential energy surface and hence, if greater than zero, represent a minimum.
| Vibration | Illustration | Description of Vibration | Frequency cm-1 | Intensity | Symmetry Label |
|---|---|---|---|---|---|
| 1 |  |
Scissor motion of Br atoms in plane of molecule | 46 | 3.7 | e' |
| 2 |  |
Rocking motion of Br atoms around Tl, in plane of molecule | 46 | 3.7 | e' |
| 3 |  |
Wagging motion of Br atoms, out of plane of molecule | 52 | 5.8 | a2 |
| 4 |  |
Symmetric stretch of Br atoms away from Tl | 165 | 0.0 | a1' |
| 5 |  |
Asymmetric stretch of two Br atoms | 210 | 25.5 | e' |
| 6 |  |
Asymmetric stretch of all Br atoms | 210 | 25.5 | e' |
The low frequencies were observed in the output file (cm-1): -3.4, 0.0, 0.0, 0.0, 3.9, 3.9 These values are all extremely close to zero and hence show that the calculation was successful, with the frequencies relating closely to the centre of mass of the TlBr3 molecule. Real Low Frequencies (cm-1): 46.4, 46.4, 52.1 Since all of the 'Real' frequencies are positive, the energy values obtained are indeed all minima. The lowest 'Real' normal mode is hence 46.4cm-1
The IR spectrum produced by the Gaussian Frequency analysis is shown below. As with BH3, there are only three peaks present on the spectrum for the six vibrational modes. Once again, 'Vibration 4', symmetry label a1', is symmetric with intensity zero on IR spectrum. As with BH3 there are two sets of degenerate vibrational modes, each giving rise to one peak, resulting in only three peaks arising on the IR spectrum in total.

What is a bond?
Gaussview does not always draw a bond where expected if it deems the interaction between the atoms to be too weak to form a localised bond due to their internuclear distance exceeding a certain value. However, these interactions are still accounted for in the analysis, and visible bonds can be included manually.
A chemical bond is the localised interaction between two or more atoms, resulting in the release of energy and stabilisation of all atoms concerned. Bonds can take many forms from the transfer of electrons from one atom to another in ionic bonding, the sharing of atoms to form a covalent bond, the intermolecular interactions such as dipole-dipole, ion dipole, instantaneous-induced dipole interactions and hydrogen bonds; all of these have a widley varying strength.
Mo(CO)4L2 Geometric Isomerism
The aim of this section is to use computational methods to analyse and compare the MOs and IR spectra of the two Molybdenum geometric isomers. Although Mo(CO)4(PPh3)2 isomers have been studies in depth, it was decided to replace the PPh3 groups with PCl3 due to their similar electronic and steric effects, since the former would require too much computing power.
For both isomers the B3LYP calculation method was used first with the psuedo-potential LANL2MB basis set with loose convergence to give an approximation of the molecule's geometry. This was then required to be reconfigured manually, adjusting the dihedral angles to produce the below geometries, followed by LANL2DZ with tight convergence (Additional words: int=ultrafine scf=conver=9) to find the true energy minima.

The value of the energy gradient for both molecules is negligible (<0.001), indicating that an energy convergence has been reached during the optimisation process. The Mo-P bond attained for the cis isomer is 2.51Å and that of the trans isomer is 2.44Å, which correspond to their respective literature values of 2.58Å and 2.50Å.[7] The cis-isomer Mo-P bond length is slightly longer due to the steric repulsion of the bulky PCl3 groups.[8] The P-Mo-P bond angle obtained is 94.1o for the cis isomer, compared to a literature value of 104o and 177.4o for the trans isomer, while literature states a value of 180o[7]. This disparity between the computed values and literature is likely to be due to the limitations of the Gaussian program used. It is possible that the true energy minimum was not quite found and that this is an intermediate, local minimum which is slightly higher in energy. The lowest energy attained for the cis isomer is -623.577 a.u. (1.637201602 x 10⁶kJmol-1) and that of the trans isomer is -623.576 a.u. (1.63719887 x 10⁶kJmol-1), hence there is a difference of 2.73 kJmol-1. The slightly higher stability of the trans isomer can be explained by a reduced destabilising steric interactions compared to the cis isomer, however this difference is not very significant considering that the error on a Gaussian calculation like this is approximately 10kJmol-1. This potential error means it can not be confirmed reliably that the trans isomer is indeed lower in energy and so practical experimentation should be carried out to confirm the results obtained computationally.
| The parameters used for the optimisation | Molecule |
|---|---|
File Name = log_47678-2 File Type = .log Calculation Type = FOPT Calculation Method = RB3LYP Basis Set = LANL2DZ Charge = 0 Spin = Singlet E(RB3LYP) = -623.57707195 a.u. RMS Gradient Norm = 0.00000418 a.u. Imaginary Freq = Dipole Moment = 1.3099 Debye Point Group = C1 Job cpu time: 0 days 1 hours 11 minutes 46.0 seconds. |
4L2_cis_pic.jpg) |
File Name = log_47679 File Type = .log Calculation Type = FOPT Calculation Method = RB3LYP Basis Set = LANL2DZ Charge = 0 Spin = Singlet E(RB3LYP) = -623.57603105 a.u. RMS Gradient Norm = 0.00001592 a.u. Imaginary Freq = Dipole Moment = 0.3049 Debye Point Group = C1 Job cpu time: 0 days 0 hours 48 minutes 3.2 seconds. |
The energy gradient for both is negligible (<0.001), indicating that the optimisations were successful
Mo(CO)4(PCl3)2 Frequency Spectrum Analysis
Both geometric isomers have 45 vibrational modes calculated using Gaussview09 frequency analysis, however only certain frequencies have been analysed in this report.
Below are the two very low level frequencies obtained for both the cis and trans isomers. These low level vibrational modes have extremely low intensities and are due to the 'wagging' of the PCl3 groups and are accessible even at room temperature due to the very low energy input required to produce them.
| Vibration | Illustration | Frequency cm-1 | Intensity |
|---|---|---|---|
| Cis |  |
11 | 0.0 |
| Cis |  |
18 | 0.0 |
| Trans | 5 | 0.4 | |
| Trans | 6 | 0.3 |
| Vibration | Illustration | Frequency cm-1 | Intensity | Literature Frequency cm-1 |
|---|---|---|---|---|
| Cis |  |
1945 | 762.9 | 1899 |
| Cis |  |
1949 | 1498.4 | 1905 |
| Cis |  |
1958 | 632.9 | 1922 |
| Cis |  |
2023 | 597.7 | 2019 |
| Trans | 1950 | 1475.4 | 1895 | |
| Trans | 1951 | 1466.8 | 1895 | |
| Trans | 1977 | 0.7 | - | |
| Trans | 2031 | 3.8 | - |
| Cis-isomer spectrum | Trans-isomer spectrum |
|---|---|
4L2_cis_Spectrum.jpg) |
The low frequencies were observed in the output file are all close to zero and hence show that the calculation was successful. Since all of the 'Real' frequencies are positive, the energy values obtained are indeed all minima further confirming that the molecules have been successfully optimised.
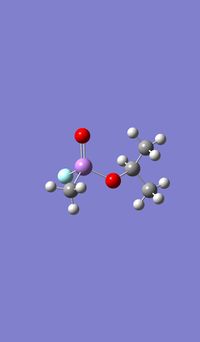
Mini Project - Sarin and Variations
The aim of this mini project is to investigate the effect of varying atom size and electronegativity on the MO interactions and the structure of the molecule. It consists of optimising and analysing the molecule Sarin, a toxic colourless and odourless liquid, and two variations on this structure; one replacing the phosphonyl oxygen with sulphur, and separately, replacing the phosphorus with arsenic.
Optimisation
For both isomers the B3LYP calculation method was used first with the psuedo-potential LANL2MB basis set with loose convergence to give an approximation of the molecule's geometry. This was then required to be reconfigured manually, adjusting the dihedral angles, followed by LANL2DZ with tight convergence (Additional words: int=ultrafine scf=conver=9) to find the true energy minima. The value of the energy gradient for both molecules is negligible (<0.001), indicating that an energy convergence has been reached during the optimisation process.
| The parameters used for the optimisation | Molecule |
|---|---|
File Name = log_47739 File Type = .log Calculation Type = FOPT Calculation Method = RB3LYP Basis Set = LANL2DZ Charge = 0 Spin = Singlet E(RB3LYP) = -415.21708186 a.u. RMS Gradient Norm = 0.00000510 a.u. Imaginary Freq = Dipole Moment = 3.6934 Debye Point Group = C1 Job cpu time: 0 days 0 hours 37 minutes 50.4 seconds. |
 |
File Name = log_47773 File Type = .log Calculation Type = FOPT Calculation Method = RB3LYP Basis Set = LANL2DZ Charge = 0 Spin = Singlet E(RB3LYP) = -350.11236378 a.u. RMS Gradient Norm = 0.00000113 a.u. Imaginary Freq = Dipole Moment = 3.5416 Debye Point Group = C1 Job cpu time: 0 days 0 hours 58 minutes 12.3 seconds. |
 |
File Name = log_47774 File Type = .log Calculation Type = FOPT Calculation Method = RB3LYP Basis Set = LANL2DZ Charge = 0 Spin = Singlet E(RB3LYP) = -414.83945582 a.u. RMS Gradient Norm = 0.00000318 a.u. Imaginary Freq = Dipole Moment = 3.9077 Debye Point Group = C1 Job cpu time: 0 days 0 hours 32 minutes 20.9 seconds. |
 |
As with the Mo(CO)4Cl2 isomers, for all three molecules the B3LYP calculation method was used first with the psuedo-potential LANL2MB basis set with loose convergence followed by LANL2DZ with tight convergence. The value of the energy gradient for all three molecules is negligible (<0.001), indicating that an energy convergence has been reached during the optimisation process. The lowest energy attained for Sarin is -415.2 a.u., which corresponds to literature values.
MO Analysis
More time was required to present a comprehensive MO analysis for this mini project. However a preliminary investigation was carried out. It was found that more electronegative atoms have higher contribution to lower orbitals, in agreement with LCAO theory.
The HOMO of Sarin shows high electron density on the carbonyl Oxygen atom.


Frequency Analysis
The vibrational modes corresponding to the P=O , P=S and As=O bonds respectively were examined. It was found that each molecule had two frequencies relating to each of these, as shown below.
| Vibration | Illustration | Frequency cm-1 | Intensity |
|---|---|---|---|
| Sarin |  |
968 | 10.0 |
| Sarin |  |
1086 | 137.2 |
| Sarin with Sulphur replacing phosphyl Oxygen |  |
852 | 111.6 |
| Sarin with Sulphur replacing phosphyl Oxygen |  |
874 | 35.9 |
| Sarin with Arsenic replacing Phosphorus |  |
480 | 10.6 |
| Sarin with Arsenic replacing Phosphorus |  |
669.4 | 121.5 |
The frequency analysis shows that all of the IR abosorptions correspond well to literature values.[10] With more time, further analysis of other bonds would have been undertaken in order to confirm the success of the optimisation process for each molecule.
| Sarin IR spectrum | Sarin with Sulphur replacing phosphyl Oxygen spectrum | Sarin with Arsenic replacing Phosphorus spectrum |
|---|---|---|
 |
 |
 |
Conclusion
Along with IR spectrum analysis, due to its chiral tetrahedral phosphorus centre, optical analysis may also be performed on Sarin. Along with NMR analysis, analysis of the optical properties of Sarin would be an interesting development to this project, which would have been pursued if time had allowed.
References
- ↑ M. S. Schuurman et al, J. Computational Chemistry, 2005, 26, 1106-1112
- ↑ M. Gelus, W. Kutzelnigg, Theoret chim Acta, 1973, 28, pp. 105
- ↑ M. Gelus, W. Kutzelnigg, Theoret chim Acta, 1973, 28, pp. 108
- ↑ Dr Trisha Hunt 2nd year lecture note
- ↑ J. Glaser, G. Johansson. Acta Chemica Scandinavica A 36 (1982) 125-135
- ↑ Module 2, Computational Laboratory
- ↑ 7.0 7.1 G. Hogarth, T. Norman, Crystal Structures of trans-[Mo(CO)4(PPh3)2, Inorganica Chimica Acta, Volume 254, 1997, 167-171
- ↑ F.A. Cotton, D.J. Darensbourg, S. Klein and B.W.S. Kolthammer, Inorg. Chem., 21(1982) 294
- ↑ F. A. Cotton et al, J. Inorg. Chem, 1982, 21, 2661-2666
- ↑ http://pubs.acs.org/doi/pdf/10.1021/ac60054a008