Rep:Mod:god22123
Daniel Godfrey - Physical Chemistry Computational Laboratory - Dr Mike Bearpark
The Transition State
Introduction
In this computational laboratory the main objectives will be to study the potential energy profiles of two famous reaction mechanisms studying the logistics of the crucial points on the surface with regard to change in chemical composition and interpretation. The two reactions studied will be the Cope Rearrangement and [4+2] cycloaddition, exclusively known as the Diels-Alder reaction. The focus in the treatment of these reactions will be to isolate the transition state structures of the two reaction and to study computed geometry and energetics in order to characterise these structures by spectroscopy.
In contrast to previously undertaken work, larger molecular transition states will be studied which requires numerical solving of the Schrodinger equation and use of computational molecular orbital based computational methods, aiming to incorporate the labile nature of certain bonds in reactive systems. These approaches require complex quantum mechanical treatment of the molecule in terms of its electronic distribution and therefore view of bonding and geometries.
During the course of the procedure, yielded reaction profiles will serve for calculation of activation enthalpies and atomic motion whilst overcoming the maximum energy point on the potential energy profile that limits the course of the reaction. Predictions will be made and evaluated with respect to the computational results obtained and the literature throughout.
The Cope Rearrangement
Introduction
The Cope Rearrangement being studied is that of 1,5-hexadiene. The correct nomenclature of this reaction is a [3,3]-sigmatropic rearrangement and objectives include the location of crucial maximum (transition state structure) and minimum (equilibrium structure) points on the potential energy surface. In the act of doing this the nature of the energetically preferred mechanism should be resolved, as much controversy has surrounded this aspect in the past. Although direct instruction is given in this section of the report, concise details of how results were obtained and interpretation of the results has been included. Also evaluation of the methods used and possible improvements will be looked at.
Molecular Optimisation
Excellent results are cited when using the B3LYP method and the 6-31G* basis set[1], and as reproduction of this information is invaluable in computational chemistry this process will be undertaken of both products and reactants in order to consider the potential energy surface as a whole from all possible directions. It is however important to pre-optimise the structure in order to save time, computational processing cost and improve accuracy and for these reasons initial optimisation is carried out at the HF/3-21G, at which level accuracy is low however job time is extremely low (of the order of minutes). Two conformers of the reactant are considered one bearing a gauche relationship between the alkyl-linked carbons and one bearing an anti relationship between the same aforementioned carbon atoms. Having completed the optimisation through Gaussian the summary windows for the two optimisations were considered and have been published below in table 1. Diagrams identifying the difference between the two conformers are also illustrated in figure 1.
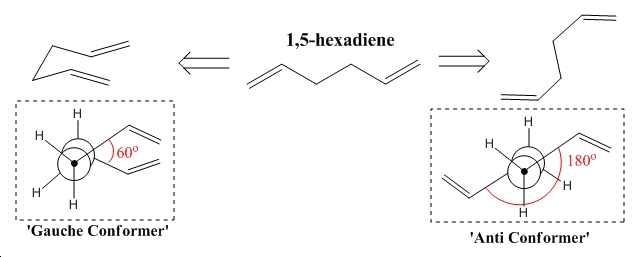
∆Figure 1 - Conformers of 1,5-hexadiene
|
Summary Windows for the HF Pre-Optimisation of Conformers of 1,5-hexadiene |
|
 |
 |
∆Table 1 - Summary windows for pre-optimisations
Of course it is be expected that the lowest energy structure for 1,5-hexadiene would be the anti-conformer due to the A1,2 strain observed between the gauche related carbons in the 'gauche conformer'. However the results of the HF pre-optimisation contradict this fact, making the gauche conformer more stable by 280Jmol-1. This suggests that the Hartree-Fock method is very poor at approximating the total energy of such molecules as the gauche effect is not expected to be significant due to the similar electronegativities of the carbon and hydrogen atoms.
Based on the results above and the appendix it is suggested that a linear chain 1,5-hexadiene would be the lowest energy conformation with the bulk of the molecule being in antiperiplanar arrangement to the entirity of the rest of the molecule. However, this conformation has been considered below and is the high symmetry Anti-2 conformation which bears Ci symmetry. As symmetry is entropy disfavoured it is postulated that a distortion of the anti-2 conformation would be the lowest energy conformation obtainable. Evidence for this fact is given by optimisation as Ci symmetry can't be assigned to the optimisated structure without using loose fitting criteria.
From the cited appendix[2], the gauche conformer attained computationally above is the lowest energy Gauche3 conformer, as the energies and geometries match to the degree of accuracy given. From the same appendix the anti-conformer attained has been identified as slightly distorted away from the so-called Anti-2 geometry given a relative energy that is approximately 0.1kCalmol-1 above that of the lowest energy anti conformation. It is a geometry that is slightly distorted away from that of Anti-2 as the reported point group symmetry of Ci was not attainable from the Hartree-Fock pre-optimised geometry.
Point Group Attainment
At HF level, neither conformer showed any computationally recognisable symmetry and could not be confined to a point group even at the lowest tolerance available. Gaussview arbituarily assigns imaginary point group C1 for both conformers at this stage of the optimisation.
The high symmetry Anti-2 geometry was drawn and optimised initially at the HF/3-21G level and the following results summary was obtained.
|
Summary Windows for the HF Optimisation of Anti-2 |
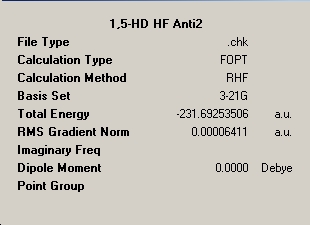 |
∆Table 2 - Summary windows for Anti-2
The energy resolved for the high symmetry Ci conformer is equal to that in the literature to the degree of accuracy stated. This shows that for high symmetry non-strained conformation the Hartree-Fock method of computational analysis is sufficiently accurate with a potential error of +/-10 Jmol-1.
This structure was then re-submitted to Gaussian to be optimised under the density functional theory including the B3LYP method and 6-31G(d) basis set. The energies and geometries of the two compounds have been compared below by featuring the Jmol representations of the two molecules and the summary window for the DFT optimised structure (see above for HF optimised window).
∆Table 3 - Comparison of HF and DFT methods for Anti-2
The difference in visual geometry is apparent between the two levels of theory. Including a higher level of consideration of the quantum mechanical frontier orbital effects are clearly very important in determining the geometry of such simple molecules. Some geometric parameters have been contrasted above in table 3, which show that although both optimised molecules have a centre of inversion and high symmetry the bond angles and lengths can still vary significantly.
The included parameters for the two optimisations shows that although the bond lengths are relatively the same to the degree of accuracy given the angles observed change fairly dramatically. The angles quoted show an average discrepancy of 1.0% between the two levels of approximation, which is significant to the realised structure. The largest different seen is between the dihedral angle at each end of the molecule which varied by almost 4%, and becoming very important to the realised structure.
The energies resolved by the two different methods are not directly comparible as they use a different method and are not related but the energy is nonetheless given in the table 3, for use in the computation of the activation energy of the process.
Infrared Frequency Analysis
Thus far the optmisations have not been placed in the correct context and are not directly comparible to literature values, without additional factors being included. This can be carried out via a frequency analysis which will examine the area of the potential energy surface locally to the pre-optimised structure to characterise the important stationary points in the immediate viscinity of the optimised structure. This analysis may yield a local maximum and may yield a local minimum, and thus this technique will be used to prove that a minimum point has been reached.
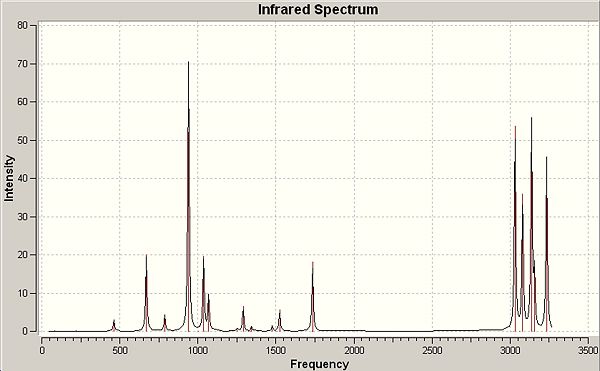
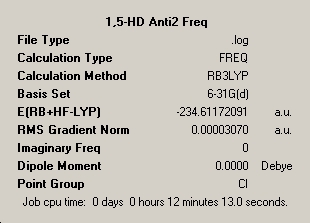
The summary window for the optimisation has been published along with the accomopanying computed infra-red spectrum for Anti-2, optimised to the B3LYP/6-31G(d) level. A minimum point is confirmed by the fact that there were no computed imaginary frequencies and although the point group of the molecule is quoted as C1 a low tolerance 'symmetrization' yields the Ci point group symmetry.
|
Summary Windows and Infrared Spectrum for Anti-2 conformer of 1,5-hexadiene |
|
 |
 |
∆Table 4 - Summary windows for frequency analysis and infrared-spectrum
Energies obtained via different methods aren't directly comparible however the frequency analysis may have arrived at a differing point on the forecasted potential energy surface, of which any extra energy is accountable for by packing energetics as mentioned. The energies obtained suggest that these effects that bring the computed energy into real phase account for 6Jmol-1, and this can be considered only a minor deviation from that of the gaseous approximation as the percentage difference is 5x10⁻⁴%.
Thermochemistry
Zero-point correction=                           0.142538 (Hartree/Particle)
Thermal correction to Energy=                    0.149880
Thermal correction to Enthalpy=                  0.150824
Thermal correction to Gibbs Free Energy=         0.110974
#Sum of electronic and zero-point Energies=           -234.469183
#Sum of electronic and thermal Energies=              -234.461841
#Sum of electronic and thermal Enthalpies=            -234.460897
#Sum of electronic and thermal Free Energies=         -234.500747
The values above are taken from the log file for the anti-2 conformer and all values are given in Hartree per molecule. Literature values have been found to compare to these computed values. The description of the definition of the non-intitive terms above are given in the following bullet points:
- Sum of electronic and zero-point energies - the potential energy at 0 K including the zero-point vibrational energy [E = Eelec + ZPE].
- Sum of electronic and thermal energies - the energy at room temperature and pressure, including contributions from the translational, rotational, and vibrational energy modes at this temperature [E = E + Evib + Erot + Etrans].
- Sum of electronic and thermal enthalpies - contains an additional correction for RT [H = E + 8.314T].
- Sum of electronic and thermal free energies - includes the entropic contribution to the free energy [G = H - TS].
This section will not be used directly now but this information will be used for the following transition structure calculations in order to verify the success of the procedure. Literature values for G, H, S and zero-point energy could not be found that were directly comparible via the use of the same computational method and basis set.
It is possible to be more specific and calculate values more appropriate to a certain temperature. This has been done for the arbitary 0K, using the Gaussian Freq=ReadIsotopes facility.
The link to the .txt file result is given here: [1]
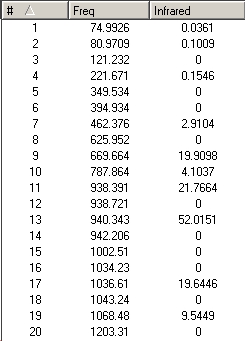
There is no visual difference in the appearance of the IR spectrum as expected however there are small changes in the absolute wavenumbers of vibration. This is due to the frequency calculation being carried out above the vibrational zero energy and the small changes in the wavenumber are accounted for in this way. At absolute zero there is no background interference and vibrations require only a single quanta of energy to vibrate so the linewidths are smaller according to the lesser uncertainty. The differences in the wavenumbers is illustrated by the following two vibrational summary screenshots.
Normal Frequency Analysis
Freq=ReadIsotopes

Transition Structures
Introduction
Two possible transition structures can be envisaged depending on the conformation of the molecule that undergoes reaction. The two possibilities are the less strained 'chair' transition state and the 'boat' transition state. From prior knowledge of the preferred conformation of cyclohexanes it is clear that the 'chair' transition state should lie lower in energy than the 'boat' transition state. The stages in this section will be transition structure optimization including analysis of computed force constants and using two new features: (i) the 'redundant coordinate editor' (ii) 'QST2'. The reaction profile will be tracked via the reaction coordinate concept and the eventual output will be activation enthalpies for the Cope Rearrangement via each transition structure.
The symmetry that of the transition states is well publicised and will be commented on throughout the analysis. Methods such as IRC and computing force constants will also be investigated along side this approach.
The starting point for this process was to optimise an allyl fragment to the HF/3-21G level of theory and then to use it to create the transition state guesses and to provide the basis on which to build a good approximation of the optimised geometries. Two differing methods will be utilised to work from this common initial point.
Optimising Transition Structures
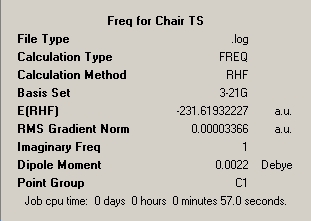
Transition state optimizations are more complex than optimisations as the preferred formation of bond (i.e. approach of two fragments) has to be stipulated in order to stop optimisation repelling the fragments away from eachother due to the lack of bond to coordinate the traversing of the potential energy surface. This will therefore be carried out in two stages manually, one of which includes utilising the 'Hessian', a so-called force constant matrix, and this matrix is updated from the initial guessed geometry from alignment of two allyl fragments. This method should be effective for a simple transition state such as the chair transition state but will not be accessible to the more complex boat conformation. This method produces the so called 'Berny' transition state observed in table 9.
Also for the chair transition structure optimisation the redundant coordinate editor function can utilised. This method is used to freeze certain coordinates in the molecule in order to obtain the correct array before ultimately precise optimisation is achieved in a separate stage. Opt=ModRedundant is the keyword utilised and the method can lead to the Hessian being formed from one guess only and is important in time-manangement for more complex problems and the chair transition state being considered is relatively simply aligned manually and this process is not efficient. The optimisation of the chair structure was carried out by each method. However for the more complex boat transition state neither is an effective means of optimisation.
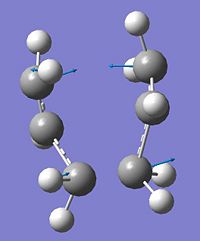
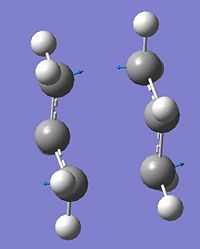
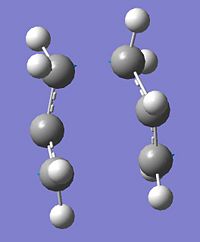
Following the 'Berny' transition state optimisation of the chair conformation the single imaginary frequency was visualised and published in the following table to confirm that it corresponds to the transition between the two rearranged structures.
|
# |
Vibrational Motion |
Wavenumber (cm-1) |
Intensity |
||
|
Initial Position |
Equilibrium Position |
Final Position |
|||
|
1 |
 |
 |
 |
-818cm-1 |
5.9 |
|
-Vibration corresponds to a wagging of the two allyl fragments symmetrically with respect to eachother which compresses and elongates the bond partially forming and breaking in the transition structure. This is interpretted as the simultaneous and concerted formation of one bond and breaking of another. |
|||||
∆Table 5 - Vibrational Analysis of Chair Transition State
The optimised structures via each approach is shown below in a later section where comparisons will be drawn.
QST2 Method
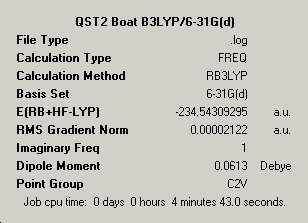
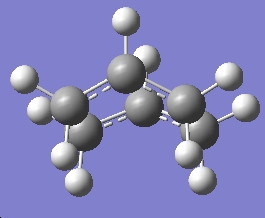
As the boat transition structure could not be carried out be the previously described methods an alternative called the QST2 method was utilised. The density functional theory optimised Anti-2 geometry was opened and the numbering was manipulated in the arbitarily chosen reactant and product molecules. The QST2 job failed yielding a structure that is similar to the chair transition structure but more dissociated seen in table 6. Upon the necessary amendments the correct transition state appearance was identified showing the geometry below in table 7.
|
Realised Structure when Attempted QST2 Unamended |
 |
∆Table 6 - QST2 Failed Structure
|
Realised Structure when Attempted QST2 Amended |
 |
∆Table 7 - QST2 Successful Structure
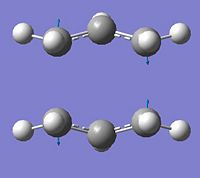
It was true that there was only one imaginary frequency for the QST2 resolved transition structure which did indeed correspond to the sigmatropic rearrangement. The imaginary frequency has been analysed below in table 8.
|
# |
Vibrational Motion |
Wavenumber (cm-1) |
Intensity |
||
|
Initial Position |
Equilibrium Position |
Final Position |
|||
|
1 |
 |
 |
 |
-530cm-1 |
0.3 |
|
-This vibration is equivalent to that seen in the chair transition structure. Vibration corresponds to a wagging of the two allyl fragments symmetrically with respect to eachother which compresses and elongates the bond partially forming and breaking in the transition structure. This is interpretted as the simultaneous and concerted formation of one bond and breaking of another. |
|||||
∆Table 5 - Vibrational Analysis of Chair Transition State
Comparison of Optimised Transition States
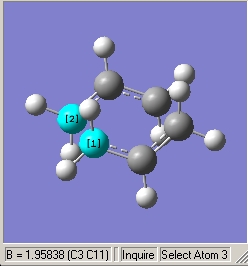
Each transition state secured by the methods specified and the Jmol representations of the transition states are shown below. The first two Jmols may not show up due to the lack of processing memory for the browser.
|
Optimised Boat and Chair Transition Structures |
|||||
|
QST2 Boat Transition State |
Berny Chair Transition State |
Frozen Coordinate Chair Transition State |
|||
 |
 |
|
|||
∆Table 8 - Optimisation Structures for Transition Structures.
In comparison of the bond forming/breaking lengths for the high symmetry Berny and QST2 transition states lengths of 1.96A and 2.21A respectively were resolved. The high level of theory was able to distort the allyl groups for the Berny Chair optimisation bringing the breaking and bonding sections closer together, increasing bonding interactions in the bond forming pole then increasing negative repulsive electron-electron repulsion. The effect of these two factors is visualisated in the imaginary frequency that has been analysed above. The boat transition structure has not changed much from the originally stipulated 2.20A length however this length does reflect the increased strain of the transition state via eclipsing of carbon's on alternate sides of the structure.
The frozen coordinate resolved chair transition structure has a structure that shows the concerted formation of one sigma bond whilst the other is breaking from a transition structure that higher resembles that of a real gauche conformation of 1,5-hexadiene. The bond that is partially formed is of a length of 4.39A.
Use of IRC
It is cited that the conformations that the transition structures connect are extremely difficult to predict. The Jmol representations of the optimised transition structures are shown above in table 8. In regard to the boat transition structure it would be postulated that the conformation that the transition state arises from is the Gauche2 conformer bearing C2 symmetry and lying 0.62kCal/mol above the lowest energy conformation. Secondly, in regard to the chair transition structure it is predicted that the transition structure develops from the Anti-2 conformer for as suggested by both methods.
To get around this problem the IRC function is used to find the local minimum point on the potential energy surface, which the transition structure has arose from. This is called the Intrinisic Reaction Coordinate or IRC method. The chair transition state will be considered and the optimised geometry chosen is the Berny optimised structure. As the reaction coordinate is 'symmetrical', we will only choose to compute it in the forward direction. The daughter structure of the Berny transition state is shown below in figure 2.
As can be seen below the IRC function did not arrive at a minimum point and was still left at a transition state structure. In the interest of time the final structure was minimised to attempt to achieve the daughter structure however this process can be unreliable. It will therefore be interesting to observe the result. The structure was minimised by HF/3-21G optimisation and then subjected to frequency analysis to characterise the point arrived at.
- 1st Attempt (failed)
Pentahelicene |
- Minimisation from structure
Pentahelicene |
- Summary Window

As can be seen for the minimised structure the method of optimisation was effective in finding the daughter structure minimised to give no imaginary frequencies signifying a minimum point. The structure formed can be identified as the Gauche2 conformer sharing the same energy and C2 point group symmetry as this conformation. The appendix suggests that this structure is 0.62kCal/mol above the lowest energy Gauche conformation. This is a good result as the predicted structure that chair transition structure was derived from was thought to be the same conformer.
There is another method, the QST3 method, that allows you to input the geometry of a guess transition structure also and this can often be more reliable. Unfortunately no time was left to carry out this method.
Further Optimisation
In order to prove that optimisations were completed the files have been uploaded as .txt files and aembedded here: HF Chair[2]; HF Boat[3]; HF Anti-2[4]; DFT Chair[5]; DFT Boat[6]; DFT Anti-2[7]
The HF pre-optimised transition state structure were then re-submitted for higher level B3LYP/6-31G DFT MO optimisation and frequency calculations. The geometries observed were radically different despite the energy of the structures being realtively close. This is due to the effect of increasing the quantum mechanical focus of the calculation, and this result emphasises the importance of ensuring that quantum mechanical arguments are incorporated and that a good level of theory is used. A comparison of some important angles and interatomic distances in the transition states prove that the undertaken order of manipulation is logical.
The objective is to compare the predicted activation enthalpies with experimentally derived literature values for the path to each transition state. These values are given in the output and have been compared below. The literature values for the reaction areas follows:
1Hartree = 627.51kCal/mol
- HF optimised chair transition state energy at 0K = -231.466699Hartree
- HF optimised reactant energy at 0K = -231.539542Hartree
- HF predicted activation enthalpy at 0K = 45.7kCal/mol
- DFT optimised chair transition state energy at 0K = -234.414921Hartree
- DFT optimised reactant energy at 0K = -234.469183Hartree
- DFT predicted activation enthalpy at 0K = 34.0kCal/mol
- 33.5 ± 0.5 kcal/mol via the chair transition structure at 0K[3]
- HF optimised boat transition state energy at 0K = -231.450929Hartree
- HF optimised reactant energy at 0K = -231.539542Hartree
- HF predicted activation enthalpy at 0K = 55.6kCal/mol
- DFT optimised boat transition state energy at 0K = -234.402342Hartree
- DFT optimised reactant energy at 0K = -234.469183Hartree
- DFT predicted activation enthalpy at 0K = 42.0kCal/mol
- 44.7 ± 2.0 kcal/mol via the chair transition structure at 0K[4]
The correct symmetries are observed for both the optimised structures as pictured below. Note although the chair summary shows that ultimately the point group of the molecule has no symmetry, it is true that under very loose criteria C2h symmetry was attainable showing that the eventual structure was only slightly distorted away from the C2h symmetry that is predicted.
Evaluation
All molecules have been optimised effectively and give result that agree with information supplied. The huge scope of physical computational chemistry has been observed and had time permitted a lot of further investigation would have taken place. Of course a lesson learnt from this experience is to plan a means of achieving the most useful result in the shortest period of time. The tremendous benefits of mapping transition states by computational methods has been seen and sensible structures have been attained which accord with the lower energy conformation of the parent molecule undergoing the Cope rearrangement.
Many different techniques have been tried and the utilies of each addressed and beared in mind for the continuation of the experiment to interpret more complex reactions.
Frequency analysis has proven a very useful tool throughout in visualising the imaginary vibrations that correspond to the formation of products. It is also invaluable in its assessment of character of the stationary point arrived at, and takes relatively short amount of time. Similar methods for finding the daughter molecules of a transition structure including the detail of individual conformation has been observed for the IRC technique which led to excellent approximation of the major conformers involved in the formation of the boat conformation as this was a less intuitive result than that of the chair conformation.
It is apparent that the vibrational wavenumbers achieve for each method are different even though they visualise the same vibrational mode. This is an intuitive result as the sterics interference of the synperiplanar formation of the boat transition state is higher than that for the gauche related carbons in the chair transition state. This analysis is in-line with the calculated and experimental activation energies being higher for the boat transition structure than for the chair transition structure.
The values obtained for the activation energies prove that computational techniques when used in the correct mannar can yield exciting and accurate results, which lie inside the experimental error limit in some cases.
The next section will aim to gain equally good results for a more involved chemical reaction, namely the Diels-Alder cycloaddition of various substiuents.
Diels-Alder Cycloaddition
Introduction
In this section the focus will change to cycloaddition reactions, bringing about an increase in reaction complexity. This reaction has scope to be effected by substiuents used and the ability of a computational method to account for such 'secondary orbital effects' will be investigated. One main aim of the investigation is to investigate the symmetry properties of the frontier molecular orbitals and the inherent implications on the resultant cycloaddition.
It is cited[5] that according to the nodal properties of the frontier orbitals 'if the HOMO of one reactant can interact with the LUMO of the other reactant then the reaction is allowed'. Of course this is only the case when a net orbital overlap occurs. It is also therefore cited from the same reference that 'if the orbitals have different symmetry properties then no overlap density is possible and the reaction is forbidden'. These statements will be investigated further with respect to the primitive cycloaddition mechanism for ethylene and butadiene.
If there are additional π orbitals on the substituents on the cycloaddition reagents there may be observed a secondary orbital interaction with the forming new double bond pulling the reaction to completion and controlling the regiochemistry of the reaction. Regiochemistry in cycloadditions is described as 'head to tail' mode of transition structure formation or a 'tail to head' mode. An aim will be confirm such regiochemistry in a more complex cycloaddition involving maleic anhydride and cyclohexa-1,3-diene.
The nomenclature of the cycloaddition is [4s+2s] describing the number of pi-orbital contributing to the reaction in each substiuent. The orbitals that will be concentrated on for ethylene and butadiene will be the π/π* orbitals of ethylene and the HOMO/LUMO of butadiene. An important plane of symmetry with respect to cycloadditions can be visualised as below and the symmetry of orbitals about this plane and its implications will be considered. Energetically, the HOMO of the resulting adduct with two new σ bonds is asymmetric[6].
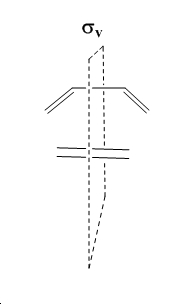
HOMO and LUMO pairs in each molecule share the same symmetry properties with respect to the visualised plain and it is by the statement above that classifies the cycloaddition of ethylene and butadiene as allowed. Another objective will be to consider the symmetry properties of these orbital in the more complex cycloaddition of maleic anhydride and cyclohexa-1,3-diene. Energetically, the HOMO of the resulting adduct with two new σ bonds is a.
AM1 Semi-Empirical Optimisations
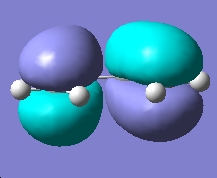
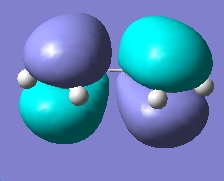
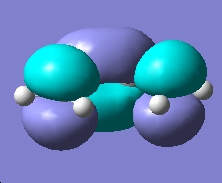
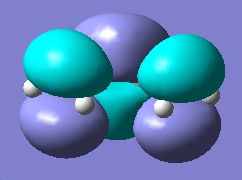
This calculation type was used to study the Diels-Alder [4s+2s] cycloaddition of butadiene and ethylene to cyclohexa-1-ene. The HOMO and LUMO orbitals have been shown below and their symmetry with respect to the plane of symmetry in the transition state (figure 2) was considered. The comparison was made between the estimated form of the orbitals via semi-empirical AM1 calculation and high level DFT B3LYP/6-31G(d) optimisation.
|
Molecular Orbital Cubes for cis-Butadiene (isovalue=0.02) |
|||
|
AM1 HOMO |
DFT HOMO |
AM1 LUMO |
DFT LUMO |
 |
 |
 |
 |
∆Table 9 - Molecular Orbital Cubes for cis-Butadiene.
From the above molecular orbital cubes (orientated to be looking down the identified plane) the symmetry of the cubes with respect to the plane is symmetric. The additional level of theory had very little effect on the qualitative cubes however an increase in resolution was observed for the higher level of theory with the surfaces showing less resemblance to the orbitals they are originally derived from. The LUMO orbital was more diffuse in the case of the higher level of theory compared to the semi-empirical cube. This process confirms that semi-empirical calculation is all that is required for this type of task in order to consider the absolute symmetry of the cubes.
These results are in direct contrast to those given, which proves that the molecular orbital symmetry can't just be considered for the individual reactants and that the forming transition state must be considered.
Guessing the Transition State Structure
The interfragment distance guess was taken to be 2.2Å as in the previous example. The structure guessed is shown below and the Berny transition state optimisation method used previously was again utilised in this section to specify the formation of a bond. Although the butadiene structure was optimised to higher levels of theory the intial input into the guess was the semi-empirically resolved AM1 molecule. Repeats on the higher levels of theory such as the Hartree-Fock level if time allows as this was the level of theory shown to give good results in the previous section.
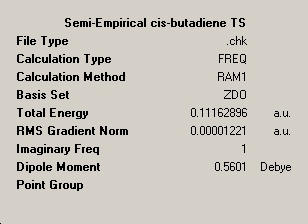
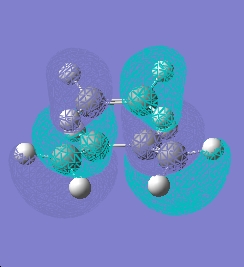
The transition structure optimised to the AM1 level was obtained giving the structure below with C-C bond lengths of 1.38Å (average) and the forming C--C bonds 2.1Å. The HOMO and LUMO orbitals have been positioned below. A frequency analysis was run alongside this calculation to characterise the located point and the array is indeed a transition state as it bears a single imaginary frequency.
|
Optimised Diels-Alder Butadiene and Ethylene Transition State |
||||||
|
Jmol of AM1 Optimisation |
Frequency Summary |
HOMO orbital |
LUMO Orbital |
|||
|
 |
 |
 |
|||
∆Table 10 - Optimisation for AM1 resolved Transition Structures.
As can be seen from the illustrations above the LUMO orbital is symmetric with respect the plane and the HOMO orbital is asymmetric with respect to the plane. This is in agreement with the information given and classifies the reaction as a 'allowed reaction' fulfilling the above criteria.
Some literature C-C bond lengths and Van der Waals radii are given below:
The fact that the forming carbon-carbon bond is 2.1Å in the snapshot transition state shows that this is the maximum energy conformation of the two reagents. Any further convergence of the two molecules from the transition state geometry illustrated will result in favourable symmetric orbital overlap and any movement of the molecule away from this length will result in the favourable avoidance of unstabilised electron-electron repulsions. In that respect 2.1Å is the dissociation limit of the molecule and if a molecule is dissociate is must gain enough energy to expand it's bonds to 2.1Å. The bond lengths seen in the butadiene and ethylene sections of the transition state are all in between standard sp3 and sp2 bond lengths showing the partial breaking and in the case of the butadiene bond central to the plane the formation of a double bond.
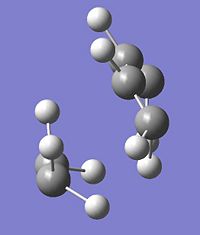
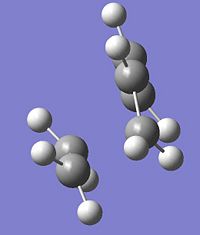
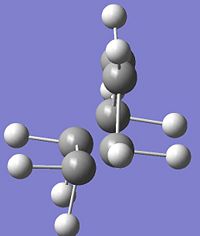
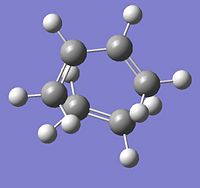
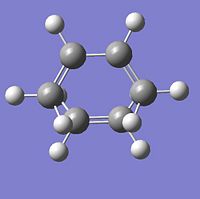
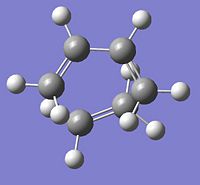
Below has been visualised the imaginary frequency for the transition state confirming it is the vibration that indicates the convergence of the reagents (i.e. forming the product) and the lowest postive frequency.
|
# |
Vibrational Motion |
Wavenumber (cm-1) |
Intensity |
||
|
Initial Position |
Equilibrium Position |
Final Position |
|||
|
1 |
 |
 |
 |
-956cm-1 |
5.6 |
|
- |
|||||
|
2 |
 |
 |
 |
147cm-1 |
0.3 |
|
- |
|||||
∆Table 11 - Vibrational Analysis of Simple Diels-Alder Transition State
As can be seen from the vibrational analyis above the single imaginary frequency shows synchronous convergence of the ethylene and butadiene molecules in order to form a bond. In contrast the lowest positive frequency is shown to illustrate asynchronous rotation of the two molecules with respect to eachother.
As previously mentioned HOMO orbital of the transition state is asymmetric with respect to the plane. It can be envisaged that the orbitals that hasve combined to form the molecular orbital in question is the butadiene HOMO orbital and the ethylene pi-star LUMO orbital. These two orbitals are both asymmetric with respect to the specified plane but in identical spacial areas and for that reason and from the angle that the ethylene approaches from there is significant stabilising secondary orbital effects that bring about the stabilisation and formation of the transition state. Hence the reaction is termed allowed according to the rules set out in the introduction stipulating an allowed reaction as having significant net orbital overlap in the occupied orbitals of the transition state.
For further work it would interesting to contrast the results obtained if the frozen coordinate method had been used as the same result was not obtained for these distinct methods earlier in the investigation. Unfortunately this was not possible in the time allowed.
Added Complexity
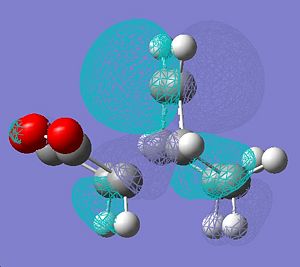
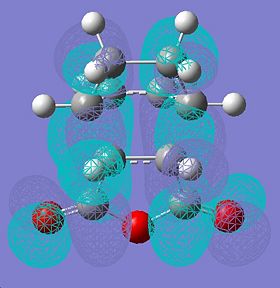
In the following example the dienophile is maleic anhydride and the diene is cyclohexa-1,3-diene. These reagents undergo a rapid reaction that is reportedly kinetically controlled giving regioselective product distribution favouring the endo formation. The reactants have been optimised separately each to the DFT B3LYP/6-31G(d) level before being combined in one molgroup and optimised to a Berny transition state, then subsequently subjected to a frequency analysis.
The two transition structures are shown below as Jmol structures from which relavant geometric parameters have been extracted.
|
Molecular Orbital Cubes for Endo-State (isovalue=0.02) |
||||||
|
Optimised Jmol |
HOMO |
LUMO v.1 |
LUMO v.2 |
|||
|
 |
 |
 |
|||
∆Table 11 - Molecular Orbital Cubes and Jmol for Endo-Isomer.
|
Molecular Orbital Cubes for Exo-Transition State(isovalue=0.02) |
||||||
|
Jmol of Optimisation |
HOMO |
LUMO v.1 |
LUMO v.2 |
|||
|
 |
 |
 |
|||
∆Table 12 - Molecular Orbital Cubes and Jmol for Exo-Isomer.
The relative energies of the two transition states are given below:
- HF Optimised Exo-transition structure at 0K = -605.410255Hartree
- HF Optimised Endo-transition structure at 0K = -605.521140Hartree
- HF Optimised Exo-transition structure at 298K = -605.400841Hartree
- HF Optimised Endo-transition structure at 298K = -605.512365Hartree
Note - The endo transition state did not optimise initially and needed to be resubmitted. Upon optimisation the same problem occured that the calculation optimised to a minimum despite having set up the redundant coordinate editor properly. A problem must have been faced in the inital frozen bond optimisation. The energies given above for the endo-transition state are those given by the minimum point. Lack of time stopped a further repeat of this section
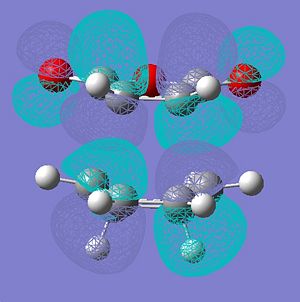
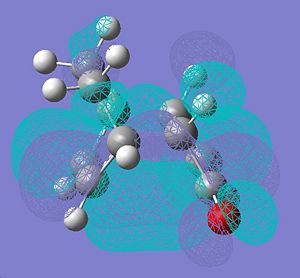
Looking at the forms of the molecular orbitals resolved in table 11 the nodal properties of the molecule's HOMO orbital localised to the maleic ring with respect to the rest of the molecule is considered. It is clear to see that the HOMO for the endo-molecular bears very little localisation on the maleic ring so it is asymmetric with respect to the rest of the molecule. In stark contrast the HOMO orbital of the exo-isomer has a more even spread of electron density across the entire molecule. Only the exo HOMO orbital is symmetric with respect to the rest of the molecule whereas the HOMO of the endo is asymmetric with respect to the rest of the molecule. The exo-HOMO orbital shows the same symmetry as the LUMO orbital and this leads to a secondary orbital effect which stabilises the tranition state. In treatment of this information it can be said that secondary orbital effects are clearly important in the choice of product formed as the lack of frontier secondary orbital effect in the endo-isomer and their presence in the exo isomer classifies the endo-transition as forbidden and the exo-transition as allowed. This is despite the fact that a greater activation enthalpy must be overcome to form the products. This is apparent as a node can be visualised between the two opposite phases that surround the forming bond which is an energetic hinderance to its formation.
The structural differences in the molecules accounts for the lesser strain of the endo-isomer making it the thermodynamic product by ....kCal/mol. The optimised bridging C - carbonyl carbon dihedral angle accounts for the extra strain in the exo-transition state. In the Exo-transition state this angle is 48o and in the Endo-transition state the angle is 176o. The hydrogen of the ethyl bridge will therefore come into close proximity of the maleic ring and cause strain. The forming C--C bond length is 1.55A in the endo isomer and this shows that the bond formation is well advanced in the transition state. This length is extremely close to the literature C-C sp3 bond. Accommodating for this would mean that the maleic anhydride would have to approach very close and emaculately aligned and overcome build up of significant electronic charge in order to reach the dissociation limit. In contrast to this the exo partially formed bond is much longer and is much easier to attain, not requiring such a precise angle of approach and easily reaching the dissociation limit energetically due to the aformentioned transition state stabilising secondary orbital effects that do not exist in the opposing isomer.
Calculation of the activation energies for the two isomers will be carried out for the HF optimised level, (and the DFT if time permits).
One effect that hasn't been considered in discussion so far and isn't modelled terrifically well by the Hartree-Fock method is hydrogen bonding. The shortest O-H length in each transition state is shown below:
- Endo shortest O-H distance = 3.68A
- Exo shortest O-H distance = 2.71A
From this data it can be seen that the exo transition state will be much more stabilised by any hydrogen bonding effects than the endo isomer, which is a factor that would stabilise both the exo-product and exo-transition state making it more favourable.
Evaluation
It was extremely disappointing that the endo transition state calculation developed a fault during processing and optimised to a minimum structure. For this reason, energy barriers could not be calculated as the 'ground state' transition structure obviously showed very different results to that of the optimal transition structure.
Results for the exo-transition structure were good, however no reference point was ever set up to definitively judge the agreement of the results with the literature.
Once again vibrational analysis proved invaluable in identifying transition structures and crucially in this case the fact that the endo-transition state has mistakenly optimised to a minimum energy structure.
The impact of pi-derived secondary orbital effects was noted and accounted for the reported kinetic and thermodynamic behaviour, classifying one of the possible isomeric routes as 'forbidden'.
Mini-Project
The effect of temperature on the frequency analysis output was undertaken for the resolved exo-transition state by utilising the FreqCheck module on Gaussian.
References
- ↑ https://www.ch.ic.ac.uk/wiki/index.php/Mod:phys3
- ↑ https://www.ch.ic.ac.uk/wiki/index.php/Mod:phys3
- ↑ www.ch.ic.ac.uk/wiki/index.php/Mod:phys3
- ↑ www.ch.ic.ac.uk/wiki/index.php/Mod:phys3
- ↑ www.ch.ic.ac.uk/wiki/index.php/Mod:phys3
- ↑ www.ch.ic.ac.uk/wiki/index.php/Mod:phys3
- ↑ M. A. Fox, J. K. Whitesell, Organische Chemie, 1994, Spektrum
- ↑ M. A. Fox, J. K. Whitesell, Organische Chemie, 1994, Spektrum
- ↑ M. A. Fox, J. K. Whitesell, Organische Chemie, 1994, Spektrum
- ↑ A. Bondi, J. Phys. Chem., 68, 1964, 441.


