Rep:Mod:gjsmodule3 jackanackanory
Module 3 Jackanackanory!
The Cope Rearrangement Tutorial
Optimising the Reactants and Products
Introduction
The Cope Rearrangement reaction is a pericyclic reaction, i.e. a concerted rearrangement of bonds proceeding via a fully conjugated cyclic transition state, [1] and it is this rearrangement reaction which will be studied in this section.
The aim of the following calculations is to find the most stable reactant/product conformer, and the lowest energy transition state in order to find the preferred reaction mechanism. Below is a table representing the energies of the different conformers of 1,5-hexadiene.
| Description of conformer | Jmol | Picture of conformer | Point Group | Energy/Hartrees
HF/3-21G |
Relative energy / kcal/mol | Link to summary of HF/32-1G optimisation calculation |
|---|---|---|---|---|---|---|
| Anti 1 |  |
C2 | -231.69260 | +0.04 | Link | |
| Anti 2 |  |
Ci | -231.69254 | +0.08 | Link | |
| Anti 3 |  |
C2h | -231.68907 | +2.25 | Link | |
| Anti 4 |  |
C1 | -231.68907 | +1.06 | Link | |
| Anti 5 |  |
C2h | -231.68540 | +4.56 | Link | |
| Gauche 1 | C2 | -231.68772 | +3.10 | Link | ||
| Gauche 2 | C2 | -231.69167 | +0.62 | Link | ||
| Gauche 3 | C1 | -231.69266 | 0.00 | Link | ||
| Gauche 4 | C2 | -231.69153 | +0.71 | Link | ||
| Gauche 5 |  |
C1 | -231.68962 | +1.91 | Link | |
| Gauche 6 |  |
C1 | -231.68916 | +2.20 | Link |
In order to obtain the "Anti 5" conformer, no "cleaning" was conducted before doing the HF/3-21G optimisation.
DFT B3LYP/6-31G (d) Optimisations of the Anti 1, Anti 2 and Gauche 3 Conformers
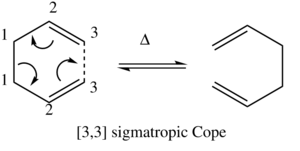
As it can be seen from figure 1, the lowest energy conformer calculated using the HF/3-21G method was the Gauche 3 conformer, with the Anti 1 and Anti 2 conformers also having similarly low energies. As the objective in this section is to locate the low-energy minima and transition structures on the C6H10 potential energy surface in order to determine the preferred reaction mechanism of the Cope rearrangement[2] (figure 2, right), only the conformers with the lowest potential energy were selected for further optimsiation and analysis. The results from the DFT B3LYP/6-31G (d) optimisations of the lowest energy conformers can be seen in figure 3 below.
| Confromer | Jmol | Energy/Hartrees | Relative Energy / kcal/mol | Link to Summary | Link to D-Space |
|---|---|---|---|---|---|
| Anti 1 | -234.61179 | 0.00 | Link to summary | Link to D-space | |
| Anti 2 | -234.61170 | +0.06 | Link to summary | Link to D-space | |
| Gauche 3 | -234.61133 | +0.29 | Link to summary | Link to D-space |
After conducing the DFT B3LYP/6-31G (d) optimisations on Anti 1, Anti 2 and Gauche 3, interestingly it can be seen that it is the Anti 1 conformer which is the most stable, and not Gauche 3. The point groups of each conformer are unchanged from the initial optimisations, suggesting that the geometries are unchanged (this can be seen visually by comparing the Jmols in figures 1 and 2). The geometries are unchanged and yet the order of stabilities have changed due to the increased accuracy of the optimisations, mostly tweaking the electronic structures of the conformers.
Upon further analysis of the two optimised structures of the anti 2 conformer, it was discovered that all the anti-periplanar dihedral angles were exactly 180o for both of the optimised structures. However, when looking at the dihedral angle of the 4 carbon atoms at the end of the chains, the HF/3-21G optimised structure yielded a dihedral angle of 114.7o where as the DFT B3LYP/6-31G* optimised structure gave a dihedral angle of 118.5o. Therefore, the two different calculations produced conformers with very similar geometries. The HF/3-21G method somewhat neglects the electron correlation, certainly more so than the DFT B3LYP/6-31G* method and basis set, explaining the small difference in geometries.[3]
However, these energies calculated thus far represent the bare potential energy surface and in order to compare them with experimentally determined values, some additional terms are required. Therefore, some frequency calculations were carried out using the same method and basis set on the three conformers.
DFT B3LYP/6-31G (d) Frequency Calculations
| 298.15 K & 1.0 Atm. | 0 K & 1.0 Atm. | ||||||||||
|---|---|---|---|---|---|---|---|---|---|---|---|
| Conformer | Link to D-space | Sum of electronic & zero-point energy/
Hartrees |
Sum of electronic & thermal energies/
Hartrees |
Sum of electronic & thermal enthalpies/
Harteres |
Sum of electronic & thermal free energies/
Hartrees |
Link to IR Spectrum | Link to D-space | Sum of electronic & zero-point energy/
Hartrees |
Sum of electronic & thermal energies/
Hartrees |
Sum of electronic & thermal enthalpies/
Harteres |
Sum of electronic & thermal free energies/
Hartrees |
| Anti 1 | Link to D-space | -234.46930 | -234.46197 | -234.46102 | -234.50086 | Link to IR Spectrum | Link to D-space | -234.46930 | -234.46930 | -234.46930 | -234.46930 |
| Anti 2 | Link to D-space | -234.46921 | -234.46187 | -234.46091 | -234.50082 | Link to IR Spectrum | Link to D-space | -234.46921 | -234.46921 | -234.46921 | -234.46921 |
| Gauche 3 | Link to D-space | -234.46869 | -234.46146 | -234.46052 | -234.50011 | Link to IR Spectrum | Link to D-space | -234.46869 | -234.46869 | -234.46869 | -234.46869 |
From figure 3 above, it can be seen that at absolute zero there is no contribution from thermal energy, enthalpy or free energy and that therefore all these values are equal to the zero-point energy. This is indeed logical, as the classical definition of absolute zero is the point at which there is no thermal energy.
| Anti 1 | Gauche 3 |
|---|---|
 |
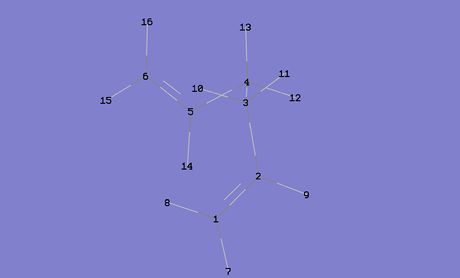 |
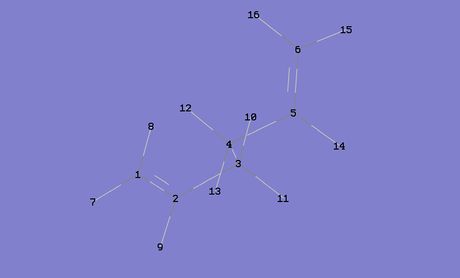
From the HF/3-21G optimisation calculations the Gauche 3 conformer was calculated to be the most stable conformer, but upon the more accurate and computationally demanding B3LYP/6/31G (d) optimisation calculations, it was realised that it was in fact the Anti 1 conformer that was the most stable. Therefore, some qualitative analysis was done on these two conformers in order to try and better understand the chemistry behind this. In figure 4 above, the atoms of the two conformers have been numbered; these are important reference points for the rest of this part of the discussion.
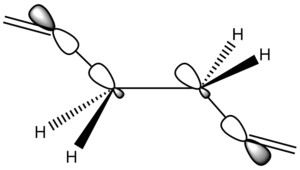
One potential reason for the Anti 1 conformer being more stable is more effective orbital overlap. The Anti 1 conformer should have two sets of σC-C/σ*C-C interacting orbitals and four sets of σC-H/σ*C-H interacting orbitals, where as the Gauche conformer should have two sets of σC-H/σ*C-H, two sets of σC-C/σ*C-H and two sets of σC-H/σ*C-C (a diagram depicting the σC-C/σ*C-C orbital interactions can be seen in figure 5 on the right). If the stabilising effects of these interactions were to be equated to butane, it would be the anti conformer that was stabilised the most [4] It is also important to note that these interactions occur most strongly when the dihedral angle of the respective atoms is 180o, but from looking at the dihedral angles of the atoms along the C(3)-C(4) bond in the two conformers, it can be seen that the bonds in the Anti 1 conformer are better aligned for orbital overlap (the dihedral angles of the two conformers can be seen in figure 6), the average dihedral angle along the C(3)-C(4) bond in the Anti conformer being 177.6o compared to 174.2o in the Gauche conformer.
| Atoms [Conformer] | Dihedral Angle |
|---|---|
| C(2)-C(3)-C(4)-C(5) [Anti 1] | -176.7o |
| H(10)-C(3)-C(4)-H(13) [Anti 1] | -178.1o |
| H(11)-C(3)-C(4)-H(12) [Anti 1] | -178.1o |
| C(2)-C(3)-C(4)-H(13) [Gauche 3] | 171.1o |
| H(10)-C(3)-C(4)-H(12) [Gauche 3] | -178.7o |
| C(5)-C(4)-C(3)-H(11) [Gauche 3] | -172.8o |
It is also worth inspecting the Van der Waals dispersion energy of the two conformers to see if this sheds any light on their relative stabilities. The distance at which there is the maximum attraction between two nuclei is the sum of their respective Van der Waals radii, therefore for hydrogen atoms, this attractive distance is approximately in the range 2.4-2.6 Å. Below in figure 7 is a table showing the attractive H...H contacts around the C(3)-C(4) bond.
| Hydrogen Atoms [Conformer] | Distance / Å |
|---|---|
| H(8)...H(10) [Anti 1] | 2.46 |
| H(9)...H(11) [Anti 1] | 2.56 |
| H(10)...H(12) [Anti 1] | 2.51 |
| H(11)...H(13) [Anti 1] | 2.52 |
| H(8)...H(10) [Gauche 3] | 2.47 |
| H(9)...H(11) [Gauche 3] | 2.55 |
| H(10)...H(13) [Gauche 3] | 2.54 |
| H(11)...H(12) [Gauche 3] | 2.50 |
| H(11)...H(13) [Gauche 3] | 2.41 |
This data seems to suggest that the Van der Waals dispersion energy slightly favours the Gauche 3 conformer as there are 5 attractive interactions around the gauche linkage compared with 4 attractive interactions around the anti-periplanar linkage. However, this effect is generally very small (in butane the Van der Waals dispersion energy favours the gauche conformer but only by ~0.27 kcal/mol),[5] and as this analysis is merely qualitative, no definitive conclusion can be gathered from this data.
Optimising the Chair and Boat Conformations
Chair Transition State
| C2h Chair Transition State | Cope Rearrangement |
|---|---|
 |
 |
For this section, a CH2CHCH2 allyl fragment was drawn and then optimsied using the HF/3-21G method and basis set. The fragment was then copied and pasted twice into a new window, with the two fragments being placed in an approximate chair geometry with the terminal carbon atoms being ~2.2 Å apart. A Gaussian optimisation calculation for a transition state was then set up at the HF-3-21G level of theory. The calculation was set up as an Opt+freq calculation with the optimisation to a minimum tab changed to optimisation to a TS (Berny). The force constants were calculated once and Opt=NoEigen was added in the "Additional Keywords" box in order to stop the calculation crashing if more than one imaginary frequency is detected.
From this calculation an imaginary frequency at -818 cm-1 was indeed obtained as stated in the script. [6] This imaginary vibration corresponds to the Cope rearrangement which can be seen in figure 1 by clicking on the image (the Jmol of the chair transition structure from this calculation can be seen in figure 2).
| Figure 2 | Figure 3 | ||||||
|---|---|---|---|---|---|---|---|
|
|
After this, the original estimation of the chair transition structure was once again pasted into a new window, and the terminal carbon atoms were set an internuclear distance of exactly 2.2 Å using the Redundant Coord Editor. An optimisation calculation was then set up as if the structure were a minimum, using HF/3-21G method and basis set and with Opt=ModRedundant in the additional keywords.
Once the calculation was complete, the chk file was opened, and then the process was repeated except this time a transition state optimisation calculation was set up, and instead of calculating the force constants, a normal guess Hessian was used , modified to include the information about the bond coordinated that are being differentiated along (the Jmol from this calculation can be seen in figure 3).
A comparison of the carbon bond forming/bond breaking internuclear distances can be seen in figure 4 below.
| Chair Transition Structure | C-C bond forming/bond breaking internuclear distance 1 / Å | C-C bond forming/bond breaking internuclear distance 2 / Å |
|---|---|---|
| From Initial Freq+Opt Calculation | 2.0204 | 2.0204 |
| From Frozen Coordinate Method | 2.0199 | 2.0199 |
Interestingly, it can be seen that the C-C bond forming/breaking distance in the chair transition structure is calculated by the frozen coordinate method to be 0.0005 Å shorter.
A summary of the total energies of the optimised chair transition states can be seen below in figure 5 (but this information is tabulated later along with the data from the boat calculations in the activation energy section).
| Method and Basis Set | Total Energy/Hartrees |
|---|---|
| HF/3-21G | -231.55407 |
| DFT B3LYP/6-31G* | -234.55407 |
Boat Transition State
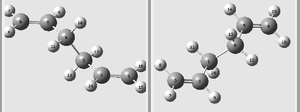
In order to analyse the boat transition state, a DFT B3LYP/6-31G (d) Freq + Opt QST2 calculation was set up. However, first the reactant and products were numbered to represent the Cope rearrangement as shown in figure 1.
When the calculation is set to run, it interpolates between the reactant and product to find a transition state. However, in this instance the calculation failed and rendered a structure representative of the chair transition structure as shown here: . This is because the calculation simply translated the allyl fragments and did not consider the rotation of the central C-C bonds.
Therefore, another QST2 calculation was set up, however, this time the geometries of the reactants and products were changed so that their geometries were closer to the boat transition structure. For both molecules, the dihedral angle for the central four carbons was changed to 0o, and then the C(2)-C(3)-C(4) and the C(3)-C(4)-C(5) bond angles in the reactant molecule were changed to 100o, with the same being done to the corresponding bond angles in the product molecule. The calculation was then run again at first using the HF/3-21G method and basis set, and then using the DFT B3LYP method and 6-31G* basis set; the Jmols and results can be seen in figure 2 below:
| HF/3-21G QST2 | B3LYP/6-31G (d) QST2 | |||||||||||
|---|---|---|---|---|---|---|---|---|---|---|---|---|
| Transition State | Electronic energy/
Hartrees |
Sum of electronic and zero-point energies (0K)/
Hartrees |
Sum of electronic and thermal energies (298.15K)/
Hartrees |
Sum of electronic and thermal enthalpies (298.15K)/
Hartrees |
Sum of electronic and thermal free energies (298.15K)/
Hartrees |
Jmol | Electronic energy/
Hartrees |
Sum of electronic and zero-point energies (0K)/
Harteres |
Sum of electronic and thermal energies (298.15K)/
Hartrees |
Sum of electronic and thermal enthalpies (298.15K)/
Hartrees |
Sum of electronic and thermal free energies (298.15K)/
Hartrees |
Jmol |
| Boat | -231.60280 | -231.45091 | -231.44528 | -231.44433 | -231.47911 | -234.54309 | -234.40234 | -234.39600 | -234.39506 | -234.43109 | ||

As well as the calculated energies changing from the HF/3-21G calculation to the DFT B3LYP/6-31G* calculation, the stretching frequency of the imaginary vibration also changed from 841 cm-1 from the HF method to 531 cm-1 from the DFT method. The imaginary stretching frequency of the boat transition structure from the DFT calculation can be seen in figure 3.
It is also worth noting that upon comparison of the total energies of the two transition structures at both levels of theory, the chair transition structure is more stable, as expected.[7]
Intrinsic Reaction Coordinate Method
Chair Transition Structure
From looking at the optimised chair and boat structures, it is very difficult to predict which 1,5-hexadiene conformers the transition structures connect. Therefore, in this section the Intrinsic Reaction Coordinate method is used. This method follows the minimum energy path from a transition structure to the nearest energy well, i.e. one of the connecting 1,5-hexadiene conformers. The method works by changing the geometry of the structure at a series of points along a steep section of the potential energy curve.
Therefore, the IRC method was used on the HF/3-21G optimised chair structure, computing at 50 points and only in the forward direction as the reaction coordinate is symmetrical. The link to the summary for this for this calculation can be seen here: link to summary, and the results can be seen below in figure 1:
However, from looking at the RMS Gradient Norm graph, it can be seen that the product has not fully converged and so another calculation was run, this time computing the force constants at every step, not just once. The link to the summary for this for this calculation can be seen here: Link to calculation summary, and the results can be seen below in figure 2:
It can now be seen that the product has in fact converged, and it resembles the Gauche 2 conformer. On top of this, the energy (-231.69166 a.u.) is very similar to the energy of the Gauche 2 conformer (-231.69167 a.u.) optimised using the HF/3-21G method and basis set earlier, giving further evidence that the chair transition state does in fact give the Gauche 2 conformer.
The Boat Transition Structure
This process was then repeated for the boat transition state, the results are shown below in figure 3.
After the IRC calculation had finished, the resulting conformer was cleaned and re-optimised using the HF/3-21G method and basis set. The resulting conformer was Gauche 3.
Activation Energies
In order to calculate the activation energy for the Cope rearrangement, several factors had to be considered. For one the lowest energy conformer at each level of theory is chosen, therefore the energy of the Gauche 3 conformer is used for the reactant energy when using the HF/3-21G level of theory, and the Anti 1 conformer is used as the reactant when using the DFT B3LYP/6-31G* level of theory. However, this could lead to some discrepancies between the experimental values and the calculated values for the activation energy, as there would undoubtedly be a mixture of conformers in the laboratory, but this has not been considered here. The results from the calculations have been sumarised below in figure 1:
| HF/3-21G | B3LYP/6-31G (d) | ||||||||
|---|---|---|---|---|---|---|---|---|---|
| Transition State | Electronic energy/
Hartrees |
Reactant Conformer (Electronic Energy)/
Hartrees |
Activation Energy/
Hartrees |
Activation Energy/
kcal/mol |
Electronic energy/
Hartrees |
Reactant Conformer (Electronic Energy)/
Hartrees |
Activation Energy/
Hartrees |
Activation Energy/
kcal/mol |
Experimental Value/
kcal/mol |
| Chair | -231.61932 | Gauche 3 (-231.69266) | 0.07334 | 46.0 | -234.55407 | Anti 1 (-234.61179) | 0.05772 | 36.2 | 33.5±0.5 |
| Boat | -231.60280 | Gauche 3 (-231.69266) | 0.08986 | 56.4 | -234.54309 | Anti 1 (-234.61179) | 0.06870 | 43.1 | 44.7±2.0 |
It can be seen from the results that the calculated activation energies for the reaction are not very comparable to the experimental values when calculated using the Hartree Fock level of theory. However, when using the DFT B3LYP/6-31G* method and basis set, the calculated activation energy for the rearrangement reaction via the boat transition state agrees with the experimental value, and there is only a small discrepancy from the calculated EA value for the chair transition state. Links to the log files from the calculation are listed below:
Link to log file for the HF optimised chair transition structure.
Link to log file for the DFT optimised chair transition structure.
Link to log file for the HF optimised boat transition structure.
Link to log file for the DFT optimised boat transition structure.
The Diels Alder Cycloaddition
Cycloaddition of Ethene and Cyclohexene
MO Analysis

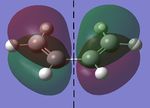
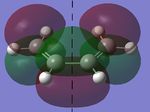
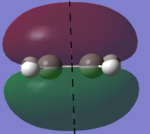
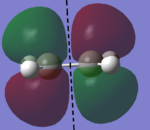
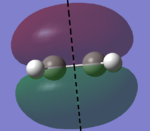
In this section, the [4s + 2s] Diels Alder cycloaddition reaction between ethene and cyclohexene is investigated (the reaction is shown in figure 1, right). As this reaction is only allowed if there is sufficient electron density overlap between the appropriate molecular orbitals, i.e., if the interacting orbitals are either both symmetric or antisymmetric in respect to a plane of symmetry, the HOMOs and LUMOs of cic butadiene and ethylene have been investigated, with the results being shown in figures 2 and 3 below (a=antisymmetric and s=symmetric):
| AM1 HOMO (a) | AM1 LUMO (s) | DFT B3LYP-6-31G* HOMO (a) | DFT B3LYP-6-31G* LUMO (s) |
|---|---|---|---|
 |
 |
 |
 |
| AM1 HOMO (s) | AM1 LUMO (a) | DFT B3LYP-6-31G* HOMO (s) | DFT B3LYP-6-31G* LUMO (a) |
|---|---|---|---|
 |
 |
 |
 |
As it can be seen below, the HOMO of ethylene and the LUMO of cis butadiene are both symmetric, and the HOMO of cis butadiene and the LUMO of ethylene are both asymmetric, meaning these pairs of orbitals can interact, allowing the reaction to take palce. Therefore, the transition state for the reaction was investigated.
It is also worth noting that these calculations were done at a higher level of theory also, but the same molecular orbitals were yielded meaning that AM1 is probably a sufficient level of theory.
The Transition State
Semi-Empirical AM1 Frequency Optimisation
| Figure 1: Imaginary Vibration | Figure 2: Transition State | |||
|---|---|---|---|---|
 |
|
In order to investigate the transition state from the Diels Alder reaction between cis-butadiene and ethylene, the two molecules were copied and pasted into the same window and the terminal carbons were orientated so that they were approximately 2 Å apart. A frequency optimisation calculation was then set up, calculating towards a Berny transition state, only calculating the force constants once. This calculation yielded the first approximation for the transition state, with an imaginary frequency at -956 cm-1 (shown in figure 1). The C-C bond forming distances were calculated to be 2.1195 and 2.1194 Å from this calculation, and so this information was used to set up a more accurate transition state calculation using the frozen coordinates method, shown in the next section.
Frozen Coordinate Method
Next, the transition structure was optimised again, this time using the frozen coordinate method, freezing the C-C bond forming/breaking distance to 2.119 Å (this distance was chosen based on the results obtained from the initial calculation of the transition structure as described previously). This optimised the structure of the transition state, apart from the C(1)-C(6) and C(4)-C(5) bonds (as shown in figure 1). Therefore, the structure was optimised again, but this time using a normal guess Hessian modified to include the information about the bonds, along which the calculation will differentiate. The link to the log file for this calculation can be seen here: link to the log file for the Opt+Freq calculation , and the results can be seen below.
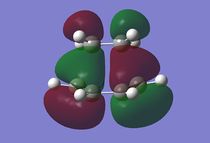
| Figure 1: Numbered Transition State | Figure 2: Imaginary Vibration (-957 cm-1) | Figure 3: HOMO of the Transition State (a) | Figure 4: LUMO of the Transition State (s) |
|---|---|---|---|
 |
 |
 |
 |
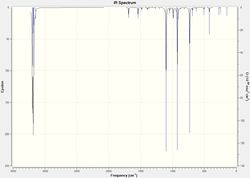
Figure 2 shows the only imaginary vibration obtained, the lowest positive vibration being 147 cm-1 as shown in figure 5. This suggests that the reaction is concerted, therefore meaning the formation of the two bonds is indeed synchronous.
From figures 3 and 4 it can be seen that the HOMO is anti-symmetric and the LUMO is symmetric and that by comparing them to the HOMO and LUMO orbitals from the cis-butadiene and ethene molecules, it can be seen that the HOMO for the transition state is a mixture of the HOMO from cis-butadiene and the LUMO from ethene, and the LUMO from the transition state is a mixture of the LUMO from butadiene and the HOMO from ethene. This also makes sense as the symmetry of the orbitals will have been preserved, meaning the reaction is allowed.
| C-C bond | Internuclear distance / Å |
|---|---|
| C(1)-C(2) | 1.38196 |
| C(2)-C(3) | 1.39648 |
| C(3)-C(4) | 1.38196 |
| C(4)-C(5) | 2.11900 |
| C(5)-C(6) | 1.38408 |
| C(6)-C(1) | 2.11900 |
The average C-C bond length for sp2 hybridised carbon atoms is ~1.36 Å, and for sp3 hybridised carbons it is ~1.54 Å. From figure 6 the bond lengths shown in the calculated transition state suggest that all the C-C bonds in the butadiene molecule are a similar length, slightly greater than the average C-C bond length for the sp2 hybridised carbon atoms. This suggests that there is a mixture of single and double bond character, with the C(2)-C(3) bond having slightly more single bond character at that stage of the reaction. The forming bonds between C(4)-C(5) and C(1)-C(6) are still fairly long and are actually in a repulsive Van der Waals radius distance (the attractive Van der Waals interaction distance for two carbon atoms in an organic molecule is ~3.2 Å). Hence, the structure being in a transition state.
Maleic Anhydride

| Figure 2: Endo Transition State | Figure 3: Exo Transition State | ||||||
|---|---|---|---|---|---|---|---|
|
|
In order to calculate the endo and exo transition states of the Diels-Alder reaction between cyclohexa-1,3-diene and maleic anhydride (figure 1 above), the frozen coordinates method was used once again at the AM1 level of theory. The bond forming/breaking distance was set to 1.9 Å, and in order to reach the two different transition states the two molecules were simply orientated in approximately the right position to represent the transition state. The log files from the calculations can be seen here: log file for the endo transition state, log file from the exo transition state.
The Jmols from the calculation can be seen in figures 2 and 3, and the results from the optimisation of the transition states can be seen below.
| Transition Structure | C-C bond forming/bond breaking internuclear distance 1 / Å | C-C bond forming/bond breaking internuclear distance 2 / Å | Total Energy / Hartrees | Total Energy / kcal/mol |
|---|---|---|---|---|
| Endo | 2.16 | 2.16 | -0.05150 | -32.3 |
| Exo | 2.83 | 2.83 | -0.05042 | -31.6 |
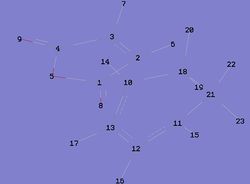
| Figure 5: Numbered Endo Transition State | Figure 6: Numbered Exo Transition State |
|---|---|
 |
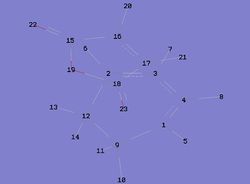 |
From figure 4, the bond forming distances for the two transition states can be seen to be markedly different (these bonds are highlighted as being red in figure 1) as they have been calculated to be ~0.67 Å longer in the exo transition state. It can also be seen that the total energy of the exo transition state is ~0.6kcal mol-1 higher in energy than the endo transition state. This result was expected however as the reaction is known to be under kinetic control with the endo product being preferred as stated in the literature.[8] Some possible explanations for this can be seen below, as the Van der Waals dispersion energy is investigated, as well as some of the molecular orbitals of the two transition states.
| Carbon atoms (Transition Structure) | C-C bond distance / Å |
|---|---|
| C(1)-C(12) (Endo) | 2.89 |
| C(13)-C(14) (Endo) | 2.89 |
| C(9)-C(18) (Exo) | 2.95 |
| C(12)-C(15) (Exo) | 2.95 |
As the attractive distance for C...C inter-nuclear (through space) distance in organic molecules is ~3.2 Å, these results actually suggest that the exo transition state is energetically favoured by the Van der Waals dispersion energy. The endo carbon atoms in the endo product are ~2.89 Å apart, meaning they may be entering a repulsive distance, and if not, the attractive forces between them will have diminished to a greater extent than in the exo transition state. Therefore, as these results did not appear to shed light on the relative stability of the endo transition state, the MOs of the two structures were analysed in order to investigate any secondary orbital overlap.
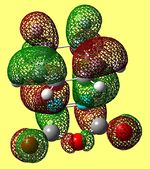
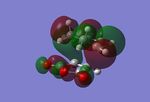
| HOMO -18 (Endo) | HOMO (Endo) | LUMO +2 (Endo) | HOMO -18 (Exo) | HOMO (Exo) | LUMO +2 (Exo) |
|---|---|---|---|---|---|
 |
 |
 |
 |
 |
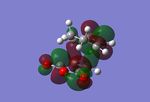 |
From looking qualitatively at the MOs of the two transition states, two molecular orbitals were found in the endo product that could possibly contribute to secondary orbital overlap and therefore stabilise the endo transition state. These same orbitals were then compared to the equivalent molecular orbitals in the exo product, where it can be seen that no stabilising MOs seem to be present in fact some nodes can be seen between the two joining molecules, perhaps contributing to the extra strain felt in the exo transition state, i.e. potentially explaining the energetic stability of the endo transition structure. However, these orbitals were found at the HOMO-18 and LUMO +2 eenrgy levels, the former being very low in energy and the latter relatively high. As the majority of the chemistry is dominated by the HOMO and LUMO orbitals, it is difficult to anticipate the contributions of these orbitals to the overall stability of the transition state. Therefore, the HOMOs of the two transition states were investigated (as shown in figure 8) however, there did not appear to be any secondary orbital overlap interactions, in fact, there were some nodes present in between the cyclohexa-1,3-diene and maleic anhydride molecules, perhaps meaning that a higher level of theory is needed in order to investigate fully the relative energies of the two transition structures.
References
- ↑ PAC, 1994, 66, 1077, DOI:10.1351/pac199466051077
- ↑ https://wiki.ch.ic.ac.uk/wiki/index.php?title=Mod:phys3
- ↑ Foresman and Frisch, Exploring Chemistry with Electronic Structure Methids, 2nd Ed., 1996, p. 98-99
- ↑ Henry Rzepa, Second Year Conformational Analysis Lecture Course, http://vle.imperial.ac.uk/webct/cobaltMainFrame.dowebct.
- ↑ Henry Rzepa, Second Year Conformational Analysis Lecture Course, http://vle.imperial.ac.uk/webct/cobaltMainFrame.dowebct.
- ↑ https://wiki.ch.ic.ac.uk/wiki/index.php?title=Mod:phys3
- ↑ M. J. Goldstein, M. S. Benzon, J. Am. Chem. Soc., 1972, 94 (20), pp 7147–7149, DOI: 10.1021/ja00775a046
- ↑ Roald Hoffmann, R. B. Woodward, J. Am. Chem. Soc., 1965, 87 (19), pp 4388–4389, DOI: 10.1021/ja00947a033


