Rep:Mod:gjsmodule2
Module 2
Optimising a Molecule of BH3
BH3 optimisation 3
File Name:          bh3_opt_3
File Type:          .log
Calculation Type:   FOPT
Calculation Method: RB3LYP
Basis Set:          3-21G
Charge:             0
Spin:               Singlet
E(RB3LYP):          -26.46226338   a.u.
RMS Gradient Norm:  0.00020672     a.u.
Imaginary Freq:
Dipole Moment:      0.0000     Debye
Point Group:        D3H
Job cpu time:       0 days  0 hours  0 minutes 6.0 seconds.
A BH3 molecule was created using GaussView 5.0.9, all the B-H bond lengths were set to 1.5 Å and then it was optimised using a B3LYP method and a 3-21G basis set, as can be seen in the summary (left). The optimised triganol planar BH3 molecule can be seen here: , and a link for the summary of the optimisation here:Optimisation summary for BH3. From this optimised molecule of BH3 the B-H bond lengths were calculated to be 1.19Å, and the H-B-H bond angles were calculated to be 120.0o. These values appear to be accurate as they are supported by the literature which states that experimentally, the B-H bond length has been found to be 1.19001 Å in the 1992 study of Kawaguchi.[1] It is also expected that the H-B-H bond angles would be precisely 120.0o as the molecule has D3H symmetry as shown in the summary. This symmetry is also backed up by the 0.000 Debye dipole moment which has been computed, suggesting absolute symmetry in the geometry of the molecule.
From the summary it can also be seen that the total energy of the molecule is reported to be -26.46226338 atomic units. However, this is only accurate to within ~10kJ/mol, which is ~0.0038 atomic units. Therefore, the total energy of the molecule should be reported as being -26.4623 ± 0.0038 a.u.
Item               Value     Threshold  Converged?
 Maximum Force            0.000413     0.000450     YES
 RMS     Force            0.000271     0.000300     YES
 Maximum Displacement     0.001610     0.001800     YES
 RMS     Displacement     0.001054     0.001200     YES
 Predicted change in Energy=-1.071764D-06
 Optimization completed.
    -- Stationary point found.
From looking at the text based .log file it was possible to ensure that the job had converged, i.e. an energy minimum had been found. This information can be seen in the following two text boxes.
                           !   Optimized Parameters   !
                           ! (Angstroms and Degrees)  !
 --------------------------                            --------------------------
 ! Name  Definition              Value          Derivative Info.                !
 --------------------------------------------------------------------------------
 ! R1    R(1,2)                  1.1935         -DE/DX =    0.0004              !
 ! R2    R(1,3)                  1.1935         -DE/DX =    0.0004              !
 ! R3    R(1,4)                  1.1935         -DE/DX =    0.0004              !
 ! A1    A(2,1,3)                120.0          -DE/DX =    0.0                 !
 ! A2    A(2,1,4)                120.0          -DE/DX =    0.0                 !
 ! A3    A(3,1,4)                120.0          -DE/DX =    0.0                 !
 ! D1    D(2,1,4,3)              180.0          -DE/DX =    0.0                 !
 --------------------------------------------------------------------------------
From graph 1 it can be seen that at each stage of the optimisation, the energy decreases as it approaches -26.46226338 a.u. (the total energy reported in the summary). And in graph 2 it can be seen that the gradient of the energy approaches 0 with each successive step of optimisation, showing the completion of the convergence of the calculation. It also shows that there were 4 stages needed in order to reach the energy minimum.
Vibrational Frequency Analysis of BH3
In this section, a frequency optimisation calculation was conducted on a BH3 molecule. This calculation is useful for two reasons. One, is that it uses the second derivative to calculate whether the molecule is in a transition state, in which case some negative frequencies would be present. And secondly, it is used to predict the different stretching frequencies of the molecule. Below is the summary of the calculation.
BH3 frequency
File Name    georgestanley_bh3_freq
File Type    .log
Calculation Type    FREQ
Calculation Method    RB3LYP
Basis Set    3-21G
Charge    0
Spin    Singlet
E(RB3LYP)    -26.46226338     a.u.
RMS Gradient Norm    0.00020662     a.u.
Imaginary Freq    0
Dipole Moment    0.0000     Debye
Point Group    C3H
Job cpu time:  0 days  0 hours  0 minutes  5.0 seconds.
The summary from the frequency calculation shows the same total energy as for the optimisation calculation earlier, showing that the calculation was conducted on the correct file. The link for this summary can be seen here: Frequency calculation summary for BH3.
Low frequencies ---  -66.7625  -66.3592  -66.3589   -0.0020    0.0031    0.2123
 Low frequencies --- 1144.1483 1203.6413 1203.6424
 Harmonic frequencies (cm**-1), IR intensities (KM/Mole), Raman scattering
 activities (A**4/AMU), depolarization ratios for plane and unpolarized
 incident light, reduced masses (AMU), force constants (mDyne/A),
 and normal coordinates:
                     1                      2                      3
                    A"                     E'                     E'
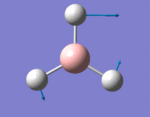
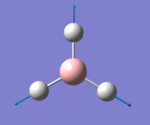
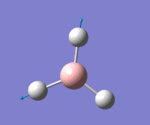
 Frequencies --  1144.1483              1203.6413              1203.6424
 Red. masses --     1.2531                 1.1085                 1.1085
 Frc consts  --     0.9665                 0.9462                 0.9462
 IR Inten    --    92.8665                12.3148                12.3173
  Atom  AN      X      Y      Z        X      Y      Z        X      Y      Z
     1   5     0.00   0.00   0.16     0.00   0.10   0.00    -0.10   0.00   0.00
     2   1     0.00   0.00  -0.57     0.00   0.08   0.00     0.81   0.00   0.00
     3   1     0.00   0.00  -0.57    -0.38  -0.59   0.00     0.14   0.38   0.00
     4   1     0.00   0.00  -0.57     0.38  -0.59   0.00     0.14  -0.38   0.00
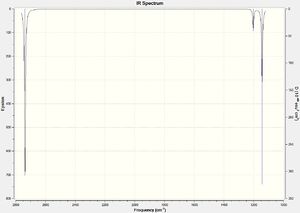
Although there are clearly 6 different vibrational modes, there are only 3 peaks on the IR spectrum (figure 2). This is because the two pairs of vibrations at 1204 cm-1 and at 2737 cm-1 are both degenerate and so only 1 peak for each pair of degenerate vibrations is visible on the spectrum. There is no peak at 2598 cm-1 because this vibrational mode is completely symmetrical and produces no dipole moment, meaning that it is not detected on the IR spectrum.
Molecular Orbitals of BH3
An MO diagram of BH3 was constructed using the linear combination of atomic orbitals (LCAO) method and fragment orbitals. However, this approach is merely a qualitative estimation of the molecular orbitals that are formed meaning there can be mistakes with both the shape of the molecular orbitals that are formed and with the order of their relative energies. Therefore, in this section the two methods were compared using the LCAO method and the B3LYP/6-31G method with full MO analysis.
It can be seen from figure 1 that there is actually some very strong correlation in the shape of the molecular orbitals.The order of energies of the molecular orbitals were also correctly estimated, including the non-bonding character of the low lying 1s orbital on the boron atom. However, the LCAO method cannot quantify the energy gaps between the molecular orbitals, where as the computational method can and does. Also, in this case a very simple molecule is being examined; if the molecule in question was more complex, the LCAO approach would quickly become very complex and would probably serve up more inadequacies.
Link to completed population analysis in the D-space
NBO Analysis of BH3

The B3LYP/6-31G method (with MO analysis on) also allows us to do some "natural bond orbital analysis". For a start, the charge distribution can be seen quantitatively (as shown in figure 1) in which the boron atom has a relative charge of +0.332 and each hydrogen atom has a relative charge of -0.111. This is expected as BH3 is a known Lewis Acid due to an unoccupied pz orbital which can accept electron density.
Summary of Natural Population Analysis:

                                       Natural Population
                Natural  -----------------------------------------------
    Atom  No    Charge         Core      Valence    Rydberg      Total
 -----------------------------------------------------------------------
      B    1    0.33161      1.99903     2.66936    0.00000     4.66839
      H    2   -0.11054      0.00000     1.11021    0.00032     1.11054
      H    3   -0.11054      0.00000     1.11021    0.00032     1.11054
      H    4   -0.11054      0.00000     1.11021    0.00032     1.11054
 =======================================================================
   * Total *    0.00000      1.99903     6.00000    0.00097     8.00000
(Occupancy)   Bond orbital/ Coefficients/ Hybrids
 ---------------------------------------------------------------------------------
     1. (1.99853) BD ( 1) B   1 - H   2
                ( 44.48%)   0.6669* B   1 s( 33.33%)p 2.00( 66.67%)
                                            0.0000  0.5774  0.0000  0.0000  0.0000
                                            0.8165  0.0000  0.0000  0.0000
                ( 55.52%)   0.7451* H   2 s(100.00%)
                                            1.0000  0.0000
     2. (1.99853) BD ( 1) B   1 - H   3
                ( 44.48%)   0.6669* B   1 s( 33.33%)p 2.00( 66.67%)
                                            0.0000  0.5774  0.0000  0.7071  0.0000
                                           -0.4082  0.0000  0.0000  0.0000
                ( 55.52%)   0.7451* H   3 s(100.00%)
                                            1.0000  0.0000
     3. (1.99853) BD ( 1) B   1 - H   4
                ( 44.48%)   0.6669* B   1 s( 33.33%)p 2.00( 66.67%)
                                            0.0000  0.5774  0.0000 -0.7071  0.0000
                                           -0.4082  0.0000  0.0000  0.0000
                ( 55.52%)   0.7451* H   4 s(100.00%)
                                            1.0000  0.0000
     4. (1.99903) CR ( 1) B   1           s(100.00%)
                                            1.0000  0.0000  0.0000  0.0000  0.0000
                                            0.0000  0.0000  0.0000  0.0000
     5. (0.00000) LP*( 1) B   1           s(100.00%)
     6. (0.00000) RY*( 1) B   1           s(  0.00%)p 1.00(100.00%)
     7. (0.00000) RY*( 2) B   1           s(  0.00%)p 1.00(100.00%)
     8. (0.00000) RY*( 3) B   1           s(  0.00%)p 1.00(100.00%)
     9. (0.00000) RY*( 4) B   1           s(  0.00%)p 1.00(100.00%)
    10. (0.00032) RY*( 1) H   2           s(100.00%)
                                            0.0000  1.0000
    11. (0.00032) RY*( 1) H   3           s(100.00%)
                                            0.0000  1.0000
    12. (0.00032) RY*( 1) H   4           s(100.00%)
                                            0.0000  1.0000
    13. (0.00147) BD*( 1) B   1 - H   2
                ( 55.52%)   0.7451* B   1 s( 33.33%)p 2.00( 66.67%)
                                            0.0000  0.5774  0.0000  0.0000  0.0000
                                            0.8165  0.0000  0.0000  0.0000
                ( 44.48%)  -0.6669* H   2 s(100.00%)
                                            1.0000  0.0000
    14. (0.00147) BD*( 1) B   1 - H   3
                ( 55.52%)   0.7451* B   1 s( 33.33%)p 2.00( 66.67%)
                                            0.0000  0.5774  0.0000  0.7071  0.0000
                                           -0.4082  0.0000  0.0000  0.0000
                ( 44.48%)  -0.6669* H   3 s(100.00%)
                                            1.0000  0.0000
    15. (0.00147) BD*( 1) B   1 - H   4
                ( 55.52%)   0.7451* B   1 s( 33.33%)p 2.00( 66.67%)
                                            0.0000  0.5774  0.0000 -0.7071  0.0000
                                           -0.4082  0.0000  0.0000  0.0000
                ( 44.48%)  -0.6669* H   4 s(100.00%)
                                            1.0000  0.0000
As can be seen, some information has been transferred from the .log file from the calculation. Here, some more information about the character of the bonding can be seen: bond 1 (BD (1)) is made between the boron atom (1) and the hydrogen atom (2), 44.48% of the electron density is contributed from the boron orbitals, 33.33% with s-tyoe character and 66.67% with p-type character. The remaining 55.52% of the bond electron density which has been contributed from the hydrohen atom (2), and all of it is from an s orbital. This is exactly the same for bonds 2 and 3, but with the remaining hydrogen atoms. Orbital 4 is a core boron s-orbital, and orbital 5 is a lone pair, however, it is starred and so means that it is unoccupied, i.e. it is the empty p-orbital which makes BH3 a good Lewis acid.
From this information it can be seen that the boron atom is sp2 hybridised, and so forms 3 σ-bonds with each hydrogen atom as expected.
 Second Order Perturbation Theory Analysis of Fock Matrix in NBO Basis

     Threshold for printing:   0.50 kcal/mol
                                                                              E(2)  E(j)-E(i) F(i,j)
         Donor NBO (i)                     Acceptor NBO (j)                 kcal/mol   a.u.    a.u.
 ===================================================================================================

 within unit  1
   4. CR (   1) B   1                / 10. RY*(   1) H   2                    0.70    7.42    0.064
   4. CR (   1) B   1                / 11. RY*(   1) H   3                    0.70    7.42    0.064
   4. CR (   1) B   1                / 12. RY*(   1) H   4                    0.70    7.42    0.064
In this section, information on orbital mixing is given. However, this is usually only of interest if E(2)>20 kcal/mol for any one value (suggesting considerable orbital mixing). However, for borane this is not the case.
Natural Bond Orbitals (Summary):

                                                            Principal Delocalizations
           NBO                        Occupancy    Energy   (geminal,vicinal,remote)
 ====================================================================================
 Molecular unit  1  (H3B)
     1. BD (   1) B   1 - H   2          1.99854    -0.43328
     2. BD (   1) B   1 - H   3          1.99854    -0.43328
     3. BD (   1) B   1 - H   4          1.99854    -0.43328
     4. CR (   1) B   1                  1.99954    -6.68393  10(v),11(v),12(v)
     5. LP*(   1) B   1                  0.00000     0.53915
     6. RY*(   1) B   1                  0.00000     0.37512
     7. RY*(   2) B   1                  0.00000     0.37512
     8. RY*(   3) B   1                  0.00000    -0.04064
     9. RY*(   4) B   1                  0.00000     0.41499
    10. RY*(   1) H   2                  0.00015     0.73308
    11. RY*(   1) H   3                  0.00015     0.73308
    12. RY*(   1) H   4                  0.00015     0.73308
    13. BD*(   1) B   1 - H   2          0.00146     0.42130
    14. BD*(   1) B   1 - H   3          0.00146     0.42130
    15. BD*(   1) B   1 - H   4          0.00146     0.42130
       -------------------------------
              Total Lewis    7.99516  ( 99.9396%)
        Valence non-Lewis    0.00437  (  0.0547%)
        Rydberg non-Lewis    0.00046  (  0.0058%)
       -------------------------------
            Total unit  1    8.00000  (100.0000%)
           Charge unit  1    0.00000
Are there any significant differences between the real and LCAO MOs? What does this say about the accuracy and usefulness of qualitative MO theory?
How to define the existence of a bond
Gaussview draws in bonds purely on a distance based criteria,[2] meaning often bonds are not there when intuitively you would expect them to be present. But how do you define a bond? I would suggest that it is an energetically stabilizing effect between electrons and nuclei, leading systems into an energy sink via equilibrating internuclear distances. It is an equilibrium from which if the coordinates of nuclei in a system are changed, the energy of the system rises.
TlBr3
Pseudo-potentials and basis sets
In this section TlBr3 was analysed, a molecule which in total contains 186 electrons i.e. a lot of electrons to compute at a quantum mechanical level. However, as most of chemistry is based upon the interactions of valence electrons anyway, and in order to drastically reduce the complexity of the calculations, the core electrons were modelled by using a pseudo-potential. Here, the B3LYP method and the LanL2DZ basis set were employed.
TlBr3 optimisation 2
File Name:           tlbr3_optimization_2
File Type:           .log
Calculation Type:    FOPT
Calculation Method:  RB3LYP
Basis Set:           LANL2DZ
Charge:              0
Spin:                Singlet
E(RB3LYP):           -91.21812851 a.u.
RMS Gradient Norm:   0.00000090   a.u.
Imaginary Freq:
Dipole Moment:       0.0000 Debye
Point Group:         D3H
Job cpu time:        0 days  0 hours  0 minutes 28.0 seconds.
The link to the summary can be seen here: Gaussian Calculation Summary for TlBr3, the link to the .log file can be seen here: Log file for the optimisation of TlBr3 and the Jmol of TlBr3 can be seen here: .
The Tl-Br bond distance was calculated to be 2.65 Å, and the Br-Tl-Br bond angle was calculated as 120.0o. The literature value for the Tl-Br bond distance is 2.52 Å, [3] therefore, having reasonable correlation to the calculated bond lengths.
  Item               Value     Threshold  Converged?
 Maximum Force            0.000002     0.000450     YES
 RMS     Force            0.000001     0.000300     YES
 Maximum Displacement     0.000022     0.001800     YES
 RMS     Displacement     0.000014     0.001200     YES
 Predicted change in Energy=-6.083953D-11
 Optimization completed.
    -- Stationary point found.
                           ----------------------------
                           !   Optimized Parameters   !
                           ! (Angstroms and Degrees)  !
 --------------------------                            --------------------------
 ! Name  Definition              Value          Derivative Info.                !
 --------------------------------------------------------------------------------
 ! R1    R(1,2)                  2.651          -DE/DX =    0.0                 !
 ! R2    R(1,3)                  2.651          -DE/DX =    0.0                 !
 ! R3    R(1,4)                  2.651          -DE/DX =    0.0                 !
 ! A1    A(2,1,3)                120.0          -DE/DX =    0.0                 !
 ! A2    A(2,1,4)                120.0          -DE/DX =    0.0                 !
 ! A3    A(3,1,4)                120.0          -DE/DX =    0.0                 !
 ! D1    D(2,1,4,3)              180.0          -DE/DX =    0.0                 !
 --------------------------------------------------------------------------------
Frequency Analysis of TlBr3
Frequency analysis is carried out in order to ensure that an energy minimum is reached and not an energy maximum. This is because the 1st derivative finds a gradient equal to zero, but it cannot distinguish between energy maxima and minima, e.g. transition states and energy sinks (such as stabilised conformers).
Low frequencies ---   -3.4213   -0.0026   -0.0004    0.0015    3.9367    3.9367
 Low frequencies ---   46.4289   46.4292   52.1449
The top row shows the low frequencies, and it can be seen that there are some negative values, but these are relatively small and may be attributed to an element of error in the method and basis sets, so it is assumed that an energy minimum has been reached. The lowest real normal mode is 46.289. The link to the log file can be viewed here: link to .log file.
Isomers of MoCo4L2
In this section two isomers of MoCo4L2 were modelled (the trans and the cis isomers), in which L=PCl3. Cl was chosen to represent the bulkier Ph group as it behaves in a similar fashion both sterically and electronically but is less computationally demanding due to fewer electrons.
Each isomer was initially optimised using the B3LYP/LANL2MB with loose convergence. This low level of accuracy was used in order to obtain generally accurate bond lengths and angles. However, it is very easy for the molecule to slip into a energy minimum which is not the absolute minimum, i.e. to slip into an unwanted conformer. Therefore, after this initial optimisation the molecules were manually moved into different conformations. For the trans isomer, the dihedral angle between one Cl atom from each PCl3 and one axial CO was set to 0o. Ensuring that both PCl3 groups were modelled on the same CO ligand, resulting in an eclipsed conformation. For the cis isomer, one Cl atom was set to eclipse an axial bond, whilst one Cl atom on the other group was set to eclipse an axial in the opposite direction. Once these conformations had been set they were both optimised using B3LYP/LANL2DZ with increased electronic convergence (this increased electronic convergence was achieved by typing "int=ultrafine scf=conver=9" in the additional keywords). This method uses a more rigorous basis set and pseudo-potential and achieves more accurate results. The links for the two optimisations can be seen here: link to the chemical D-space for the optimisation with high electronic convergence for the trans isomer, link to the chemical D-space for the optimisation with high electronic convergence for the cis isomer, along with their Jmols: and .
With these optimised molecules, the IR frequencies were calculated using exactly the same method, basis set and high electronic convergence. The summaries from these calculations and the links to the chemical D-space can be seen here: B3LYP frequency sumamry of the trans isomer using the LANL2DZ pseudo-potential and basis sets, link to the chemical D-space for the trans isomer frequency calculation, B3LYP frequency summary for the cis isomer using the LANL2DZ pseudo-potential and basis sets] and the link to the chemical D-space for the cis isomer frequency calculation.
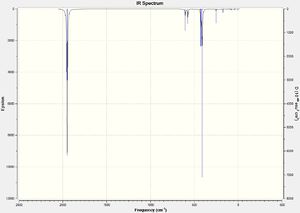
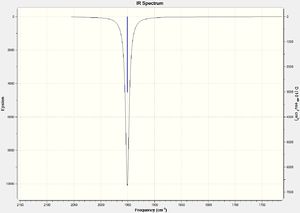
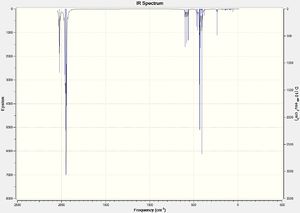
The results from these frequency calculations can be seen below in figures 1 and 2, with the IR spectra being shown in figure 3.
| IR stretch (cm-1) | Animation | Intenisty |
|---|---|---|
| 1950 | 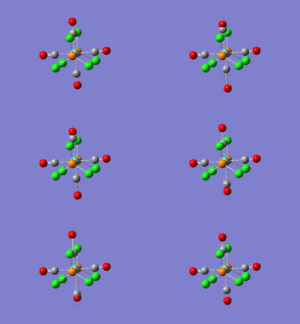 |
1475 |
| 1951 |  |
1467 |
| IR stretch (cm-1) | Animation | Intenisty |
|---|---|---|
| 1945 | 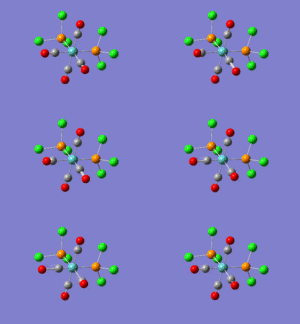 |
763 |
| 1949 |  |
1499 |
| 1958 | 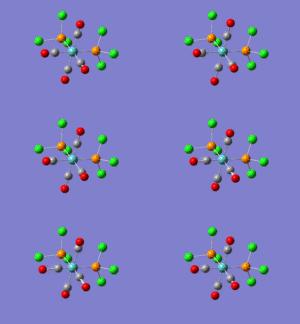 |
633 |
| 2032 | 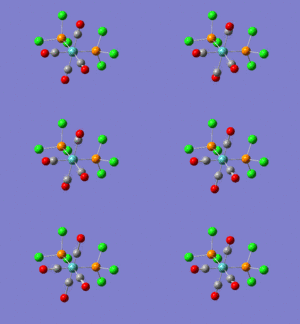 |
598 |
| Trans isomer | Trans isomer enlarged | Cis isomer | Cis isomer enlarged |
|---|---|---|---|
 |
 |
 |
 |
From the frequency calculations, no negative frequencies were obtained, meaning an energy minimum and not an energy maximum was reached.
As expected for the trans isomer there is only one peak on the IR spectrum, however, interestingly there are clearly two different vivrations, one at 1950 cm-1 and the other at 1951 cm-1. The reason only one peak appears on the spectrum is because these two vibrations are degenerate.
Conversely, the cis isomer produces four different vibrations (shown in figure 2) as expected, but only three peaks appear on the spectrum. This is once again due to two degenerate vibrational modes at 1945 and 1949-1, meaning only three peaks appear on the spectrum.
The total energy of the trans isomer has been calculated to be ~0.00104089 a.u. more stable than the cis isomer. However, if you take into account the possible error of ~0.0038 a.u. for each isomer, the scope for error is quite large. In fact, the literature suggests that the cis isomer isomerises to the trans isomer at room temperature,[4] meaning that there is indeed some significant error in the calculated energies. This error can be explained by the lack of representation of the d-orbitals from the metal centre, i.e. the pseudo potentials and basis sets were not accurate enough.
Below is a table (figure 4) stating some of the more important geometric values from the two frequency optimised isomers:
| Isomer | C-Mo bond length | P-Mo bond length | P-Mo-P bond angle (degrees) | C-Mo-C bond angle (degrees) | C-Mo-C bond angle (degrees) | P-Mo-C bond angle (degrees) | P-Mo-C bond angle (degrees) | P-Mo-C bond angle (degrees) | C-Mo-C bond angle (degrees) |
|---|---|---|---|---|---|---|---|---|---|
| Trans | 2.05985-2.06038 | 2.44492 | N/A | N/A | N/A | 91.3 (eclipsed atoms) | 90.0 (atoms syn to eclipsed atoms) | 88.7 (trans to eclipsed atoms) | 89.5 (one carbon atoms is eclipsed) |
| Cis | 2.01163-2.01166 (trans to L), 2.05774 (cis to L) | 2.51210-2.51218 | 94.2 | 178.3 (carbonyl ligands which are both cis to L) | 87.1 (the two trans carbonyls) | N/A | N/A | N/A | N/A |
In the cis isomer it can be seen that the Mo-C bonds are generally shorter than those in the trans isomer. This phenomenon can be ascribed to the trans effect in which electron density is donated from a lone pair on the phosphorus atom into the d-orbitals on the metal centre. Some of this electron density then goes to the π-acceptor CO ligands, thus shortening the C-Mo bonds in the cis isomer.
From looking at the bond angles, it can also be seen that there is a tendency for the carbonyl ligands to move away from the bulky PCl3 ligands as expected.
The longer P-Mo bonds in the cis isomer can also be explained by steric hindrance. This increase in bond length increases the distance between the two bulky PCl3 ligands, thus decreasing the overall energy of the complex.
Mini-Project
Hydrogen Peroxide
In this project I am going to look at 4 different molecules: H2O2, F2O2, H2S2 and F2S2. There will comparisons of conformations for each molecule, mostly looking at the relative energy differences for the syn-clinal and anti-periplanar conformations. Once the most stable conformer has been found, there will be some MO and NBO analysis in order to try and justify the preference for a certain conformation, and also as a tool to look at the accuracy and reliability of the LCAO approach to forming molecular orbitals. Vibrational analysis will also be used to compare any key differences apparent between the molecules in question.
As all the molecules only had 4 atoms, the heaviest being sulphur with 16 electrons, it seemed unnecessary to use pseudo-potentials during the optimisation processes. Therefore, all molecules were optimised using the B3LYP/3-21G method with "opt=loose", followed by the more accurate B3LYP/6-31G (d,p) method with "int=ultrafine scf=conver=9". These energy minima were then checked using a frequency calculation. When optimising the different conformers the dihedral angles were first changed into approximately the correct orientation for that conformer, i.e. for the syn-clinal conformation the dihedral angle was set to 300<x<900 and for anti-periplanar it was set to 1800. Links to the summary of certain calculations can be seen throughout the project.
| Molecule | Jmol | Energy (a.u.) | RMS Gradient Norm. (a.u.) | Dipole Moment (Debye) | Dihedral Angle | Point Group | Link to summary |
|---|---|---|---|---|---|---|---|
| H2O2 Anti-clinal | -151.54319115 | 0.00015135 | 1.7625 | 118.4o | C2 | Anti-clinal conformer summary link | |
| H2O2 Anti-periplanar | -151.54211132 | 0.00011735 | 0.0000 | 180.0o | C2H | Anti-periplanar conformer summary |
From these results it would appear that the anti-clinal conformer is the more stable conformer. However, if you take into account the possible error of ~10kJ/mol, then -151.54319115+0.0038 a.u. and -151.54211132-0.0038 a.u. would result in the anti-periplanar conformer being more stable. However, the literature suggests that the anti-clinal conformer is more stable than the anti-periplanar conformer, and so that is what will be analysed in this section. [5]

| IR stretch (cm-1) | Animation | Intenisty |
|---|---|---|
| 341 |  |
198 |
| 956 | 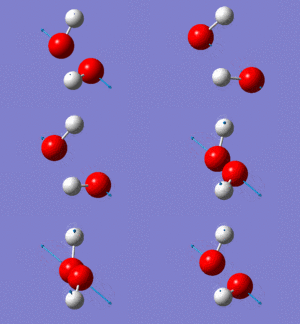 |
1 |
| 1311 | 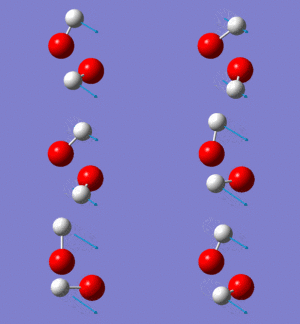 |
110 |
| 1447 | 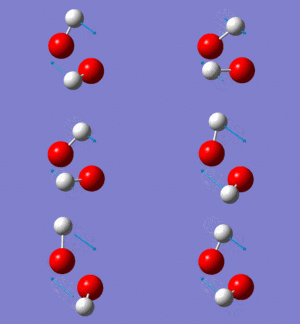 |
0 |
| 3765 | 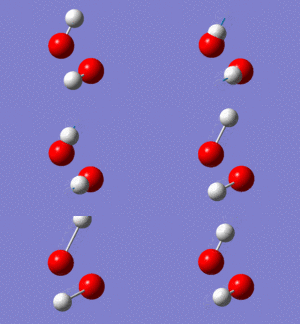 |
6 |
| 3766 |  |
33 |

No negative frequencies were recorded meaning that an energy minimum was reached. 6 vibrations were also recorded as expected (i.e. agrees with the 3N-6 rule for non-linear molecules), and interestingly, only 4 peaks appear on the spectrum. The peak at 956 cm-1 is very small (possibly due to a very weak dipole moment) but can be seen in figure 4 (right). Similarly the peak at 1447 cm-1 does not appear because of the symmetry of the vibration resulting in a negligible dipole moment. Assuming that the O-O bond is in the plane of the z-axis, both hydrogen atoms move back and forth in the plane of the z-axis systematically coming closer together and then further away as the oxygen atoms wag in order to preserve the centre of gravity. This means it is only the movement of the oxygen atoms which causes any dipole moment, yet this movement is negligible. Lastly, the two vibrations at 3765 and 3766 cm-1 are degenerate, the former being a symmetric stretch and the latter an asymmetric stretch.
MO analysis of Hydrogen Peroxide
Approximating an MO diagram was very challenging for anti-clinal hydrogen peroxide molecule due to the low level of symmetry of the molecule, so a detailed analysis of its molecular orbitals and natural bonding orbitals was conducted instead. A summary of some of its molecular orbitals can be seen in figure 1 below.
| Molecular Orbital | Image | Comments | Molecular Orbital | Image | Comments | Molecular Orbital | Image | Comments |
|---|---|---|---|---|---|---|---|---|
| HOMO -8 |  |
Non-bonding s-orbitals (core orbitals) on the oxygen atoms. Degenerate with HOMO -7. | HOMO -2 |  |
This molecular orbital is degenerate to the HOMO -3 MO, made up of p-orbital interactions. | LUMO +3 |  |
- |
| HOMO -7 |  |
The degenerate (to HOMO -8) non-bonding s-orbitals based on the oxygen atoms | HOMO -1 |  |
Interestingly, the HOMO -1 appears to show a lot of anti-bonding character. Perhaps this would suggest that it is fairly high in energy. | LUMO +4 |  |
- |
| HOMO -6 |  |
The first molecular bonding orbital. A completely bonding MO made from an s orbital on each atom. | HOMO |  |
The HOMO also appears to have a lot of anti-bonding character again suggesting that it is quite high in energy (see figure 2)[6] | LUMO +5 |  |
- |
| HOMO -5 |  |
An MO with a node between the two oxygen atoms, but with strong bonding character between each oxygen atom and its adjacent hydrogen atom. | LUMO |  |
As expected, there are quite a few nodes present in the LUMO suggesting a lot of anti-bonding character. | LUMO +6 |  |
- |
| HOMO -4 |  |
Bonding character between the two oxygen atoms, but two nodes present, one on each oxygen atom, suggesting the interaction of p-orbitals from the oxygen atoms. | LUMO +1 |  |
- | LUMO +7 |  |
- |
| HOMO -3 |  |
Node along the O-O bond, but π-type bonding interactions. | LUMO +2 |  |
- | LUMO +8 |  |
- |

Although the diagram in figure 2 is fairly crude, it also suggests an explanation as to why there is so much anti-bonding character in the HOMO -1 and HOMO molecular orbitals. The diagram is of a reduced dioxygen, with the 2 red electrons representing the reducing electrons from the hydrogen atoms. From this diagram it can be seen that the two degenerate π*-orbitals are occupied (i.e. the HOMO -1 and HOMO). However, from the MO calculations done the two orbitals did not seem to be degenerate. This will be due to internuclear interactions and electrostatic interactions which have been unaccounted for in figure 2.
NBO Analysis of Hydrogen Peroxide
  (Occupancy)   Bond orbital/ Coefficients/ Hybrids
 ---------------------------------------------------------------------------------
     1. (1.99598) BD ( 1) O   1 - O   2
                ( 50.00%)   0.7071* O   1 s( 11.04%)p 8.04( 88.75%)d 0.02(  0.21%)
                                           -0.0001 -0.3311  0.0279 -0.0036 -0.0095
                                            0.0172  0.9410  0.0355 -0.0071  0.0163
                                            0.0129 -0.0060  0.0130  0.0330  0.0249
                ( 50.00%)   0.7071* O   2 s( 11.04%)p 8.04( 88.75%)d 0.02(  0.21%)
                                           -0.0001 -0.3311  0.0279 -0.0036  0.0095
                                           -0.0172 -0.9410 -0.0355 -0.0071  0.0163
                                            0.0129  0.0060 -0.0130  0.0330  0.0249
     2. (1.99655) BD ( 1) O   1 - H   4
                ( 74.20%)   0.8614* O   1 s( 21.83%)p 3.58( 78.07%)d 0.00(  0.10%)
                                            0.0000  0.4664 -0.0265 -0.0020  0.7419
                                            0.0095  0.1744  0.0235  0.4463  0.0064
                                           -0.0025  0.0268 -0.0002  0.0164 -0.0053
                ( 25.80%)   0.5079* H   4 s( 99.82%)p 0.00(  0.18%)
                                            0.9991 -0.0034 -0.0367 -0.0064 -0.0205
     3. (1.99655) BD ( 1) O   2 - H   3
                ( 74.20%)   0.8614* O   2 s( 21.83%)p 3.58( 78.07%)d 0.00(  0.10%)
                                            0.0000 -0.4664  0.0265  0.0020  0.7419
                                            0.0095  0.1744  0.0235 -0.4463 -0.0064
                                            0.0025  0.0268 -0.0002 -0.0164  0.0053
                ( 25.80%)   0.5079* H   3 s( 99.82%)p 0.00(  0.18%)
                                           -0.9991  0.0034 -0.0367 -0.0064  0.0205
     4. (1.99991) CR ( 1) O   1           s(100.00%)
                                            1.0000 -0.0001  0.0000  0.0000  0.0000
                                            0.0000  0.0001  0.0000  0.0000  0.0000
                                            0.0000  0.0000  0.0000  0.0000  0.0000
     5. (1.99991) CR ( 1) O   2           s(100.00%)
                                            1.0000 -0.0001  0.0000  0.0000  0.0000
                                            0.0000 -0.0001  0.0000  0.0000  0.0000
                                            0.0000  0.0000  0.0000  0.0000  0.0000
From looking at bonding orbitals 2 and 3, and especially the contributions from the oxygen atoms (21.83% from s orbitals, 78.07% from p orbitals and 0.10% from d orbitals) it can be seen that the oxygen atoms are very strongly sp3 hybridised. It can also be seen from bonding orbital 1 that the bonding orbital between the two oxygen atoms is dominated by p orbitals. This would seem to back up the evidence from the molecular orbitals which were analysed earlier, in which most of the bonding between the atoms appeared to have p-character.
O2F2 Analysis
In order to find the most stable conformer, two separate strings of calculations were done, one with the molecule in the syn-clinal conformation, and the other with it in the anti-periplanar conformation. The results for the optimisation calculations can be seen below, along with the dihedral angles for the fully optimised molecules.
| Molecule | Jmol | Energy (a.u.) | RMS Gradient Norm. (a.u.) | Dipole Moment (Debye) | Dihedral Angle | Point Group | Link to summary |
|---|---|---|---|---|---|---|---|
| O2F2 Syn-clinal | -349.80379308 | 0.00001286 | 0.8575 | 86.8o | C2 | Syn-clinal conformer summary link | |
| O2F2 Anti-periplanar | -349.77188356 | 0.00003855 | 0.0000 | 180.0o | C2H | Anti-periplanar conformer summary |
From these results it can be seen that the total energy of the syn-clinal conformer is lower in energy by 0.0319095 a.u. Even with taking the ~10kJ/mol error into account, if the total energy of the syn-clinal conformer was -349.80379308+0.0038 a.u. and the energy of the anti-periplanar conformer was -349.77188356-0.0038 a.u., the syn-clinal conformer would still be more stable by 0.0243095 a.u. Therefore, for the rest of this section the more stable syn-clinal conformer is analysed, beginning with vibrational analysis.
The frequency calculation for the anti-periplanar conformer yielded an energy of -349.80379262 a.u., i.e. very similar to that gained from the optimisation calculation (link: Summary of frequency calculation of syn-clinal O2F2).
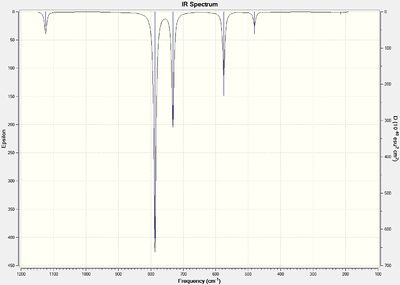
| IR stretch (cm-1) | Intenisty |
|---|---|
| 215 | 0 |
| 481 | 7 |
| 575 | 33 |
| 732 | 58 |
| 787 | 123 |
| 1124 | 11 |
From the vibrational analysis it can be seen that there are no negative frequencies present, meaning that the energy minimum that was reached was indeed a minimum and not a maximum (i.e. a transition state). It can also be seen that there are 6 vibrational frequencies as expected (because molecule is not linear and so should follow the 3N-6 rule).
NBO Analysis
 (Occupancy)   Bond orbital/ Coefficients/ Hybrids
 ---------------------------------------------------------------------------------
     1. (1.99540) BD ( 1) O   1 - O   2
                ( 50.00%)   0.7071* O   1 s( 18.08%)p 4.52( 81.68%)d 0.01(  0.24%)
                                            0.0000 -0.4182  0.0768  0.0028  0.4567
                                            0.0100  0.7731  0.0436  0.0914 -0.0104
                                           -0.0371 -0.0085 -0.0099  0.0180  0.0228
                ( 50.00%)   0.7071* O   2 s( 18.08%)p 4.52( 81.68%)d 0.01(  0.24%)
                                            0.0000 -0.4182  0.0768  0.0028 -0.4567
                                           -0.0100 -0.7731 -0.0436  0.0914 -0.0104
                                           -0.0371  0.0085  0.0099  0.0180  0.0228
     2. (1.99605) BD ( 1) O   1 - F   3
                ( 45.00%)   0.6708* O   1 s(  5.27%)p17.96( 94.64%)d 0.02(  0.09%)
                                            0.0000 -0.2264  0.0375 -0.0056  0.4773
                                           -0.0093 -0.4874 -0.0287  0.6929  0.0064
                                            0.0089 -0.0235  0.0063 -0.0116 -0.0097
                ( 55.00%)   0.7416* F   3 s(  5.21%)p18.15( 94.52%)d 0.05(  0.27%)
                                            0.0000 -0.2280  0.0080 -0.0028 -0.4087
                                            0.0000  0.5731  0.0011 -0.6706 -0.0005
                                            0.0214 -0.0232  0.0385  0.0118 -0.0097
     3. (1.99605) BD ( 1) O   2 - F   4
                ( 45.00%)   0.6708* O   2 s(  5.27%)p17.96( 94.64%)d 0.02(  0.09%)
                                            0.0000  0.2264 -0.0375  0.0056  0.4773
                                           -0.0093 -0.4874 -0.0287 -0.6929 -0.0064
                                           -0.0089 -0.0235  0.0063  0.0116  0.0097
                ( 55.00%)   0.7416* F   4 s(  5.21%)p18.15( 94.52%)d 0.05(  0.27%)
                                            0.0000  0.2280 -0.0080  0.0028 -0.4087
                                            0.0000  0.5731  0.0011  0.6706  0.0005
                                           -0.0214 -0.0232  0.0385 -0.0118  0.0097
     4. (1.99989) CR ( 1) O   1           s(100.00%)p 0.00(  0.00%)
                                            1.0000  0.0000  0.0000  0.0000 -0.0001
                                            0.0000  0.0000  0.0000  0.0001  0.0000
                                            0.0000  0.0000  0.0000  0.0000  0.0000
     5. (1.99989) CR ( 1) O   2           s(100.00%)p 0.00(  0.00%)
                                            1.0000  0.0000  0.0000  0.0000  0.0001
                                            0.0000  0.0000  0.0000  0.0001  0.0000
                                            0.0000  0.0000  0.0000  0.0000  0.0000
From this it can be seen that bond one is between the two oxygen atoms, both atoms contribute 50% of the electron density, 18.08% from s-orbitals, 81.68% from p-orbitals and 0.24% from d-orbitals. Bonds 2 and 3 are between one oxygen atom and one adjacent fluorine atom, in which the oxygen atom contributes 45% of the electron density, 5.27% from s-orbitals, 94.64% from p-orbitals and 0.09% from d-orbitals. The remaining 55% is comes from the fluorine atom, 5.21% from s-orbitals, 94.52% from p-orbitals and 0.27% from the d-orbitals.
This shows that interestingly there is a small amount of mixing from the d-orbitals involved in the oxygen-fluorine bonding orbitals.
S2H2 Analysis
After the optimisation of S2H2 from the anti-periplanar conformation and from the anti-clinal conformation, it was discovered that once again, the anti-periplanar conformation was slightly higher in energy, and so further analysis was conducted on the anti-clinal conformer (dihedral angle 90.9o) . Links to the optimisation calculations and Jmols can be seen here:optimisation summary for the anit-periplanar conformer, optimisation summary for the anti-clinal conformer, and .
From the frequency calculations, interestingly, two different degenerate pairs of vibrational modes are observed; one pair being the vibrations at 893 and 894 cm-1, and the other being at 2636 and 2638 cm-1. Both are pairs of symmetric and asymmetric stretches. The data and spectra can be seen below in figures 1 and 2.
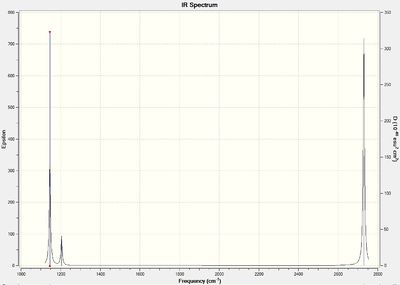
| IR stretch (cm-1) | Intenisty |
|---|---|
| 427 | 19 |
| 494 | 0 |
| 893 | 13 |
| 894 | 1 |
| 2636 | 11 |
| 2638 | 15 |
From looking at the molecular orbitals, it was interesting to see the existence of so many low lying non-bonding s-orbitals on the sulphur atoms, the first bonding orbital being the HOMO -6. This result is expected though due to the larger size of the sulphur atom compared to the hydrogen atom, resulting in a large energy difference and so no orbital interaction. The LUMO showed a lot of anti-bonding character (as did the HOMO although this has not been shown in figure 3), and in fact, 3 nodes can be seen. The MO picture seems to represent very nicely two anti-bonding p-orbitals interacting along the axis of the S-S bond. Further evidence for the abundance of non-bonding s-orbitals compared with the large number of molecular orbitals dominated by p-orbitals can be seen below in the NBO analysis. Pictures of the MOs can be seen in figure 3 below.
| HOMO -6 | LUMO |
|---|---|
 |
 |
  (Occupancy)   Bond orbital/ Coefficients/ Hybrids
 ---------------------------------------------------------------------------------
     1. (1.99621) BD ( 1) S   1 - S   2
                ( 50.00%)   0.7071* S   1 s( 10.14%)p 8.79( 89.12%)d 0.07(  0.74%)
                                            0.0000 -0.0001 -0.3168  0.0324 -0.0035
                                            0.0000 -0.0128 -0.0252  0.0000  0.9416
                                           -0.0516  0.0000 -0.0185 -0.0271  0.0068
                                            0.0008  0.0142  0.0730  0.0423
                ( 50.00%)   0.7071* S   2 s( 10.14%)p 8.79( 89.12%)d 0.07(  0.74%)
                                            0.0000 -0.0001 -0.3168  0.0324 -0.0035
                                            0.0000  0.0128  0.0252  0.0000 -0.9416
                                            0.0516  0.0000 -0.0185 -0.0271  0.0068
                                           -0.0008 -0.0142  0.0730  0.0423
     2. (1.99614) BD ( 1) S   1 - H   3
                ( 57.94%)   0.7612* S   1 s( 15.12%)p 5.57( 84.20%)d 0.04(  0.68%)
                                            0.0000  0.0000  0.3867 -0.0409 -0.0018
                                            0.0000  0.6434 -0.0385  0.0000  0.1443
                                           -0.0389  0.0000  0.6347 -0.0378  0.0065
                                            0.0687  0.0071  0.0383  0.0220
                ( 42.06%)   0.6486* H   3 s( 99.79%)p 0.00(  0.21%)
                                            0.9989  0.0043 -0.0324 -0.0083 -0.0311
     3. (1.99614) BD ( 1) S   2 - H   4
                ( 57.94%)   0.7612* S   2 s( 15.12%)p 5.57( 84.20%)d 0.04(  0.68%)
                                            0.0000  0.0000 -0.3867  0.0409  0.0018
                                            0.0000  0.6434 -0.0385  0.0000  0.1443
                                           -0.0389  0.0000 -0.6347  0.0378 -0.0065
                                            0.0687  0.0071 -0.0383 -0.0220
                ( 42.06%)   0.6486* H   4 s( 99.79%)p 0.00(  0.21%)
                                           -0.9989 -0.0043 -0.0324 -0.0083  0.0311
As shown above, 89.12& of the electrons forming the S-S bond comes from p-orbitals, and 84.20% of the electrons forming the S-H bonds also come from p-orbitals. This increase in contribution to bonding from the p-orbitals is showing the contraction of s-orbitals and so the increase in energy gap between the s and p orbitals, resulting in less hybridisation, also offering some more explanation as to why the dihedral angle is so close to 90 o.
S2F2 Analysis
For the S2F2 molecule, the most energetically favourable conformation was the syn-clinal with a dihedral angle of 89.1o. The links for the optimisation calculations and the Jmols can be seen here: link for the optimisation summary of the anti-periplanar conformer, optimisation summary of the syn-clinal conformer, and .
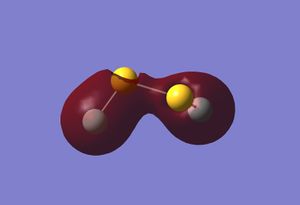
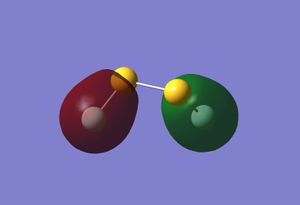
From conducting some molecular orbital analysis, the strong effect of the lone pairs can be seen again like in S2H2, perhaps meaning they are now one of the stronger influences on the dihedral angle (i.e. the effect of steric hindrance). In figure 1 below, the strong effect of the lone pairs can be seen on the molecular orbitals.
| HOMO -12 | HOMO -11 | HOMO |
|---|---|---|
 |
 |
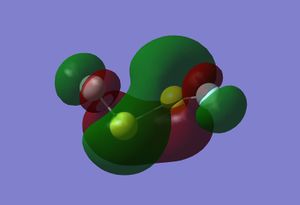 |
Once again it can be seen that there is some strong anti-bonding character in the HOMO, meaning it is probably relatively high in energy.
(Occupancy)   Bond orbital/ Coefficients/ Hybrids
 ---------------------------------------------------------------------------------
     1. (1.98884) BD ( 1) S   1 - S   2
                ( 50.00%)   0.7071* S   1 s( 12.91%)p 6.65( 85.88%)d 0.09(  1.21%)
                                            0.0000  0.0000 -0.3520  0.0722 -0.0016
                                            0.0000 -0.4078  0.0092  0.0000  0.8227
                                           -0.0674  0.0000 -0.1050 -0.0097  0.0723
                                           -0.0037  0.0164  0.0604  0.0539
                ( 50.00%)   0.7071* S   2 s( 12.91%)p 6.65( 85.88%)d 0.09(  1.21%)
                                            0.0000  0.0000 -0.3520  0.0722 -0.0016
                                            0.0000  0.4078 -0.0092  0.0000 -0.8227
                                            0.0674  0.0000 -0.1050 -0.0097  0.0723
                                            0.0037 -0.0164  0.0604  0.0539
     2. (1.99670) BD ( 1) S   1 - F   3
                ( 26.11%)   0.5110* S   1 s(  6.98%)p13.18( 92.00%)d 0.15(  1.02%)
                                            0.0000  0.0000  0.2483 -0.0900 -0.0021
                                            0.0000  0.5157 -0.0260  0.0000  0.4424
                                           -0.0683  0.0000  0.6711 -0.0512  0.0462
                                            0.0645  0.0569  0.0076  0.0245
                ( 73.89%)   0.8596* F   3 s( 13.66%)p 6.31( 86.19%)d 0.01(  0.15%)
                                            0.0000  0.3696 -0.0007 -0.0019 -0.4417
                                            0.0019 -0.5261  0.0017 -0.6245  0.0024
                                            0.0176  0.0205  0.0257 -0.0044  0.0065
     3. (1.99670) BD ( 1) S   2 - F   4
                ( 26.11%)   0.5110* S   2 s(  6.98%)p13.18( 92.00%)d 0.15(  1.02%)
                                            0.0000  0.0000 -0.2483  0.0900  0.0021
                                            0.0000  0.5157 -0.0260  0.0000  0.4424
                                           -0.0683  0.0000 -0.6711  0.0512 -0.0462
                                            0.0645  0.0569 -0.0076 -0.0245
                ( 73.89%)   0.8596* F   4 s( 13.66%)p 6.31( 86.19%)d 0.01(  0.15%)
                                            0.0000 -0.3696  0.0007  0.0019 -0.4417
                                            0.0019 -0.5261  0.0017  0.6245 -0.0024
                                           -0.0176  0.0205  0.0257  0.0044 -0.0065
From looking at the bonding orbitals 2 and 3, it can be seen that there is a large contribution from p-orbitals both for sulphur and fluorine. This lack of contribution from the s orbitals is expected as their energy levels are too low (they are held very tightly to the nuclei) and so do not interact very much to form molecular orbitals.
This large contribution from the p-orbitals and so lack of hybridisation with s orbitals could explain why the dihedral angle is approaching 90 0, in a similar fashion to S2H2.
References
- ↑ Schuurman, Allen, and Schaefer, Vol. 26, No. 11, Journal of Computational Chemistry, p.1109, DOI: 10.1002/jcc.20238
- ↑ http://www.huntresearchgroup.org.uk/teaching/year3_lab_start.html
- ↑ Johan Blixt, Julius Glaser, Janos Mink, Ingmar Persson, Per Persson and Magnus Sandstrom, J. Am. Chem. SOC. 1995,117, 5089-5104, DOI: 10.1021/ja00123a011
- ↑ Graeme Hogarth and Tim Norman, Inorganica Chimica Acta, Volume 254, Issue 1, 1 January 1997, p. 167-171
- ↑ Alice Chung Phillips and Kimberly A. Jebber, J. Chem. Phys. 102, 7082 (1995); DOI: 10.1063/1.469101
- ↑ http://employees.csbsju.edu/hjakubowski/classes/ch331/oxphos/oldioxygenchem.html 20:00 31/10/2011


