Rep:Mod:gang aft agley
BH3
Optimisation
A molecule of BH3 was created in GaussView 5.0.8c. The three B-H bond lengths were all set to 1.5 Å using the Modify Bond button.
This molecule was then optimised in GaussView 5.0.8c with the following criteria:
- Method: B3LYP - determines the types of approximations used when solving the Schrödinger equation.
- Basis Set: 3-21G - determines the level of accuracy (3-21G has relatively low accuracy and is therefore relatively quick to run).
- Type of Calculation: OPT - optimisation.
The file was saved as daniel_bh3_opt.gjf and the calculation was submitted.
The Gaussian Output File DANIEL_BH3_OPT.LOG was then opened in Gaussian.
Geometrical information about the optimised BH3 molecule was extracted using the Inquire button. All three B-H bonds were found to be 1.19 Å. All three H-B-H bond angles were found to be 120.0o.
A Summary of the results is tabulated below.
| heading | heading |
|---|---|
| File Name | DANIEL_BH3_OPT |
| File Type | .log |
| Calculation Type | FOPT |
| Calculation Method | RB3LYP |
| Basis Set | 3-21G |
| Charge | 0 |
| Spin | Singlet |
| Energy(RB3LYP)/a.u. | -26.46 |
| RMS Gradient Norm/a.u. | 0.00 |
| Dipole Moment/Debye | 0.00 |
| Point Group | D3H |
Job cpu time: 16.0 seconds.
The gradient is close to zero (less than 0.001) and so the optimisation was successful.
The text based .log file was then opened in WordPad to check that the calculation did actually converge:
         Item               Value     Threshold  Converged?
Maximum Force            0.000413     0.000450     YES
RMS     Force            0.000271     0.000300     YES
Maximum Displacement     0.001610     0.001800     YES
RMS     Displacement     0.001054     0.001200     YES
Predicted change in Energy=-1.071764D-06
Optimization completed.
   -- Stationary point found.
                          ----------------------------
                          !   Optimized Parameters   !
                          ! (Angstroms and Degrees)  !
--------------------------                            --------------------------
! Name  Definition              Value          Derivative Info.                !
--------------------------------------------------------------------------------
! R1    R(1,2)                  1.1935         -DE/DX =    0.0004              !
! R2    R(1,3)                  1.1935         -DE/DX =    0.0004              !
! R3    R(1,4)                  1.1935         -DE/DX =    0.0004              !
! A1    A(2,1,3)              120.0            -DE/DX =    0.0                 !
! A2    A(2,1,4)              120.0            -DE/DX =    0.0                 !
! A3    A(3,1,4)              120.0            -DE/DX =    0.0                 !
! D1    D(2,1,4,3)            180.0            -DE/DX =    0.0                 !
--------------------------------------------------------------------------------
GradGradGradGradGradGradGradGradGradGradGradGradGradGradGradGradGradGrad
As can be seen above, the forces (gradient of an energy vs distance plot) have converged.
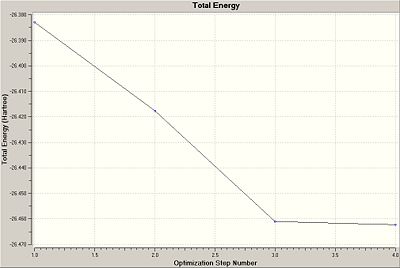
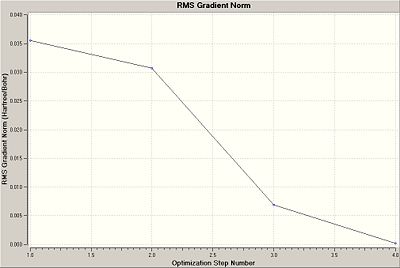
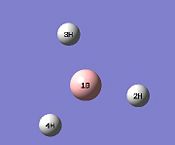
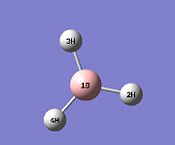
Comparing the two plots above with the table below, it is clear that the structure with the shortest B-H bond lengths, 4, has the most negative (most stable) Total Energy. It also has the smallest gradient and hence the smallest forces acting on it, and hence 4 gives the best representation of the geometrically optimised BH3.
| Step Number | 1 | 2 | 3 | 4 |
|---|---|---|---|---|
| Frame |  |
 |
 |
 |
| B-H Bond Length/Å | 1.50000 | 1.40834 | 1.22503 | 1.19349 |
The images in the above table graphically represent 1 and 2 as having NO B-H bonds. This is, of course, not the case. Bonds still exist between the atoms. However, GaussView has some pre-defined value where any internuclear distance exceeding this value does not constitute a bond.
Molecular Orbital analysis
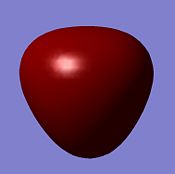
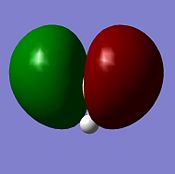
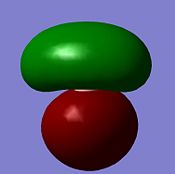
A qualitative Molecular Orbital diagram was produced for BH3 and is given below. The occupied MO's as well as the LUMO were calculated in Gaussian with a B3LYP method and a 3-21g basis set. The qualitative and quantitative approach outcomes were then compared.
https://www.ch.ic.ac.uk/wiki/images/a/a3/DANIEL_BH3_OPT_PUBLISH.LOG
https://www.ch.ic.ac.uk/wiki/images/f/f0/DANIEL_BH3_POP_PUBLISH.LOG

| MO | 1a1' | 2a1' | 1e' | 1e' |
|---|---|---|---|---|
| Diagram | 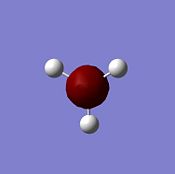 |
 |
 |
 |
| Energy/ kJmol-1 | -17670 | -1359 | -937 | -937 |
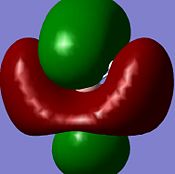
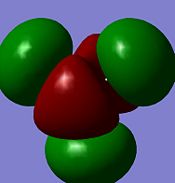
| MO | a2" | 3a1' | 2e' | 2e' |
| Diagram | 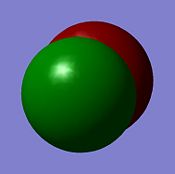 |
 |
 |
 |
| Energy/ kJmol-1 | -196 | 496 | 4967 | 505 |
Note: MO's have been rotated slightly (so that the z-axis does not come perfectly normally out of the plane of the screen) to give a better picture
The computed MO graphical representations are coherent with the constructed MO diagram in both their form (i.e. the distribution of electron density across the molecule), and their relative energy orderings. One problem overcome by the calculated picture is the relative energy orderings of the 3a1' and 2e' MO's. From a qualitative approach there would be two factors to consider: s-s interactions are stronger tan s-p interactions (which would lead to 3a1' being higher in energy); a1' energy level is lower than e' energy levels (which would lead to 3a1' being lower in energy). The constructed MO diagram shows the individual orbital contribution of each atom to the real MO's (the computed MO's are given as a "resultant" MO and do not resolve into the individual orbital contribution of each atom).
In summary, qualitative MO diagrams are useful in getting an initial impression of a system or molecule. However, for a more detailed and more accurate desciption of the system or molecule, more intensive computational methods need to be employed.
NBO analysis
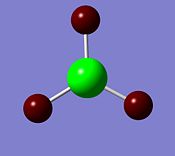

The deep red colour of the hydrogen atoms in the image on the left represents a negative charge. Whereas the bright green colour represents the positive charge of the boron atom. This is to be expected and reflects the Lewis deficiency of the boron atom. The image on the right shows the NBO charges of each atom.
Summary of Natural Population Analysis:

                                      Natural Population
               Natural  -----------------------------------------------
   Atom  No    Charge         Core      Valence    Rydberg      Total
-----------------------------------------------------------------------
     B    1    0.33161      1.99903     2.66935    0.00000     4.66839
     H    2   -0.11054      0.00000     1.11021    0.00032     1.11054
     H    3   -0.11054      0.00000     1.11021    0.00032     1.11054
     H    4   -0.11054      0.00000     1.11021    0.00032     1.11054
=======================================================================
  * Total *    0.00000      1.99903     6.00000    0.00097     8.00000
    1. (1.99853) BD ( 1) B   1 - H   2
               ( 44.48%)   0.6669* B   1 s( 33.33%)p 2.00( 66.67%)
                                           0.0000  0.5774  0.0000  0.0000  0.0000
                                           0.8165  0.0000  0.0000  0.0000
               ( 55.52%)   0.7451* H   2 s(100.00%)
                                           1.0000  0.0000
    2. (1.99853) BD ( 1) B   1 - H   3
               ( 44.48%)   0.6669* B   1 s( 33.33%)p 2.00( 66.67%)
                                           0.0000  0.5774  0.0000  0.7071  0.0000
                                          -0.4082  0.0000  0.0000  0.0000
               ( 55.52%)   0.7451* H   3 s(100.00%)
                                           1.0000  0.0000
    3. (1.99853) BD ( 1) B   1 - H   4
               ( 44.48%)   0.6669* B   1 s( 33.33%)p 2.00( 66.67%)
                                           0.0000  0.5774  0.0000 -0.7071  0.0000
                                          -0.4082  0.0000  0.0000  0.0000
               ( 55.52%)   0.7451* H   4 s(100.00%)
                                           1.0000  0.0000
    4. (1.99903) CR ( 1) B   1           s(100.00%)
                                           1.0000  0.0000  0.0000  0.0000  0.0000
                                           0.0000  0.0000  0.0000  0.0000
Frequency analysis
Low frequencies ---  -66.7625  -66.3592  -66.3589   -0.0020    0.0031    0.2123
Low frequencies --- 1144.1483 1203.6413 1203.6424
Diagonal vibrational polarizability:
       0.6013547       0.6012848       1.9090953
Harmonic frequencies (cm**-1), IR intensities (KM/Mole), Raman scattering
activities (A**4/AMU), depolarization ratios for plane and unpolarized
incident light, reduced masses (AMU), force constants (mDyne/A),
and normal coordinates:
                    1                      2                      3
                   A"                     E'                     E'
Frequencies --  1144.1483              1203.6413              1203.6424
Red. masses --     1.2531                 1.1085                 1.1085
Frc consts  --     0.9665                 0.9462                 0.9462
IR Inten    --    92.8665                12.3148                12.3173
 Atom  AN      X      Y      Z        X      Y      Z        X      Y      Z
    1   5     0.00   0.00   0.16     0.00   0.10   0.00    -0.10   0.00   0.00
    2   1     0.00   0.00  -0.57     0.00   0.08   0.00     0.81   0.00   0.00
    3   1     0.00   0.00  -0.57    -0.38  -0.59   0.00     0.14   0.38   0.00
    4   1     0.00   0.00  -0.57     0.38  -0.59   0.00     0.14  -0.38   0.00
                    4                      5                      6
                   A'                     E'                     E'
Frequencies --  2598.4249              2737.4364              2737.4371
Red. masses --     1.0078                 1.1260                 1.1260
Frc consts  --     4.0092                 4.9714                 4.9714
IR Inten    --     0.0000               103.7400               103.7333
 Atom  AN      X      Y      Z        X      Y      Z        X      Y      Z
    1   5     0.00   0.00   0.00     0.11   0.00   0.00     0.00   0.11   0.00
    2   1     0.00   0.58   0.00     0.02   0.00   0.00     0.00  -0.81   0.00
    3   1     0.50  -0.29   0.00    -0.60   0.36   0.00     0.36  -0.19   0.00
    4   1    -0.50  -0.29   0.00    -0.60  -0.36   0.00    -0.36  -0.19   0.00
| Number | Form of vibration | Frequency/cm-1 | Intensity | Symmetry |
|---|---|---|---|---|
| 1 | 1144 | 93 | cell | |
| 2 | 1204 | 12 | cell | |
| 3 | 1204 | 12 | cell | |
| 4 | 2598 | 0 | cell | |
| 5 | 2737 | 104 | cell | |
| 6 | 2737 | 104 | cell |
The vibrations have an associated systematic error of ~10% i.e. ~300 cm-1 for the above frequencies. This is because we used a harmonic approximation for vibrations that are in fact anharmonic.
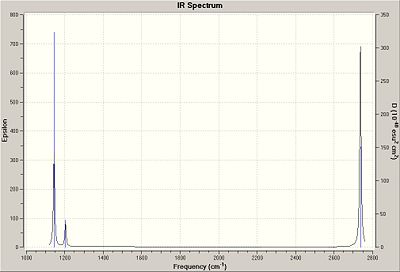
For a vibration to show up on a vibrational spectrum, the vibration must involve a net change in dipole moment of the molecule. The vibration labelled 4 in the table above does not result in a net change in dipole moment, and therefore at its corresponding frequency 2598 cm-1 the intensity is zero. Vibration pairs 2 & 3 and 5 and 6 both have the same respective frequencies and so they overlap. Thus, there are only three peaks in the vibrational spectrum.
BCl3
A molecule of BCl3 was created in GaussView 5.0.8c and the Inquire button was pressed to enter Inquire Mode (and prevent any accidental changes to the molecule). The symmetry was restricted by constraining the point group to D3H. The tolerance was increased to very tight (0.0001).
This molecule was then optimised in GaussView 5.0.8c with the following criteria:
- Method: B3LYP
- Basis Set: LanL2MB
- Type of Calculation: OPT - optimisation.
The file was saved as daniel_bcl3_opt.gjf and the calculation was submitted.
The Gaussian Output File DANIEL_BH3_OPT.LOG was then opened in Gaussian.
Geometrical information about the optimised BCl3 molecule was extracted using the Inquire button. All three B-Cl bonds were found to be 1.87 Å. All three Cl-B-Cl bond angles were found to be 120.0o.
A Summary of the results is tabulated below.
| heading | heading |
|---|---|
| File Name | DANIEL_BCL3_OPT |
| File Type | .log |
| Calculation Type | FOPT |
| Calculation Method | RB3LYP |
| Basis Set | LANL2MB |
| Charge | 0 |
| Spin | Singlet |
| Energy(RB3LYP)/a.u. | -69.44 |
| RMS Gradient Norm/a.u. | 0.00 |
| Dipole Moment/Debye | 0.00 |
| Point Group | D3H |
Job cpu time: 11 minutes 32 seconds
The gradient is close to zero (less than 0.001) suggesting the optimisation was successful.
The text based .log file was then opened in WordPad to check that the calculation did actually converge:
        Item               Value     Threshold  Converged?
Maximum Force            0.000039     0.000450     YES
RMS     Force            0.000025     0.000300     YES
Maximum Displacement     0.000168     0.001800     YES
RMS     Displacement     0.000110     0.001200     YES
Predicted change in Energy=-1.011430D-08
Optimization completed.
   -- Stationary point found.
                          ----------------------------
                          !   Optimized Parameters   !
                          ! (Angstroms and Degrees)  !
--------------------------                            --------------------------
! Name  Definition              Value          Derivative Info.                !
--------------------------------------------------------------------------------
! R1    R(1,2)                  1.8661         -DE/DX =    0.0                 !
! R2    R(1,3)                  1.8661         -DE/DX =    0.0                 !
! R3    R(1,4)                  1.8661         -DE/DX =    0.0                 !
! A1    A(2,1,3)              120.0            -DE/DX =    0.0                 !
! A2    A(2,1,4)              120.0            -DE/DX =    0.0                 !
! A3    A(3,1,4)              120.0            -DE/DX =    0.0                 !
! D1    D(2,1,4,3)            180.0            -DE/DX =    0.0                 !
--------------------------------------------------------------------------------
GradGradGradGradGradGradGradGradGradGradGradGradGradGradGradGradGradGrad
As can be seen above, the forces (gradient of an energy vs distance plot) have converged.


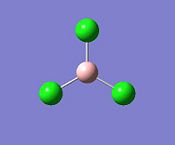
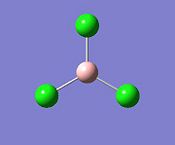
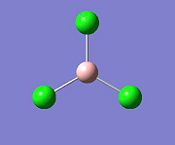
Comparing the two plots above with the table below, it is clear that 5 has the most negative (most stable) Total Energy. It also has the smallest gradient and hence the smallest forces acting on it, and hence 5 gives the best representation of the geometrically optimised BCl3.
| Step Number | 1 | 2 | 3 | 4 | 5 |
|---|---|---|---|---|---|
| Frame |  |
 |
 |
 |
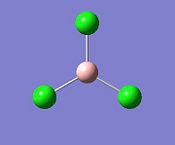 |
| B-H Bond Length/Å | 1.50000 | 1.59166 | 1.77497 | 1.88155 | 1.86610 |
A frequency analysis, using the same method and basis set, was carried out to ensure the new optimised structure did not have any significantly negative "zero" frequecies, and also that these frequencies were much smaller than the 3N frequencies reported. The frequency analysis confirmed that all of the frequency values were positive, and hence a minimum had been found since the frequency analysis is the second derivative of the potential energy surface. A negative frequency would represent a maximum (transition state).
The calculated Cl-B-Cl bond angle, 120.0o, is in good agreement with the litrature [1], 120.0o. The calculated B-Cl bond length, 1.87 Å, is also in good agreement with the literature [1], 1.75 Å.
This optimisation was carried out by approaching from the origin side of the equilibrium bond length. However, when structures were drawn in GaussView for long bonds (see BH3 above), GaussView sometimes did not draw in the bonds. This does not mean that there is no bond there, just that GaussView has a pre-determined list of bond-length limits, and if these are exceeded, GaussView will neglect to display the bonds. A chemical bond can be described as a mutual attraction between two or more atoms. Chemical bonds can include ionic (electrostatic), covalent, hydrogen bonds. All of these have a thermodynamic driving force, where a bonded system has a lower energy than the sum of the individual constituents.
One would expect the symmetry of BCl3 to be D3H. Gaussian also reports this symmetry. This suggests that the p-orbital is infact unoccupied.
Geometrical Isomers of Molybdenum Complex
A molecule of Mo(CO)4(PCl3)2 was created in GaussView 5.0.8c.
The cis- and trans-isomers were optimised in GaussView 5.0.8c with the following criteria:
Method: B3LYP Basis Set: LANL2MB Type of Calculation: OPT - optimisation. Additional Keywords - "opt=loose" The files were saved as daniel_cismolybdenum_opt_LANL2DZ.gjf and daniel_transmolybdenum_opt_LANL2DZ.gjf, respectively, and the calculations were submitted.
The Gaussian Output Files DANIEL_CISMOLYBDENUM_OPT_LANL2DZ.LOG and DANIEL_TRANSMOLYBDENUM_OPT_LANL2DZ.LOG were then opened in GaussView.
Comparison of Relative Energies
| File Name | DANIEL_CISMOLYBDENUM_OPT_LANL2DZ |
| File Type | .log |
| Calculation Type | FREQ |
| Calculation Method | RB3LYP |
| Basis Set | LANL2DZ |
| Energy(RB3LYP)/a.u. | -623.58 |
| RMS Gradient Norm/a.u. | 0.00 |
| Dipole Moment/Debye | 0.00 |
| Point Group | C1 |
Job cpu time: 31 minutes 46 seconds
| heading | heading |
|---|---|
| File Name | DANIEL_TRANSMOLYBDENUM_OPT_LANL2DZ |
| File Type | .log |
| Calculation Type | FOPT |
| Calculation Method | RB3LYP |
| Basis Set | LANL2DZ |
| Energy(RB3LYP)/a.u. | -623.58 |
| RMS Gradient Norm/a.u. | 0.00 |
| Dipole Moment/Debye | 0.30 |
| Point Group | C1 |
Job cpu time: 46 minutes 12.4 seconds
The calculated energies of the cis- and trans- isomer are the same, -1,637,200 kJmol-1. It could be concluded, therefore, that from a consideration of their energies, both molecules are equally stable. However, the cis-isomer has a dipole moment of 0.30, where as the trans-isomer has zero dipole moment. It could be concluded, therefore, that the cis-isomer would be more prevalent (i.e. more stable) in a polar medium, whereas the trans-isomer would be more prevalent in a non-polar medium.
The literature [2]reports that the trans-isomer of Mo(CO)4(PPh3)2 is the thermodynamically more stable isomer. This difference can be explained by the largely increased steric bulk of the substituents bonded to phosphorous.
Comparison of Carbonyl ligand Vibrational Frequencies
| Vibrational Frequency (calculated)/ cm-1 | Intensity | Vibrational Frequency (calculated)/ cm-1 | Symmetry C1 Point Group |
|---|---|---|---|
| 1946 | 764 | 1986 | B2 |
| 1949 | 1497 | 1994 | B1 |
| 1959 | 632 | 2004 | A1 |
| 2023 | 599 | 2072 | A1 |
The number of bands and vibration frequency values in the table above are in good agreement with the literature values [3]. The Gaussian calculation has a 10 % error associated with it, giving an error here of around 200 cm-1.
| Vibrational Frequency (calculated)/ cm-1 | Intensity | Vibrational Frequency (calculated)/ cm-1 | Symmetry C1 Point Group |
|---|---|---|---|
| 1950 | 1475 | 1941 | Eu |
| 1951 | 1467 | 1941 | Eu |
| 1977 | 1 | - | A1g |
| 2031 | 4 | - | A1g |
The first two bands in the above table are predicted by Gaussian, however, they are quite inaccurate. The error is still around 200 cm-1, but this does not account for the large differences. This could be a consequence of the limitations of the basis set used. Gaussian also predicts two further bands, albeit with very small intensities, whereas the literature [3] does not.
Mini-project
Cisplatin is a platinum-based chemotherapy drug used to treat various types of cancers, including sarcomas, carcinomas, lymphomas, and germ cell tumors. It was the first member of a class of anti-cancer drugs which now also includes carboplatin and oxaliplatin. It comes as no surprise then that cisplatin has been the subject of many experiments of recent times.
This mini-project will focus on the paper by Arturo Robertazzi and James A. Platts of Cardiff University, which is concerned with the prediction of some of the physical properties of cisplatin using computational methods.
Hydrogen Bonding, Solvation, and Hydrolysis of Cisplatin: A Theoretical Study
A systematic search of 1:1 cisplatin:water complexes was carried out, and only three stable minima were found. The cisplatin molecule has two hydrogen bond acceptors (the two chloro- substituents) and two hydrogen bond donors (the two ammine substituents). A water molecule can bind to these sites, forming stable and meta-stable complexes. Hydrogen bonding is known to play a major role in many properties affecting drug design and will have a direct impact on the pharmacokinetics of the drug.
Computational methods
The report uses a B3LYP method with a mixed basis set consisting of 6-31+G(d,p) on all light atoms and SDD on Pt. I the mini-project, SDD will be used on all atoms (as I do not know how to do otherwise!!). Although cisplatin itself has C2v symmetry, no symmetry constraints were applied to any H-bonded complexes.
Optimisation of 1:1 cisplatin:water complexes 1, 2, and 3
The three complexes 1,2 and 3 were created in GaussView 5.0.8c.
This molecule was initially optimised in GaussView 5.0.8c with the following criteria:
- Method: B3LYP - determines the types of approximations used when solving the Schrödinger equation.
- Basis Set: LANL2MB - determines the level of accuracy (3-21G has relatively low accuracy and is therefore relatively quick to run).
- Type of Calculation: OPT - optimisation.
The file was saved as daniel_mp_cisplatin1_b3lyplanl2mb_opt.gjf, daniel_mp_cisplatin2_b3lyplanl2mb_opt.gjf and daniel_mp_cisplatin3_b3lyplanl2mb_opt.gjf and the calculation was submitted.
The Gaussian Output File DANIEL_MP_CISPLATIN1_B3LYPLANL2MB_OPT.LOG, DANIEL_MP_CISPLATIN2_B3LYPLANL2MB_OPT.LOG AND DANIEL_MP_CISPLATIN3_B3LYPLANL2MB_OPT.LOG was then opened in Gaussian.
| Complex | Relative Energy/ kcalmol-1 | H-bonds | B...H/ Å | A...B/ Å | B...H-A/ o |
|---|---|---|---|---|---|
| 1 | 0.00 | N-H...O | 1.709 | 2.696 | 155.6 |
| O-H...Cl | 2.230 | 3.087 | 144.6 | ||
| 2 | 0.00 | N-H...O | 1.895 | 2.912 | 169.6 |
| N-H...O | 2.373 | 3.264 | 142.9 | ||
| 3 | 0.00 | O-H...Cl | 2.644 | 3.476 | 143.7 |
| O-H...Cl | 2.645 | 3.478 | 143.8 |
| Complex | Relative Energy/ kcalmol-1 | H-bonds | B...H/ Å | A...B/ Å | B...H-A/ o |
|---|---|---|---|---|---|
| 1 | 0.00 | N-H...O | 1.327 | 2.483 | 173.7 |
| O-H...Cl | 2.231 | 3.059 | 136.7 | ||
| 2 | - | N-H...O | - | - | - |
| N-H...O | - | - | - | ||
| 3 | +17.04 | O-H...Cl | 2.875 | 3.484 | 118.9 |
| O-H...Cl | 2.884 | 3.490 | 118.7 |
The basis set used above did not find a minima for complex 2 and so no values were reported.
| Complex | Relative Energy/ kcalmol-1 | H-bonds | B...H/ Å | A...B/ Å | B...H-A/ o |
|---|---|---|---|---|---|
| 1 | 0.00 | N-H...O | 1.728 | 2.731 | 158.5 |
| O-H...Cl | 2.255 | 3.120 | 145.1 | ||
| 2 | +0.94 | N-H...O | 2.150 | 2.941 | 132.1 |
| N-H...O | 2.149 | 2.940 | 132.2 | ||
| 3 | +6.94 | O-H...Cl | 2.662 | 3.506 | 144.4 |
| O-H...Cl | 2.668 | 3.511 | 144.2 |
This basis set was in much better agreement with the literature. This was to be expected seeing as a similar basis set was used in the literature.
The major discrepancy in results is for complex 2 where one of the N-H...O bonds is longer than in the literature. This mini-project predicts that both N-H...O bonds are of equal length. This may be due to the electron-density not being delocalised in this basis set. In SDD basis set, atoms are hard and not easily polarised.
- ↑ 1.0 1.1 L. G. Christophorou and J. K. Olthoff, J. Phys. Chem. Ref. Data, 2002, 31, 971 - 988 DOI:10.1063/1.1504440
- ↑ D. J. Darensbourg, Inorg. Chem., 1979, 18, 14 - 17 DOI:10.1021/ic50191a003
- ↑ 3.0 3.1 F. A. Cotton, Inorg. Chem., 1963, 3, 702 - 711 DOI:10.1021/ic50015a024
