
Rep:Mod:fyl10m1ha
Third Year Computational Lab Module 1
Ferdinand Fai Yang LOO (00641123)
Part 1: Techniques of molecular mechanics and semi-empirical molecular orbital methods for structural and spectroscopic evaluation
Hydrogenation of Cyclopentadiene Dimer
Cyclopentadiene dimerises and gives two isomers, the exo-isomer and the endo-isomer. To investigate the dimerisation of cyclopentadiene and the hydrogenation of the dimer, molecules 1-4 as shown in Figure 1 below were simulated using computational chemistry, and the corresponding selectivity in reaction of the molecule was discussed based on computed results and related to theory.

Figure 1: Molecules to be investigated in this exercise
Dimerisation of Cyclopentadiene
The molecules 1-2 were constructed in ChemBio3D, rectified, and the energy minimised.
- Software: ChemBio3D Ultra 12.0
- Force field: MM2
The minimisations of the molecules were summarised and tabulated: (all values have units of kcal/mol)
| Molecule Computed | Stretch | Bend | Stretch-bend | Torsion | Non-1,4 VDW | 1,4 VDW | Dipole/Dipole | Total Energy |
|---|---|---|---|---|---|---|---|---|
| Molecule 1: exo-dimer | 1.2850 | 20.5783 | -0.8382 | 7.6559 | -1.4167 | 4.2346 | 0.3775 | 31.8765 |
| Molecule 2: endo-dimer | 1.2519 | 20.8471 | -0.8360 | 9.5108 | -1.5433 | 4.3194 | 0.4476 | 33.9975 |
| Energy difference (molecule 1 - molecule 2) | 0.0331 | -0.2688 | -0.2710 | -1.8549 | 0.1226 | -0.0848 | -0.0701 | -2.1210 |
The dimerisation process proceeds via a Diel-Alder π4s+π2s cyclocddition: a C=C bond from one cyclopentadiene molecule (dienophile) attacks another molecule which has two C=C bonds in a cis-conformation (diene). This reaction gives rise to two isomers, the exo- and endo- dimers. This isomerisation is introduced when the cyclopentadiene acting as the dienophile has a different orientation (relative to the diene molecule) in the cycloaddition process, as shown in Figure 2 below:

Figure 2: Formation of isomers in the dimerisation of cyclopentadiene
The endo-isomer is the predominant product of the dimerisation process, as shown by Woodward and Hoffmann [1]. From the comparison table from above, the energies for molecules 1 and 2 were computed and it was shown that the exo-dimer is lower in energy for an amount of -2.1210 kcal/mol, confirming its higher thermodynamic stability. However, the kinetic endo-isomer is predominant in this dimerisation reaction, suggesting that the reaction is kinetically controlled. This can be explained by invoking the relative stabilities of the transition states of the molecules, as shown in Figure 3 below. From literature [1], it is explained that favourable secondary orbital interactions are present in the endo-isomer, which is due to the interaction of frontier orbitals of the diene and dienophile components, lowering the energy of the transition state, thereby favouring the endo-isomer to be formed predominantly.

Figure 3: Secondary orbital interactions for the exo-isomer and the endo-isomer
The exo-isomer is favoured due to a lower degree of steric congestion while the endo-isomer enjoys stabilisation due to orbital overlaps [2]. In this case, as seen from Figure 3 above, the exo-isomer comprises only two pairs of orbital interactions, while the endo-isomer benefits from four pairs of such interactions, leading to a lower energy (stabilised) transition state, and under kinetic control which is affected directly by the relative energies of transition states, the endo-isomer is predominantly formed. The thermodynamically more stable product is the exo-isomer, and as seen from this example, the higher energy endo-isomer is formed, showing this reaction is under kinetic control in which orbital interactions predominates, leading to the endo-isomer which has a lower energy transition state.
Hydrogenation of the Endo-Dimer 2
The product from dimerisation of cyclopentadiene, the predominantly formed endo-isomer, can undergo hydrogenation reaction to give two possible dihydro derivatives, the tetrahydro derivative is formed only after prolonged hydrogenation. The outline reactions scheme is shown below in Figure 4:

Figure 4: Reaction scheme of hydrogenation of predominantly formed endo dimer (2)
Again, using ChemBio3D and the MM2 force-field, the energies of molecules 3 and 4 are calculated and shown in the table below, values have the unit of kcal/mol:
| Molecule Computed | Stretch | Bend | Stretch-bend | Torsion | Non-1,4 VDW | 1,4 VDW | Dipole/Dipole | Total Energy |
|---|---|---|---|---|---|---|---|---|
| Molecule 3: first hydrogenated endo-dimer | 1.2771 | 19.8664 | -0.8346 | 10.8068 | -1.2257 | 5.6330 | 0.1621 | 35.6850 |
| Molecule 4: second hydeogenated endo-dimer | 1.0969 | 14.5233 | -0.5495 | 12.4979 | -1.0692 | 4.5120 | 0.1406 | 31.1520 |
| Energy difference (molecule 3 - molecule 4) | 0.1802 | 5.3431 | -0.2851 | -1.6911 | -1.8476 | 1.121 | 0.0215 | 4.533 |
As seen from the energy difference, molecule 4 is more stable by 4.533 kcal/mol. This is due to the significantly larger Bending energy of molecule 3. The energy difference in bending between the molecules has a value of 5.3431 kcal/mol, which on its own defines the energy difference between the two systems. This can be rationalised by considering the left-hand-side cyclopentene ring (as drawn in Figure 4), the presence of the C=C bond imposes a large strain on the molecule, contributing to the large value of the bending energy, while the other C=C bond is much less strained and has only a small bending energy (as seen from the table calculated). Hydrogenating the left-hand-side, more strained double bond removes the large bending term and leads to a larger stabilisation of the molecule as compared to removing the less strained C=C bond on the right-hand-side of the molecule. This leads to the conclusion that molecule 4 is thermodynamically more stable due to the greater reduction of ring strain. From literature [3] it is also shown that only molecule 4 is formed because the barrier to forming molecule 3 is so much higher that it is not formed in the reaction. The reaction is under kinetic control due to this great difference in energy barrier forming the products, and molecule 4 is also the thermodynamically preferred product. This rationalises the fact that the dihydro derivative is formed quickly but the tetrahydro derivative is not formed until prolonged hydrogenation is carried out, this is because the energy barrier for hydrogenating the right-hand-side C=C bond is very high and requires a long time to complete.
The MDL (.mol) files for the four molecules 1-4 are also included for reference:
- Molecule 1: exo-dimer
- Molecule 2: endo-dimer
- Molecule 3: first hydrogenated endo-dimer
- Molecule 4: second hydrogenated endo-dimer
Atropisomerism of an Intermediate in the Synthesis of Taxol
Optimisation of the isomers
In the total synthesis of Taxol the intermediate has a structure as illustrated in Figure 5, and it undergoes atropisomerism, which isomerises to the other carbonyl isomer on standing. The relative stability of the isomers are investigated in this part, this allows us to predict which isomer will be the actual (major) intermediate formed in the reaction.

Figure 5: Isomers of the intermediate in the synthesis of Taxol
To determine which isomer has the lower energy, the molecules were constructed in ChemBio3D, rectified and energy minimised, energies calculated are tabulated below and compared:
- Force field: MM2
Energies in the table below have units of kcal/mol.
| Molecule Computed | Stretch | Bend | Stretch-bend | Torsion | Non-1,4 VDW | 1,4 VDW | Dipole/Dipole | Total Energy |
|---|---|---|---|---|---|---|---|---|
| Molecule 9 | 2.6991 | 15.8898 | 0.4174 | 20.2997 | -1.3930 | 13.2882 | -1.6724 | 49.5289 |
| Molecule 10 | 2.6206 | 11.3496 | 0.3438 | 19.6627 | -2.1649 | 12.8735 | -2.0022 | 42.6830 |
| Energy difference (molecule 9 - molecule 10) | 0.0785 | 4.5402 | 0.0736 | 0.6370 | 0.7719 | 0.4147 | 0.3298 | 6.8459 |
The structure of the molecules computed can also be viewed via links below:
| Molecule Computed | MDL File Computed | |||
|---|---|---|---|---|
| Molecule 9 |
| |||
| Molecule 10 |
|
These alkenes react slowly, which is not expected by observation due to the ring strain caused by the C=C double bond (as seen in the previous part the presence of a C=C bond usually increases the strain of the ring when there is a bridge across it). This phenomenon can be explained by invoking the concept of a "hyperstable alkene" [4]. Due to the bridgehead location of the double bond, the alkenes are stabilized and should be thermodynamically more stable than any of their positional isomers, and are found to be remarkably unreactive. This hyperstability is in turn due to the angular strain caused by the bridgehead alkenes being smaller than the energy from trans-annular interactions of the corresponding saturated alkane. These low energy alkenes are not likely to react and the reactions are slow.
Upon minimisation of the molecule using the MM2 force field, it was observed that the geometry of the six-membered ring do not adopt a chair-conformation, the lower energy conformation of such structures. To modify this defect, we bear in mind that the lowest energy conformation of a cyclohexane ring is its chair-form (as opposed to the higher energy boat-form). To incorporate this aspect into the optimisation, the six carbon atoms were manually dragged to form a chair-like geometry and the MM2 optimisation was repeated until the expected chair-conformation was adopted after the minimisation calculation. This did in fact lead to a lower energy calculation.
Energy minimisation was also repeated using the MMFF94 force field, calculation results tabulated below.
| Force Field Used | Molecule 9 | Molecule 10 | Difference in energy (Molecule 9 - 10) |
|---|---|---|---|
| MM2 | 49.5289 | 42.6830 | 6.8459 |
| MMFF94 | 73.887 | 60.5699 | 13.3171 |
Energies have units of kcal/mol. The calculations basing on the two force fields yielded the same observation, that molecule 10 is of a lower energy than that of molecule 9. The values of energies yielded using the two force-fields for each molecule are different, however, due to the calculations were done basing on different force fields they are incomparable. This further calculation using the MMFF94 field confirms that molecule 10 is the lower energy isomer and is predicted to be the major intermediate found.
The MMFF94 optimised molecules are also linked for reference:
Hydrogenation of the hyperstable alkene
The verify the theory of the unusual stability caused by the alkene being at a bridgehead position which in turn leads to a high stability of the molecule, the hydrogenated product of the more stable isomer, molecule 10, is constructed in ChemBio3D and optimised using first the MM2 force field and then the MMFF94 force field. Results are tabulated as follows:
| Molecule Computed | MM2 Energy (kcal/mol) | MMFF94 Energy (kcal/mol) |
|---|---|---|
| Molecule 10 | 42.6830 | 60.5699 |
| Hydrogenated Molecule 10 | 49.3798 | 69.5404 |
| Energy difference (hydrogenated molecule 10 - molecule 10) | 6.6968 | 8.9705 |
As seen in the table above, the hydrogenated derivative of molecule 10 has a higher energy than the original molecule 10, which agrees with the prediction and theoretical explanation mentioned in the previous part. The MDL file of the MM2 and MMFF94 optimised hydrogenated molecule 10 can be found below for reference:
Regioselective Addition of Dichlorocarbene to a Diene
Optimisation of the molecule using MM2 and MOPAC and Comparison
From the previous parts a purely mechanical molecular model was used, and some aspects which the Molecular Mechanics approach cannot handle was examined. In this part the MOPAC method is incorporated to take into account the effect of electrons and their influence on bonds and derived spectroscopic properties of a molecule.
The molecule under consideration is shown below:

Figure 6: Structure of Molecule 12
The molecule reacts according to the scheme as shown below:

Figure 7: Reaction scheme of the electrophilic addition of CCl2 to Molecule 12
It is reported in literature [6] that the product shown in figure 7 above is the only one formed. Considering the two possible products, it can be seen that the endo-alkene in Molecule 12 (the one which lies on the side of the Cl atom) has a higher energy, hence it is more likely to donate electrons to the electrophile, the dichlorocarbene CCl2. The molecular orbital energies and shapes were simulated using computational chemistry.
The molecule was constructed in ChemBio3D and optimised using MM2, results as shown:
- Force-field: MM2
| Molecule computed | Stretch | Bend | Stretch-Bend | Torsion | Non-1,4 VDW | 1,4 VDW | Dipole/Dipole | Total Energy |
|---|---|---|---|---|---|---|---|---|
| Molecule 12 | 0.6189 | 4.7403 | 0.0401 | 7.6576 | -1.0685 | 5.7937 | 0.1123 | 17.8945 |
Energies reported have the unit of kcal/mol. To further optimise the compound by taking into account electronic effects, the MOPAC interface was used and results are shown below:
- Interface: MOPAC
- Method: RM1
| Molecule computed | Heat of Formation (kcal/mol) |
|---|---|
| Molecule 12 | 22.8275 |
The MDL files generated are included for reference:
The molecular structures optimised by MM2 and MOPAC had their geometries compared. The structures were placed in the same window in ChemBio3D and were overlaid. The distances between corresponding atoms in each geometry were tabulated:

Figure 7: Comparison of distances between corresponding atoms of differently optimised molecule 12
As seen from the table, the largest distance between the pairs was that of the C(12)-Cl(37) atoms, of 0.1167 angstrom. This reflects that the two models produced a slightly different geometry. The MOPAC calculation takes into account electronic contributions and hence led to a different geometry compared to that generated by the purely mechanical molecular MM2 force field. This showed that the geometry of the molecule is affected by electrons present in the molecule. The largest difference is observed at the Cl atom, possibly due to the large number of electrons it has, therefore contributing to a larger effect which is only considered in the MOPAC model.
MO Analysis of Molecule 12
As mentioned in the last part the alkenes have different energies, and it is observed that the more nucleophilic alkene is the endo-alkene which is the one closer to the Cl atom and predominantly reacts with the electrophilic dichlorocarbene to form the product shown in figure 7. To look into why this is the case, the Molecular Orbitals of the molecule were computed to observe the different energies of the two alkene bonds. To do this, an input file was created using ChemBio3D and the Gaussian interface was used.
- Method: DFT, B3LYP
- Basis set: 6-31G
- Properties: Molecular surfaces
The file was submitted to the HPC server and the .fchk was analysed in GaussView where the MO's under consideration were shown. The .fcuk file is uploaded to D-Space and the link can be found here [1].
The MO's HOMO-1, HOMO, LUMO, LUMO+1 and LUMO+2 were visualised in GaussView and their energies and images tabulated below.
| MO Computed | Energy of MO (eV) | Image of MO | Dufference in energy between MO and consequent MO (eV) |
|---|---|---|---|
| LUMO+2 | 0.03613 |  |
N/A |
| LUMO+1 | 0.0207 |  |
0.01543 |
| LUMO | 0.01556 |  |
0.00514 |
| HOMO | -0.23588 |  |
0.25144 |
| HOMO-1 | -0.24519 |  |
0.00931 |
From the MO's it can be seen that, the HOMO MO which is the most reactive MO towards electrophiles, i.e. the most willing to donate electron density, has electron density concentrated on the endo-alkene pi-bond. According to this observation, the HOMO is the most reactive in such a reaction, and electron density is donated from the endo pi-bond to the electrophilic dichlorocarbene, forming the product that is actually observed, this agrees with our theory. The endo pi-bond is involved in the HOMO possible because of the interaction of the antibonding Cl-C and the endo pi-bond, which directs electron density away from the pi-bond and increases the energy of the MO (a lower electron density refers to a higher energy in the MO theory). This orbital can be directly compared to the HOMO-1, where this interaction is between the C-H antibonding orbital and the exo pi-bond. This interaction is weaker and the degree of electron directing away from the exo pi-bond is smaller, therefore the energy of the HOMO-1 orbital which has its electron density concentrated on the exo pi-bond is lower in energy than the HOMO as observed. It can also be seen from the energy difference comparison that the energy gap between the HOMO and the LUMO is very large compared to the other values, as a result of the pi-bond on the carbon atoms becoming antibonding starting from the LUMO orbital onwards.
The molecular orbitals were also observed and compared to the symmetry of the molecule. The molecular is symmetrical in the sense that it possesses a C2 symmetry axis across the molecule, horizontally dissecting the molecule into two equal parts. The electronic distribution, as observed from the colour and the shapes of the lobes of electron density, reflects the symmetry of the molecule in all these five MO's except for the LUMO+2 orbital, in which the coloured lobes are alternately aligned. This corresponds to a totally antibonding alignment of the orbitals present and thus leads to a higher energy of the orbital.
For reference, the .cml file were included and linked below:
- Chemical markup language file:
Pentahelicene |
- .out file:
Vibration |
IR Analysis of Molecule 12
The output IR file can be found here at [2].
The vibrations were analysed with GaussView and tabulated as follows:
| Vibration mode | Frequency (cm-1) | Infrared absorption | Form of motion | Animated image |
|---|---|---|---|---|
| #18 | 689.48 | 53.3597 | Symmetric wagging of C-H bonds | 
|
| #19 | 770.93 | 25.0970 | Symmetric wagging of C-H bonds and stretching of C-Cl bond | 
|
| #59 | 3009.69 | 100.7127 | Asymmetric stretching of C-H bonds | 
|
| #63 | 3033.68 | 62.6308 | Asymmetric stretching of C-H bonds | 
|
The most intense vibrations are tabulated and their form of motion described. The frequency of absorption reflects the wavenumber, and hence the energy of the vibration, i.e. a higher energy vibration has a larger wavenumber. The intensity on the other hand, depends on selectrion rules of the transition. Typically the more "formally allowed" the transition is, the larger the intensity of the vibration.
Monosaccharide Chemistry and the Mechanism of Glycosidation
MM2 and MOPAC/MP6 Calculation Results Analysis
The glycosidation reaction is studied using computational chemistry analysis. Different stereoisomers of a sugar will in fact lead to a different intermediate and hence a different product resulting from a nucleophilic attack. This reaction involves the participation of a neighbouring group, the -OAc group, which the Oxygen atom donates its lone pair electron density to stabilise the positive charge on the intermediates A as labelled in the summary reaction scheme below. The resulting intermediate B, with different orientations of which the neighbouring -OAc bonds to the carbon atom open to nucleophilic attack, have different sites prone to attack of the incoming nucleophile, and therefore, resulting in either an alpha-anomer or a beta-anomer. An alpha-anomer is one which the Nu in the final product is in the same orientation as the opposite group, in this case, if we consider the Nu-C carbon is labelled 1, the -OMe group at the 4 position. A beta-anomer, on the other hand, is one which the C-Nu and the -OMe at the 4-position is in a different orientation (one is axial and the other equatorial). The reaction scheme and stereoselectivity of the product is shown in figure 8 below:

Figure 8: Reaction summary of the glycosidation forming intermediates A and B of isomeric molecules
There are four possible diastereoisomers for this reaction, determined by the stereochemistry of the acetal group in the intermediate A (leading to two diastereoisomeric products), and the orientation of the Oxygen atom (of the Ac group on the -OAc part) which leads to two different orientations of attacking the oxenium carbon forming intermediate B (this gives rise to another two diastereoisomeric products). To assess which of these products are the more favourable to be formed, we look into the energy of intermediates A and B of these stereoisomers. MM2 and MOPAC/PM6 Calculations were done for the stereoisomers. Results were tabulated, energies have units of Kcal/mol, energies for intermediates A are shown below:
| Orientation of -OAc group, orientation of carbonyl oxygen in -OAc group | Stretch | Bend | Stretch-Bend | Torsion | Non-1,4 VDW | 1,4 VDW | Charge/Dipole | Dipole/Dipole | MM2 Total Energy | MM2 Difference | MOPAC/MP6 Energy: Heat of Formation | MOPAC Difference |
|---|---|---|---|---|---|---|---|---|---|---|---|---|
| 1a. Axial, down | 2.5242 | 11.7001 | 0.9854 | 0.8829 | 1.0929 | 18.7573 | -31.3329 | 8.7609 | 13.3709 | -12.9196 | -91.65716 | +0.00585 |
| 2a. Equatorial, down | 2.4861 | 7.9395 | 0.8553 | 1.7123 | -1.7969 | 19.1566 | -10.1607 | 6.0983 | 26.2905 | +12.9196 | -91.66301 | -0.00585 |
| 3a. Axial, up | 2.6350 | 11.6564 | 1.0284 | 1.3129 | 1.8171 | 18.5852 | -27.9642 | 7.8645 | 16.9355 | -7.6482 | -91.65102 | -14.14118 |
| 4a. Equatorial, up | 2.4010 | 10.1704 | 0.8644 | 3.4648 | -1.3444 | 19.4693 | -15.0079 | 4.5662 | 24.5837 | +7.6482 | -77.50984 | +14.14118 |
According to literature [7], the major reaction pathways are the axial, down and the axial, up routes. These routes both yield the beta-anomer, and go through the intermediates B in which the carbonyl oxygen in the -OAc group points towards the oxenium carbon in the corresponding intermediates A, and are clearly more favourable to be formed, as compared to the ones with the carbonyl oxygen pointing away from the oxenium carbon, as it will be much harder for the C and O atoms to interact when they are far away in the equatorial stereoisomers. It can also be seen from the MM2 energies computed, which both axial stereoisomers have a lower energy (more negative energy) and hence are more favourable to be formed. The MOPAC/PM6 energy difference for the stereoisomers 1A and 1B are roughly the same (this should be a calculation error, as 1a and 1b should have different heat of formations due to their different energies), but that for 3A and 4A showed a large difference of 14.14118 Kcal/mol, in the favour of forming the more stable 3A intermediate. To further confirm this argument, the energies of intermediates B of the corresponding intermediate A precursors are also computed using the MM2 and MOPAC/PM6 force-fields. Energies are tabulated below, and have units of kcal/mol:
| Orientation of -OAc group, orientation of carbonyl oxygen in -OAc group | Stretch | Bend | Stretch-Bend | Torsion | Non-1,4 VDW | 1,4 VDW | Charge/Dipole | Dipole/Dipole | MM2 Total Energy | MM2 Difference | MOPAC/MP6 Energy: Heat of Formation | MOPAC Difference |
|---|---|---|---|---|---|---|---|---|---|---|---|---|
| 1b. Axial, down | 1.7653 | 15.2638 | 0.7084 | 7.1457 | -3.4393 | 17.6909 | -5.6212 | 0.0733 | 33.5869 | -10.0783 | -91.66143 | -37.88942 |
| 2b. Equatorial, down | 2.6930 | 17.4101 | 0.7897 | 8.2084 | -2.5175 | 19.4293 | -0.6080 | -1.7399 | 43.6652 | +10.0783 | -63.85031 | +37.88942 |
| 3b. Axial, up | 1.9170 | 12.9761 | 0.6552 | 8.4104 | -2.7080 | 17.9846 | -10.2376 | -2.6860 | 26.3117 | -17.3536 | -91.65769 | -24.80144 |
| 4b. Equatorial, up | 2.6928 | 17.4173 | 0.7891 | 8.2052 | -2.5114 | 19.4302 | -0.6180 | -1.7399 | 43.6653 | +17.3536 | -66.85625 | +24.80144 |
Comparison of MM2 and MOPAC/MP6 energies of B intermediates have also shown the favourable intermediates are the axial stereoisomers, by the analogy that the more negative energy bearing isomers are the more stable and the reaction paths are more favourable. This is in good agreement with the literature trends recorded and the prediction of the stereochemical preference of this glycosidation is consistent with the literature reported preference. It is also observed that 1B and 3B have very similar heat of formation values with that of 1A and 3A (2A heat of formation is considered to be a calculation error).
Bond Length Comparison of Intermediates Calculated
After the calculations were completed bond lengths and bond angles of intermediates were also compared between each set of intermediates (for each equatorial and axial pair). After having discussed the relatively more stable stereoisomer is always the axial isomer, the bond lengths and angles between these pairs were also discussed below.
For intermediates A, the bond lengths are measured and tabulated below:
| Quantity Calculated | 1a. Axial, down | 2a. Equatorial, down | 3a. Axial, up | 4a, Equatorial, up |
|---|---|---|---|---|
| Bond Length |  |
 |
 |

|
As can be seen in the tables, the bond lengths are very similiar in each case, even between pairs of equatorial and axial isomers. This is consistent with theoretical prediction, as the OAc groups have not yet interacted with the oxenium carbon and are therefore not really different in lengths of bonds. As we look into the bond lengths of the intermediates B, we expect to see a more significant difference between the C-O bond formed, where we expect to see longer C-O bonds (the one newly formed in the formation of intermediate B) in equatorial derivatives, due to a longer distance between the OAc carbonyl oxygen donating the lone pair, and the oxenium carbon atom receiving the lone pair donation from the oxygen mentioned. The bond lengths in intermediates B are tabulated as well:
| Quantity Calculated | 1b. Axial, down | 2b. Equatorial, down | 3b. Axial, up | 4b, Equatorial, up |
|---|---|---|---|---|
| Bond Length |  |
 |
 |

|
As observed from the table, the significantly different bond length between each pair of equatorial and axial isomers is labelled black. The equatorial isomers have a significantly longer bond length of the bond concerned, which is consistent with theory, as the distance between the interacting OAc oxygen and the oxenium carbon are longer in these intermediates, resulting in a longer bond length in the equatorial cases. However, the O and C atoms with a difference in bond length are in fact not the ones as predicted, but are found to be the C-O bond next to the expected bond. This can be due to the optimisation of the ChemBio3D program, which modifies lengths of adjacent C-O bonds to account for the large distance in the interaction in equatorial derivatives. The bond lengths were also compared but the differences are very small, and not as significant and noticeable as that for bond lengths. Comparison of bond lengths are in agreement with that predicted in theory, that the equatorial interactions are harder and require more energy, and this is reflected by the longer (and therefore weaker) bonds formed which are observed in intermediate B.
Supportive Files
For reference, the MDL files of the MM2, MOPAC/MP6 optimisations are displayed below:
MDL for Intermediates A:
| Method of calculation | 1a. Axial, down | 2a. Equatorial, down | 3a. Axial, up | 4a, Equatorial, up | ||||||||||||
|---|---|---|---|---|---|---|---|---|---|---|---|---|---|---|---|---|
| MM2 |
|
|
|
| ||||||||||||
| MOPAC/MP6 |
|
|
|
|
MDL for Intermediates B:
| Method of calculation | 1b. Axial, down | 2b. Equatorial, down | 3b. Axial, up | 4b, Equatorial, up | ||||||||||||
|---|---|---|---|---|---|---|---|---|---|---|---|---|---|---|---|---|
| MM2 |
|
|
|
| ||||||||||||
| MOPAC/MP6 |
|
|
|
|
Part 2: Mini-Project -Simulation of spectroscopic data for a literature molecule
Spectroscopy of an Intermediate Related to the Synthesis of Taxol
To take the analysis of isomers 9 and 10 one step further, their derivatives, molecules 17 and 18, which are also isomers are also analysed. One of the isomers, molecule 18 was constructed in ChemDraw, exported to ChemBio3D and minimised on the HPC server (due to the large size of the molecule and heavier atoms such as S). The proton and 13C NMR spectra of the compound was also calculated using computational chemistry methods and compared to that reported in literature. The structure of the molecule is shown in the figure below:

Figure 9: Structures of molecules 17 and 18
The geometry of the molecule was optimised to the density functional DFT level, job details are shown:
- Job type: Minimise
- Method: DFT/B3LYP
- Basis set: 6-31G, d,p polarisation
- Solvation model: CPCM/ chloroform
- First line of .gjf file after correction: # RB3LYP/6-31G(d,p) Opt SCRF=(CPCM,Solvent=chloroform)
The calculation was submitted to the HPC server and the results were uploaded to D-Space, the link can be found here at [3]. The .fchk file of the optimisation was then retrieved and set as another input file:
- First line of .gjf file after optimisation: # mpw1pw91/6-31G(d,p) NMR SCRF=(CPCM,Solvent=chloroform)
This job was submitted to HPC again and the result file can be found here at [4]. The chemical shifts calculated using these input files were then tabulated and compared to literature data [5].
- Comparison of 13C data with literature:
| 13C NMR Spectrum | Image | |
|---|---|---|
| Comparison of values and labelling of C atoms |  |
|
| Spectrum calculated (.svg) | 
|
- Comparison of 1H data with literature:
| 1H NMR Spectrum | Image |
|---|---|
| Comparison of values | 
|
| Labelling of H atoms | 
|
| Spectrum Calculated (.svg) | 
|
Upon comparison of calculated values with literature, all the chemical shifts resemble reasonably closely of those reported in literature, except for the carbon atom labelled 14 which has a difference of 15.12 ppm. The difference in ppm for other atoms lie within a value of 5 ppm, but they all follow the same trend. This carbon atom is connected to two S atoms, this might be the cause of the anomalous result yielded. During the optimisation of the molecule, in light of the work on molecule 10, the geometry of the cyclohexane six-membered ring was tilted for a better optimisation. The larger number of electrons that S has may be a contributing factor to this anomaly, and so can be the mismatch of the solvation system set for the optimisation and calculation. Another calculation was repeated using C6H6 (the one used in the literature source), but the results yielded were very similar and there was barely any improvement on the 15.12 ppm difference. As for the 1H NMR, the chemical shifts and number of signals calculated match more closely to that reported in literature, with the largest difference being 0.86 ppm for proton 26. Comparison has shown that the calculated values agree quite closely to that reported in literature, with the only significant anomalous piece of data being that of the 24th C in the 13C NMR. Possible reasons were suggested but it is unknown that which is in fact the main factor contributing to this difference.
Investigation of Literature Molecule
The isomeric molecules of choice are shown below:

Figure 10: Diastereomeric molecules chosen from literature
These are diastereoisomeric products from the intermediate, labelled 8-alpha, a brief reaction scheme is shown below:

Figure 11: Brief reaction scheme for formation of the isomeric molecules under consideration
The literature publication in which the molecule and its characterisation data are found from can be found here:
- [Reference 8] V. D. Bussolo, L. Favero, M. R. Romano, M. Pineschi, P. Crotti. Tetrahedron 64 (2008) 8188–8201
This molecule was chosen because it is a small molecule based on a six-membered ring which is not very conformationally flexible either, i.e. it does not contain alkane chains or many single bonds which can rotate freely and result in a large number of isomers. The molecule is also sufficiently small enough so that calculations will not take a long time and assignment and analysis of spectra will not be too bulky and time-consuming. There are also no heavy or TM atoms in the molecule which makes computational calculations simpler. The experimental section of the literature reporting this structure also includes the 13C NMR and 1H NMR assignments for the molecules so analysis carried out can be compared to literature data and be accounted for any difference. Spectroscopic data of this pair of isomeric molecules labelled as 9-alpha and 9-beta was calculated and discussed in the sections below.
To differentiate between the isomers, NMR, IR, CD and Optical Rotation were computed to observe any differences between the yielded results. From theoretical prediction, NMR will be pretty much the same, as the isomers are just different in the stereochemistry of a -OMe bond, which will not significantly affect the chemical shifts of nearby atoms. The optical rotation should be a method able of differentiating between the two isomers, as they are diastereoisomers and should have a different magnitude of optical rotation. These spectroscopic properties are calculated and discussed.
13C NMR and 1H NMR Spectra
The molecules were constructed in ChemBio3D and initially optimised under the MM2 force field. A further optimisation was then carried out:
- Method: DFT/mpw1pw91
- Basis set: 6-31G(d,p)
The file was submitted to HPC and uploaded to D-Space, link can be found:
- Here [5] for 9-alpha;
- And here [6] for 9-beta.
After this refined optimisation an input file for NMR calculation was produced using Gaussian:
- Method and basis set: mpw1pw91/6-31(d,p)
- Calculation: NMR
- Solvation: CPCM/chloroform (as reported in literature)
The completed NMR files were uploaded to D-Space and can be found:
- Here [7] for 9-alpha NMR;
- And here [8] for 9-beta NMR.
The calculated NMR results were compared to that found in literature.
- For 13C NMR spectra:
| 13C NMR Spectrum | 9-alpha isomer |
|---|---|
| Comparison of values | 
|
| Spectrum calculated (.svg) | 
|
| 13C NMR Spectrum | 9-beta isomer |
|---|---|
| Comparison of values | 
|
| Spectrum calculated (.svg) | 
|
- For 1H NMR Spectra:
| 1H NMR Spectrum | 9-alpha isomer |
|---|---|
| Comparison of values | 
|
| Spectrum calculated (.svg) | 
|
| 1H NMR Spectrum | 9-beta isomer |
|---|---|
| Comparison of values | 
|
| Spectrum calculated (.svg) | 
|
- Labelling of atoms for 1H and 13C spectra:
| Molecule analysed | 9-alpha isomer | 9-beta isomer |
|---|---|---|
| Atom labelling image |  |

|
The 13-C NMR of the 9-alpha isomer showed a reasonable agreement with literature data, the largest deviation being 4.96 ppm. However, for the 13-C NMR of 9-beta, there are 4 readings differing from literature data for about 10 ppm, and the largest deviation has a value of 15.81 ppm, which suggests either the calculation was invalid or the literature data assigned was problematic. This is probably due to the imperfect simulation, as it can be observed from the image taken above (in the Atom labelling image for 9-beta) that the shape of the molecule is slightly off from what is expected, i.e. the right hand side -OMe group should point out of the plane towards the viewer while that observed lies on the plane. The same calculation was repeated using a newly generated and optimised molecule of 9-beta but the same problem occurred and there was insufficient time to redo it, so we decided to stick with this set of value. Upon observation of the NMR spectra it could also be seen that even though the isomers seem to be structurally similar, the NMR spectra yielded are very different. This is due to the different magnetic environments caused by the different orientation of the -OMe bond and since the other groups are not conformationally flexible, this poses an effect on the atoms within the vicinity of the -OMe group and gives rise to two totally different spectra. The 9-beta isomer being not very ideally optimised can also be due to the fact that the actual configuration of the isomer is not energetically very favourable, leading to the optimising program modifying its geometry to obtain a lower energy. This can be due to the use of an imperfect basis set or force field for the optimisation, which does not perfectly suit the properties of the molecule so as to produce idealistic optimisation results.
However, looking at the 1H NMR spectra, the calculated and literature reported values were generally of a high degree of consistency, having very small deviations.
nJH-H Couplings of Compound
The optimised molecules were used to create input files for computing the J H-H couplings present in the compounds, and the files were uploaded to D-Space and can be found:
- Here for 9-alpha isomer couplings: [9];
- And here for 9-beta isomer couplings: [10].
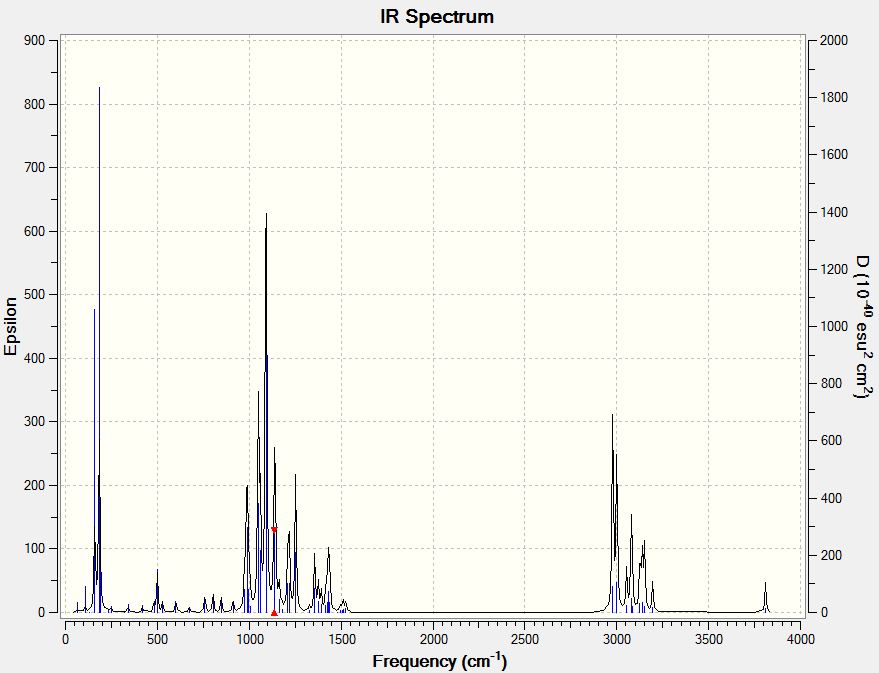
IR Spectrum
Using the optimised molecule an output file with the following keywords was generated and submitted to HPC:
- b3lyp/6-31G(d,p) opt freq
The resulting output files can be found below:
- 9-alpha: [11].
- 9-beta: [12].
- Gibbs Free Energy of the Isomers
From the Output File of the IR calculation, the Gibb's free energy, ΔG can be located and this value for the two isomers can be compared:
| Isomer | Delta G (Hartree) | Difference (Hartree) | Difference (kcal/mol) |
|---|---|---|---|
| 9-alpha | -499.408260 | +0.00146 | +0.91615 |
| 9-beta | -499.409720 | -0.00146 | -0.91615 |
(1 Hartree = 627.5 kcal/mol)
It can be seen that, in fact the Gibbs free energy for the two isomers are very similar, having a difference of only 0.91615 kcal/mol, which is very small compared to the overall molecular energy.
- Vibrational Spectra Analysis
Using the .fchk file after IR Analysis, the vibrations of the molecule can be studied. Some of the more dominating vibrations are tabulated and described:
For the 9-alpha isomer:
| Vibration mode | Frequency (cm-1) | Infrared absorption | Form of motion | Animated image |
|---|---|---|---|---|
| #5 | 183.49 | 84.4084 | Wagging of O-H bond and O-CH3 bond in different direction | 
|
| #25 | 1048.87 | 100.2813 | Stretching of C-C bond and swinging of C-H bonds | 
|
| #27 | 1091.33 | 251.5462 | Asymmetric stretching of the two C-O bonds (the same C atom) and wagging of C-H bonds | 
|
| #29 | 1140.05 | 81.5470 | Symmetric stretching of the two C-O bonds (the same C atom) and wagging of C-H bonds | 
|
For the 9-beta isomer:
| Vibration mode | Frequency (cm-1) | Infrared absorption | Form of motion | Animated image |
|---|---|---|---|---|
| #11 | 444.37 | 72.0276 | Wagging of O-H bond | 
|
| #27 | 1079.93 | 146.3101 | Stretching of C-O bonds in opposite directions and swinging of C-H bonds | 
|
| #29 | 1145.41 | 108.7528 | Swinging of C-H bonds | 
|
| #42 | 1439.97 | 65.2760 | Scissoring of a pair of C-H bonds and wagging of another pair of C-H | 
|
It can be seen that the most significantly different vibration between the two isomers is the first one tabulated in each table, the #5 for 9-alpha and the #11 for 9-beta. The 9-beta #11 vibration however, has a much higher frequency, but it has essentially a very similar mode of vibration with that of the 9-alpha #5 vibration. The vibrations with the strongest intensities were tabulated and their mode of motion described. The calculated IR spectra are also included and linked here:
Optical Rotation (OR) and Circular Dichroism (CD) Spectrum
- Optical Rotation
OR analysis was computed using input file created using the optimised molecule. Optical rotation for isomers recorded below:
| Isomer | Optical rotation calculated |
|---|---|
| 9-alpha | +36.35 degrees |
| 9-beta | +72.61 degrees |
The output file was uploaded to D-Space and can be found here:
- 9-alpha: [13].
- 9-beta: [14]
The optical rotational properties of the two isomers were found to be different, which is expected according to theory. Enantiomers, which are mirror images of each other, are expected to give equal magnitude but different direction (as reflected by + or - signs) of optical rotational measurements. However, in this case, the molecules 9-alpha and 9-beta are not enantiomers. There are a total of three chiral centres in these molecules, it will be enantiomeric only if the isomers have the opposite geometry at all three chiral centres. In this case, they have the opposite geometry only in one of the three chiral carbons and are therefore only diastereoisomers, which are expected to have different chemical properties and also different measurements of optical rotation.
- Circular Dichroism Spectra of the Isomers
The CD analysis was carried out in a similar manner, and results are tabulated as follows:
| 9-alpha isomer | Absorptions /nm | Rvel /10-40esu2cm2 |
|---|---|---|
| Absorption 1 | 183.02 | 32.0384 |
| Absorption 2 | 165.87 | 49.4491 |
| Absorption 3 | 151.73 | 14.9167 |
| Absorption 4 | 139.39 | 44.6626 |
| Absorption 5 | 130.36 | -18.4879 |
Resulting output files uploaded to D-Space and can be found here:
- 9-alpha: [15].
- 9-beta: [16].
Spectrum for 9-alpha CD:

| 9-beta isomer | Absorptions /nm | Rvel /10-40esu2cm2 |
|---|---|---|
| Absorption 1 | 213.37 | -22.7801 |
| Absorption 2 | 187.54 | 77.5179 |
| Absorption 3 | 159.03 | -63.1867 |
| Absorption 4 | 137.06 | -16.6487 |
Spectrum for 9-beta CD:

- UV-Vis Spectra of the Isomers
The UV-Vis spectra of the isomers have the similar shape, and a slightly different wavelength of max absorption. Results are summarised and tabulated as follows:
| Isomer | Absorption /nm | Oscillator strength (intensity of absorption) |
|---|---|---|
| 9-alpha | 171.43 | 0.1725 |
| 9-alpha | 132.72 | 0.0109 |
| 9-beta | 187.54 | 0.2135 |
| 9-beta | 144.01 | 0.0237 |
Upon comparison, the 9-alpha isomer absorbs UV-Vis radiation at slightly lower wavelengths compared to the 9-beta isomer. Also the absorption intensities of the 9-alpha isomer are a bit weaker compared to the 9-beta isomer.
Conclusion and Mechanistic Discussions
From literature [8] it was recorded that the selectivity of the 9-alpha product to that of the 9-beta product is 85:15, which the predominant product is the alpha-isomer. The mechanism of the reaction was discussed in the literature, and in this specific case, it is as shown as below:

Figure 12: Reaction mechanism forming the predominant 9-alpha isomer
As shown the 9-alpha is formed predominantly by the attack of the R-group (in this case, the methyl group) on the open-face of the double bond. The stereoselectivity of the reaction can be enhanced by using a more bulky substituent, to substitute the Me group on the top face blocking the attack of the R group, forcing it to attack from the bottom face. However, through the computational calculations undertaken, this stereoselectivity is not rationalised by invoking the calculations. The NMR spectra for both isomers are closely related according to literature [8]. The IR, shows a higher frequency for the O-H bond wagging vibration for the 9-beta than that of the 9-alpha isomer as the most significant difference between the two spectra. The Gibbs free energies of the two isomers are also retrieved from the calculation, and are in fact found to be very close to each other. As for the optical rotation, the two isomers which are diasteromerically related, have different and incomparable magnitudes for their optical rotation. Among these data, only IR and OR showed a large enough difference between the two isomers and these can be used in the future to identify which isomer is actually formed in the reaction. However, these spectroscopic examinations do not fully explain the preference for the alpha-product over the beta-isomer, as they have almost identical energies. The preference is explained instead by invoking the mechanism for the reaction via the intermediate 8-alpha species, which favours forming the 9-alpha isomer and this was discussed as well.
References
[1] Jerry March, Advanced organic chemistry, 4th edition, John Wiley & sons, New York, 1992.
[2] A Guidebook to Mechanism in Organic Chemistry, 6th Edition, Peter Sykes, Pearson Prentice Hall, 1986.
[3] J. Phys. Chem. A, 2010, 114 (11), pp 3811–3817
[4] W. F. Maier, P. RaguC Schleyer. J. Am. Chem. Soc., Vol. 103, No. 8, 1981.
[5] L. A. Paquette, N. A. Pegg, D. Toops, G. D. Maynard, R. D. Rogers. J. Am. Chem. Soc., 1990, 112 (1), pp 277-283
[6] B. Halton, S. G. G. Russell. J. Org. Chem., 1991, 56 (19), pp 5553-5556
[7] D. M. Whitfield, T. Nukada, Carbohydr. Res., 2007, 342, 1291
[8] V. D. Bussolo, L. Favero, M. R. Romano, M. Pineschi, P. Crotti. Tetrahedron 64 (2008) 8188–8201