Rep:Mod:fs1309module 2
3rd year computational lab Module 2 Bonding (Ab initio and density functional molecular orbital)
Inorganic CompChem Experiments
Part 1
1) Analyzing the optimized BH3 molecules
| B-H bond length | 1.19Å |
|---|---|
| H-B-H bond angle | 120.0° |
| File Type | .log |
| Calculation Type | FOPT |
| Calculation method | RB3LYP |
| Basis set | 3-21G |
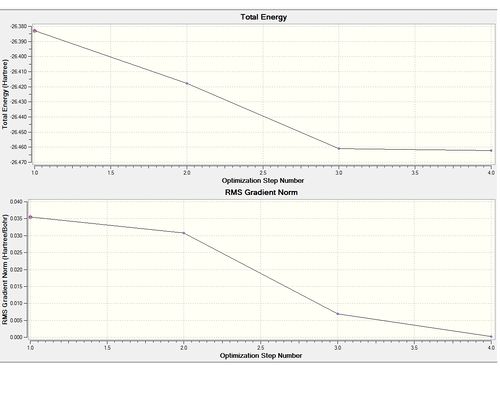
| Final energy | -26.46226338 a.u. |
| Gradient | 0.00020672 a.u. |
| Dipole moment | 0.0000 |
| Point group | D3h |
| Time taken | 7 seconds |
          Item               Value     Threshold  Converged?
Maximum Force            0.000413     0.000450     YES
RMS     Force            0.000271     0.000300     YES
Maximum Displacement     0.001610     0.001800     YES
RMS     Displacement     0.001054     0.001200     YES
Predicted change in Energy=-1.071764D-06
Optimization completed.
   -- Stationary point found.
                          ----------------------------
                          !   Optimized Parameters   !
                          ! (Angstroms and Degrees)  !
--------------------------                            --------------------------
! Name  Definition              Value          Derivative Info.                !
--------------------------------------------------------------------------------
! R1    R(1,2)                  1.1935         -DE/DX =    0.0004              !
! R2    R(1,3)                  1.1935         -DE/DX =    0.0004              !
! R3    R(1,4)                  1.1935         -DE/DX =    0.0004              !
! A1    A(2,1,3)              120.0            -DE/DX =    0.0                 !
! A2    A(2,1,4)              120.0            -DE/DX =    0.0                 !
! A3    A(3,1,4)              120.0            -DE/DX =    0.0                 !
! D1    D(2,1,4,3)            180.0            -DE/DX =    0.0                 !
--------------------------------------------------------------------------------
GradGradGradGradGradGradGradGradGradGradGradGradGradGradGradGradGradGrad
2) Animating the vibrations
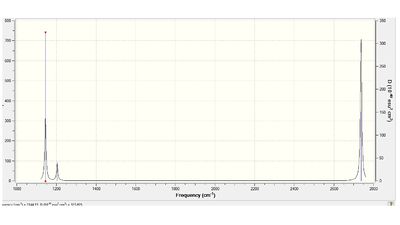
IR spectrum of BH3
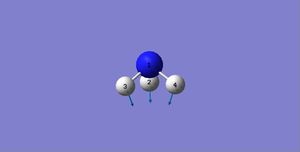
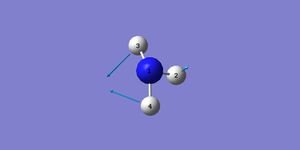
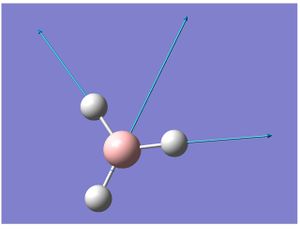
The Infra Red spectroscopy origins from the change in dipole moment of the molecule due to vibrational motions, but as not all the vibrational modes are IR active, or some peaks can overlap as their overall changes in dipole moment are the same, the number of peaks shown on the spectra may not be equal to the number of vibrations. The reason why there are only 3 peaks instead of 6 appearing on the spectra here are: 1) The changes in overall dipole moment due to stretches modes 1 and 2 are the same, therefore these two peaks will overlap and result in only one peak shown on the spectra. The same reason applies to stretches 5 and 6, resulting in 1 peak on spectra. 2)BH3 is a highly symmetric molecule therefore the vibrational mode at 2598.42cm -1, which involves 3 stretches pointing from the B to H, such symmetric stretches result in no change in overall dipole moment and therefore no vibrational signal can be observed.
3) The MO diagram of BH3

Link to D-space: http://hdl.handle.net/10042/to-9939
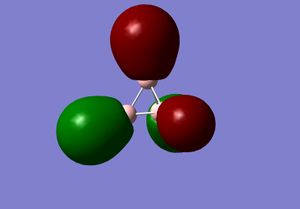
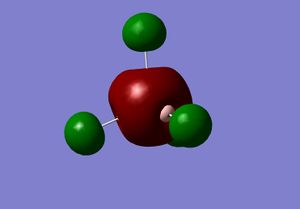
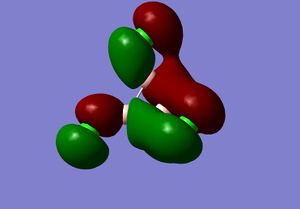
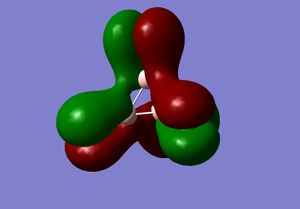
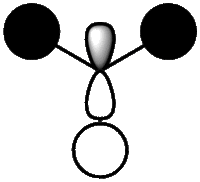
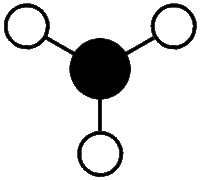
Comparison with the 'real' MOs with LCAO MOs
| No. of orbitals | Real MOs | LCAO MOs |
|---|---|---|
| 1 | 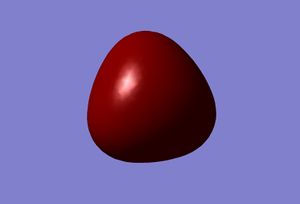 |
 |
| 2 | 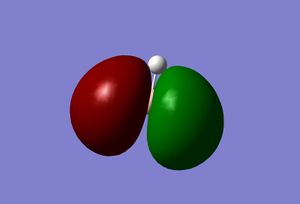 |
 |
| 3 | 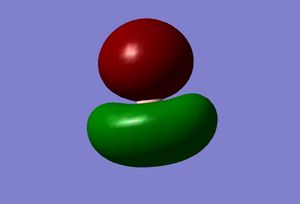 |
 |
| 4 |  |
 |
| 5 | 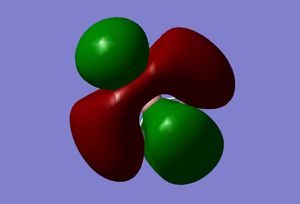 |
 |
| 6 | 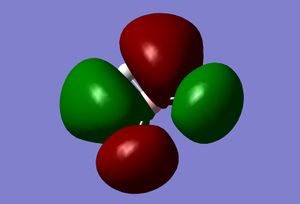 |
 |
| 7 | 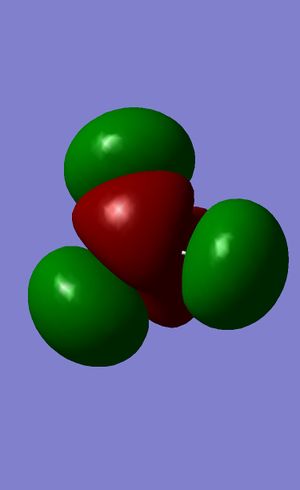 |
 |
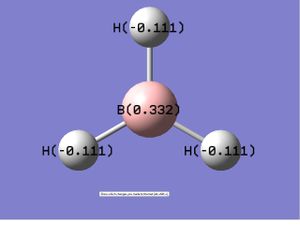
Summary of Natural Population Analysis:

                                      Natural Population
               Natural  -----------------------------------------------
   Atom  No    Charge         Core      Valence    Rydberg      Total
-----------------------------------------------------------------------
     B    1    0.33161      1.99903     2.66935    0.00000     4.66839
     H    2   -0.11054      0.00000     1.11021    0.00032     1.11054
     H    3   -0.11054      0.00000     1.11021    0.00032     1.11054
     H    4   -0.11054      0.00000     1.11021    0.00032     1.11054
=======================================================================
  * Total *    0.00000      1.99903     6.00000    0.00097     8.00000
      (Occupancy)   Bond orbital/ Coefficients/ Hybrids
---------------------------------------------------------------------------------
    1. (1.99853) BD ( 1) B   1 - H   2
               ( 44.48%)   0.6669* B   1 s( 33.33%)p 2.00( 66.67%)
                                           0.0000  0.5774  0.0000  0.0000  0.0000
                                           0.8165  0.0000  0.0000  0.0000
               ( 55.52%)   0.7451* H   2 s(100.00%)
                                           1.0000  0.0000
    2. (1.99853) BD ( 1) B   1 - H   3
               ( 44.48%)   0.6669* B   1 s( 33.33%)p 2.00( 66.67%)
                                           0.0000  0.5774  0.0000  0.7071  0.0000
                                          -0.4082  0.0000  0.0000  0.0000
               ( 55.52%)   0.7451* H   3 s(100.00%)
                                           1.0000  0.0000
    3. (1.99853) BD ( 1) B   1 - H   4
               ( 44.48%)   0.6669* B   1 s( 33.33%)p 2.00( 66.67%)
                                           0.0000  0.5774  0.0000 -0.7071  0.0000
                                          -0.4082  0.0000  0.0000  0.0000
               ( 55.52%)   0.7451* H   4 s(100.00%)
                                           1.0000  0.0000
    4. (1.99903) CR ( 1) B   1           s(100.00%)
                                           1.0000  0.0000  0.0000  0.0000  0.0000
                                           0.0000  0.0000  0.0000  0.0000
    5. (0.00000) LP*( 1) B   1           s(100.00%)
    6. (0.00000) RY*( 1) B   1           s(  0.00%)p 1.00(100.00%)
    7. (0.00000) RY*( 2) B   1           s(  0.00%)p 1.00(100.00%)
    8. (0.00000) RY*( 3) B   1           s(  0.00%)p 1.00(100.00%)
    9. (0.00000) RY*( 4) B   1           s(  0.00%)p 1.00(100.00%)
   10. (0.00032) RY*( 1) H   2           s(100.00%)
                                           0.0000  1.0000
   11. (0.00032) RY*( 1) H   3           s(100.00%)
                                           0.0000  1.0000
   12. (0.00032) RY*( 1) H   4           s(100.00%)
                                           0.0000  1.0000
   13. (0.00147) BD*( 1) B   1 - H   2
               ( 55.52%)   0.7451* B   1 s( 33.33%)p 2.00( 66.67%)
                                           0.0000  0.5774  0.0000  0.0000  0.0000
                                           0.8165  0.0000  0.0000  0.0000
               ( 44.48%)  -0.6669* H   2 s(100.00%)
                                           1.0000  0.0000
   14. (0.00147) BD*( 1) B   1 - H   3
               ( 55.52%)   0.7451* B   1 s( 33.33%)p 2.00( 66.67%)
                                           0.0000  0.5774  0.0000  0.7071  0.0000
                                          -0.4082  0.0000  0.0000  0.0000
               ( 44.48%)  -0.6669* H   3 s(100.00%)
                                           1.0000  0.0000
   15. (0.00147) BD*( 1) B   1 - H   4
               ( 55.52%)   0.7451* B   1 s( 33.33%)p 2.00( 66.67%)
                                           0.0000  0.5774  0.0000 -0.7071  0.0000
                                          -0.4082  0.0000  0.0000  0.0000
               ( 44.48%)  -0.6669* H   4 s(100.00%)
                                           1.0000  0.0000
Second Order Perturbation Theory Analysis of Fock Matrix in NBO Basis
    Threshold for printing:   0.50 kcal/mol
                                                                             E(2)  E(j)-E(i) F(i,j)
        Donor NBO (i)                     Acceptor NBO (j)                 kcal/mol   a.u.    a.u.
===================================================================================================
within unit  1
  4. CR (   1) B   1                / 10. RY*(   1) H   2                    1.51    7.54    0.095
  4. CR (   1) B   1                / 11. RY*(   1) H   3                    1.51    7.54    0.095
  4. CR (   1) B   1                / 12. RY*(   1) H   4                    1.51    7.54    0.095
Natural Bond Orbitals (Summary):
                                                           Principal Delocalizations
          NBO                        Occupancy    Energy   (geminal,vicinal,remote)
====================================================================================
Molecular unit  1  (H3B)
    1. BD (   1) B   1 - H   2          1.99853    -0.43712
    2. BD (   1) B   1 - H   3          1.99853    -0.43712
    3. BD (   1) B   1 - H   4          1.99853    -0.43712
    4. CR (   1) B   1                  1.99903    -6.64476  10(v),11(v),12(v)
    5. LP*(   1) B   1                  0.00000     0.67666
    6. RY*(   1) B   1                  0.00000     0.37177
    7. RY*(   2) B   1                  0.00000     0.37177
    8. RY*(   3) B   1                  0.00000    -0.04532
    9. RY*(   4) B   1                  0.00000     0.43446
   10. RY*(   1) H   2                  0.00032     0.90016
   11. RY*(   1) H   3                  0.00032     0.90016
   12. RY*(   1) H   4                  0.00032     0.90016
   13. BD*(   1) B   1 - H   2          0.00147     0.41201
   14. BD*(   1) B   1 - H   3          0.00147     0.41201
   15. BD*(   1) B   1 - H   4          0.00147     0.41201
      -------------------------------
             Total Lewis    7.99463  ( 99.9329%)
       Valence non-Lewis    0.00441  (  0.0551%)
       Rydberg non-Lewis    0.00097  (  0.0121%)
      -------------------------------
           Total unit  1    8.00000  (100.0000%)
          Charge unit  1    0.00000
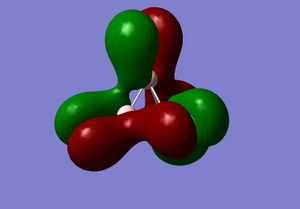
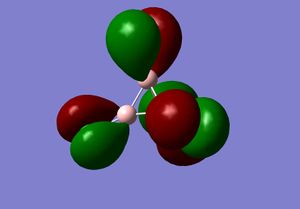
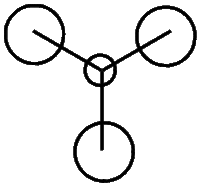
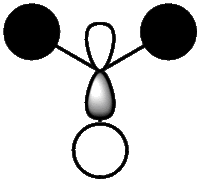
The real and LCAO MOs are similar in terms of symmetry. The most significant difference is that in real MOs, the bonding/anti-bonding orbitals are not located between two atoms, but become diffuse through the whole molecule. This provides a better understanding of the electronic structure of the molecule and can be used to predict its reactivity.
TlBr3 optimization and frequency analysis
Using pseudo-potentials
Complete optimization file: http://hdl.handle.net/10042/to-9943
| Property | Result after optimization | Result after frequency analysis |
|---|---|---|
| Tl-Br bond length(literature value) | 2.65Å (2.51Å) | 2.65Å (2.51Å) |
| Br-Tl-Br bond angle | 120.0° | 120.0° |
| File Type | .log | FREQ |
| Calculation Type | FOPT | FREQ |
| Calculation method | RB3LYP | RB3LYP |
| Basis set | LANL2DZ | LANL2DZ |
| Final energy | -91.21812851 a.u. | -91.21812851 a.u. |
| Gradient | 0.00000090 a.u. | 0.00000088 a.u. |
| Dipole moment | 0.0000 Debye | 0.0000 Debye |
| Point group | D3h | D3h |
| Time taken | 12 seconds | 27seconds |
Answers to the questions.
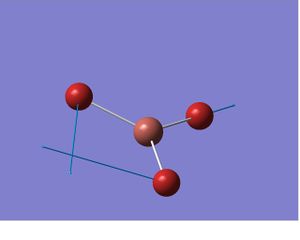
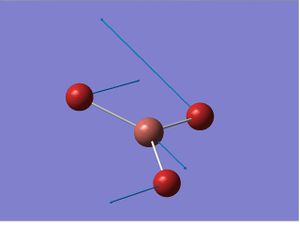
1) The same method basis must be used to keep both calculations are under same approximation. The vibrational frequency analysis is carried out to ensure correct optimizations and could be used to check with the literature or experimental values. The low frequencies of TlBr3 are 46.4289, 46.4292 and 52.1449 cm-1 and the corresponding lowest real normal mode are shown in the table below.
2) The literature value of Tl-Br bond length of TlBr3 is not available, so TlBr3H2O)2 is used here as a comparison. This may not be a good approximation as the optimized bond lengths of Tl-Br is larger than the one in TlBr3(H2O)2. The optimized value is different from the literature value by 0.14Å. This is not a big difference therefore the result obtained is reasonable.
3) Some structures in Gaussview do not show mean there is no bond between atoms, but just because the actual bond lengths of those molecules are different from the data available in the database of Gaussview. A chemical bond is an attraction between atoms that allows the formation of chemical substances that contain two or more atoms. The actual chemical bond in a molecule does not localize only between the two atoms, but diffuse over the whole molecule. This could provide a better understanding of the electronic structure of the molecule and can be used to predict its reactivity.
Reference: Johan Blixt, Julius Glaser, Janos Mink, Ingmar Persson, Per Persson, Magnus SandstroemJ. Am. Chem. Soc., 1995, 117 (18), pp 5089–5104
Part 2
Isomers of Mo(CO)4L2 The compound used as reference is Mo(CO)4(Pph3)2
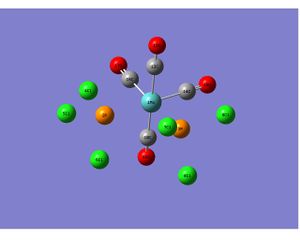
Completed optimization identifier in D-space cis http://hdl.handle.net/10042/to-9577 trans http://hdl.handle.net/10042/to-9576
Geometry properties

| Geometric parameter | Trans optimized structure | Literature value (trans Mo (CO)4PPh3 used) |
|---|---|---|
| Bond length /Å | Mo(1)-P(2) 2.51 Mo(1)-C(16) 2.01 Mo(1)-C(12) 2.06 C(12)-O(13) 1.17 C(16)-O(17) 1.18 | Mo(1)-P(2) 2.58 Mo(1)-C(16)1.97 Mo(1)-C(12) 2.04 C(12)-O(13) 1.15 C(16)-O(17) 1.14 |
| Bond angle /° | P(10)-Mo(1)-P(11)=177.4 P(10)-Mo(1)-C(6)=88.7 C(8)-Mo(1)-C(6)=180.0 P(10)-Mo(1)-C(4)=90.0 | P(10)-Mo(1)-P(11)=180 P(10)-Mo(1)-C(6)=87.2 C(8)-Mo(1)-C(6)=180.0 P(10)-Mo(1)-C(4)=92.0 |

| Geometric parameter | Cis optimized structure | Literature value (cis Mo (CO)4PPh3 used) |
|---|---|---|
| Bond length /Å | Mo(1)-P(10) 2.44 Mo(1)-C(8) 2.06 C(8)-O(7) 1.17 | Mo(1)-P(10) 2.50 Mo(1)-C(8) 2.01 C(8)-O(7) 1.16 |
| Bond angle /° | P(2)-Mo(1)-P(3)=94.2 P(2)-Mo(1)-C(16)=89.4 P(2)-Mo(1)-C(14)=176.1 P(2)-Mo(1)-C(10)=89.2 P(2)-Mo(1)-C(12)=91.9 C(10)-Mo(1)-C(14)=89.1 C(10)-Mo(1)-C(16)=89.7 C(10)-Mo(1)-C(12)=178.3 | P(2)-Mo(1)-P(3)=104.6 P(2)-Mo(1)-C(16)=80.6 P(2)-Mo(1)-C(14)=163.7 P(2)-Mo(1)-C(10)=90.3 P(2)-Mo(1)-C(12)=94.0 C(10)-Mo(1)-C(14)=90.1 C(10)-Mo(1)-C(16)=91.3 C(10)-Mo(1)-C(12)=174.1 |
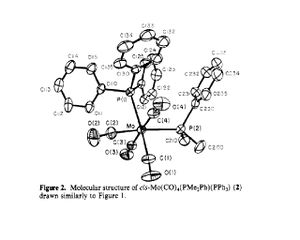
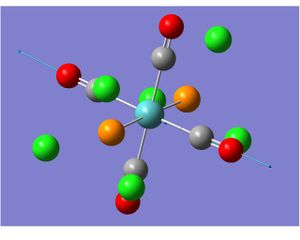
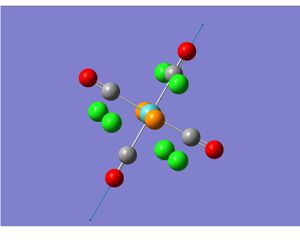
Comment: The experimental geometric parameters of the trans isomer are very close to those reported on the literature, while deviations in the structure of the cis isomer was found after comparing to the literature value. In the trans structure, the bulky phoshpine groups are far apart from each other and show little steric effect on the carbonyl ligands. While in the case of cis isomer. as the approximation using chlorine atoms to replace the phenyl groups is not good enough to represent the steric interaction between phenyl and adjacent carbonyl, a distortion from the ideal octahedral structure is found by compression of C-Mo-C bond. This can be further proven by looking at the structure of cis- Mo(CO)4(PhMe2)PPh3. As the steric effect due between two phosphine groups decreases, the P-Mo-P angle is now 94.8.
Comment on relative energy.
The energies of trans and cis isomers are -623.57603104a.u. and -623.57707194a.u. respectively, which means the relative energy is 2.73kJ mol-1 and the cis isomer is more stable. This contradicts to the literature where trans isomer is the more stable due to the enhanced steric interaction in the cis isomeric form. Two reasons could account for the deviations present here. 1) Experimental error, as the difference between these two isomers is very small, a small error introduced during the calculation could result in an opposite stability; 2) The chlorine atoms used here to simplify the calculation is still not good enough to represent the sterically hindered phenyl group and the actual interactions with the adjacent CO ligands. But this relative energy is a small in magnitude, which suggests the two isomers can exchange easily via an intramolecular, non-dissociative process.
Frequency analysis cis http://hdl.handle.net/10042/to-9578 trans http://hdl.handle.net/10042/to-9579
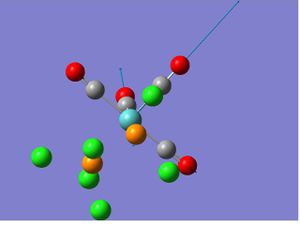
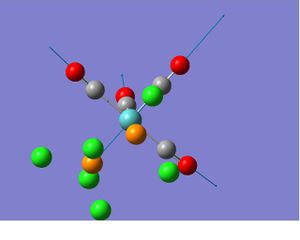
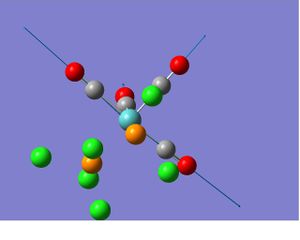
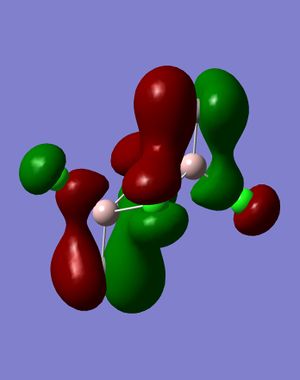
Comment on spectra: Two vibrations have very low frequency are obtained for cis and trans isomers respectively. (The movement of relative groups are shown below). The same number of bands are obtained as predicted from the symmetry. The literature value of IR stretches of cis isomer are: 2023, 1927, 1908 and 1897, the IR stretches of trans is 1947.1 are slightly different from the the calculated values. This is due to the trans effect, because the P(ph3)3 in is a much better electron donating group than PCl3. In the case of the electron density in the metal center increases, the extend of back-bonding increases as well. This results in a weaker C=O bond and therefore low wave number.
| Isomer | Vibrational mode and its frequency | ||
|---|---|---|---|
| Cis |  |
 |
|
| Trans | 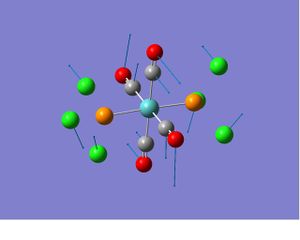 |
 |
Reference
- Graeme Hogarth Tim Norman Inorganica Chimica Acta Volume 254, Issue 1, 1 January 1997, Pages 167-171
- F. Albert. Cotton, Donald J. Darensbourg, Simonetta. Klein, Brian W. S. Kolthammer Inorg. Chem., 1982, 21 (1), pp 294–299
- D. J. Darensbourg, Inorg. Chem. 1979, 18, 14.
- A. D. Allen, P. F. Barrett, Can. J. Chem., 1968, 46, 1649.
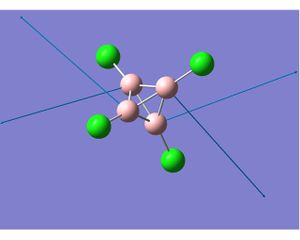
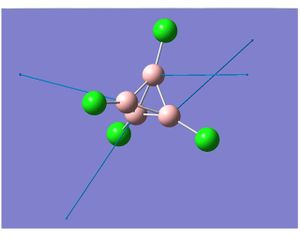
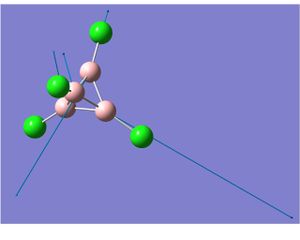
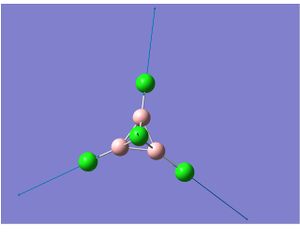
Mini Project (Molecules chosen are B4CL4 B4F4 B4CL2F2
1) Analysis of the geometry
| Bond length beween | B4CL4 | literature value | B4F4 | literature value | B4CL2F2 | literature value | |
|---|---|---|---|---|---|---|---|
| B-B /Å | 1.69 | 1.69 | 1.71 | 1.68 | 1.70 | not available | |
| B-F /Å | - | - | 1.33 | 1.31 | 1.32 | not available | |
| B-Cl /Å | 1.72 | 1.71 | - | - | 1.73 | not available |
All the geometric parameters are very close to those reported in the literature.
2) Analysis of the vibrational spectrum
| Molecule | Computed spectra | Molecule | Computed spectra | Molecule | Computed spectra | |
|---|---|---|---|---|---|---|
| B4CL4 | 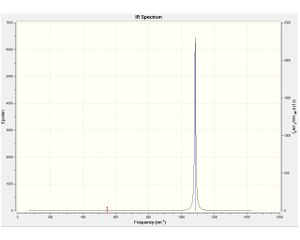 |
B4F4 | 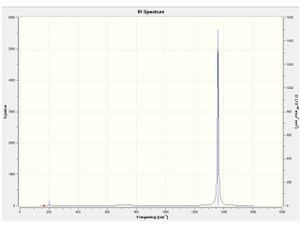 |
4CL2F2 | 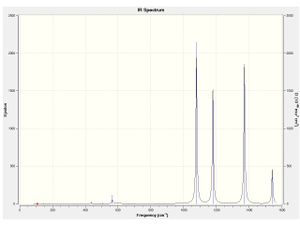 |
Detail analysis of B4CL4
The Infra Red spectroscopy origins from the change in dipole moment of the molecule due to vibrational motions, but as not all the vibrational modes are IR active, or some peaks can overlap as their overall changes in dipole moment are the same, the number of peaks shown on the spectra may not be equal to the number of vibrations. As the vibrational mode's intensity value shown above suggests, most of the vibrational stretches in B4CL4 do not cause any change in the molecular dipole moment, therefore 0 in intensity. The rest two vibrational modes change the molecular dipole moment, as the intensity is proportional to the extent of change in dipole moment during the vibration, we can tell that the stretches at 547.86cm-1 do not cause too much change in dipole moment, while the stretches at 1085.15 result in great change in dipole moment.
3) MO analysis
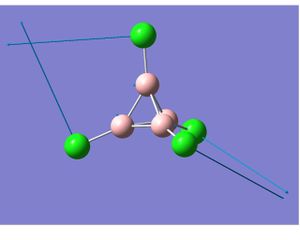
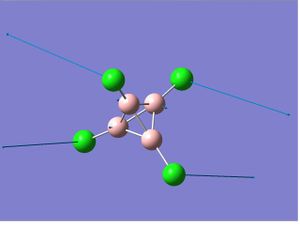
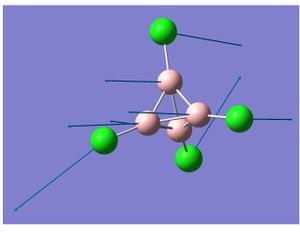
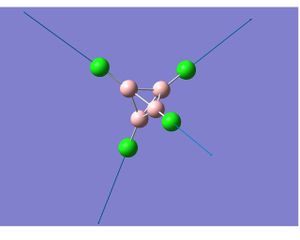
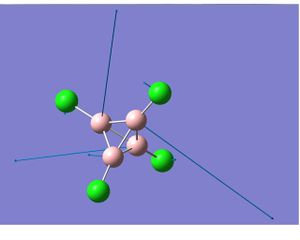
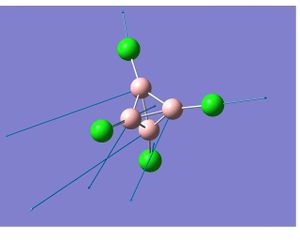
Detailed discussion of MOs. MO 25, Strongly bonding molecule orbital formed from s orbital of Boron and Chlorine atoms, results in maintaining the tetrahedral structure of the whole molecule and the connection between Boron and chlorine atoms. MO 27, Molecule orbital formed from s orbital of Boron and Chlorine atoms, especially good at binding boron and chlorine atoms, as it has bonding interaction between Boron, Chlorine and one of the adjacent boron, but anti-bonding with the rest of two boron atoms. MO 29, A strong anti-bonding molecule orbital formed from s orbital of Boron and p orbital of Chlorine atoms, useful for binding boron skeleton, but there are anti-bonding interactions between chlorine and boron atoms. MO 35, A bonding molecule orbital formed from p orbital of Boron and Chlorine atoms binding boron and chlorine, two of four boron atoms in the skeleton. MO 40, Non-boding molecule orbital formed from p orbital of Boron and Chlorine atoms. No bonding interaction within the whole molecule.
NBO analysis
Charge Distribution:
| Molecule | Charge distribution | Molecule | Charge distribution | Molecule | Charge distribution | |
|---|---|---|---|---|---|---|
| B4Cl4 | 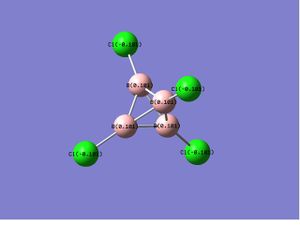 |
B4Cl2F2 | 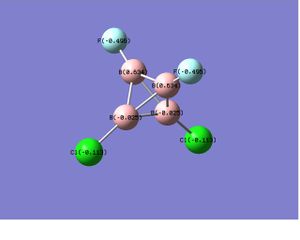 |
B4F4 | 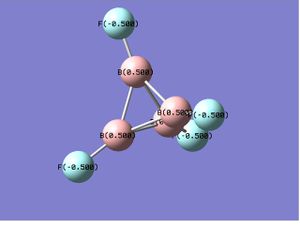 |
Comparisons and comments:
In the case of B4Cl4 and B4F4,as the substitutents change from chlorine to the more electronegative fluorine atoms, the polarity of B-X bond increases and a similar charge distribution, which only differs in the magnitude of charge, were obtained. While for the unsymmetric B4Cl2F2, the electronegative fluorine atoms withdraw the electron density so strongly that it makes the boron it attached to even more positive center than it does in B4F4. This
Another difference is in terms of molecular orbitals. 1) As the subtitutent become more electronegative, a different orbital contribution is observed. For the σ bonding orbital between B-X, the orbital coefficient of the more electronegative X is much larger than that of B, while the opposite is observed in σ* orbital. 2) Also by comparing the bond orbital coefficient of B-X bond of the three molecules, the coefficients are almost the same. 3) The number of bonding orbitals involve Cl increase as the number of chlorine atoms increase. B4Cl4 has 4 more than B4Cl2F2, and 8 more than B4F4. (As shown in the file attached)
File:Comparison.pdf Reference:
- John H. Hall, William N. Lipscomb Inorg. Chem., 1974, 13 (3), pp 710–714
- DANIEL A. KLEIER,*’ JOSEF BICERANO, and WILLIAM N. LIPSCOMB Inorg. Chem., 1980, 19 (1), pp 216–218
- James O. Jensen Spectrochimica Acta Part A: Molecular and Biomolecular Spectroscopy Volume 58, Issue 10, August 2002, Pages 2299-2309

