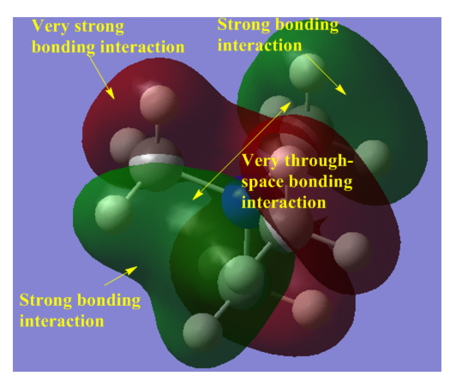
Rep:Mod:fred123
Inorganic Computational Lab
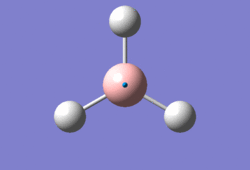
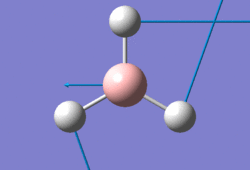
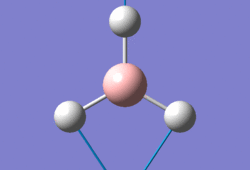
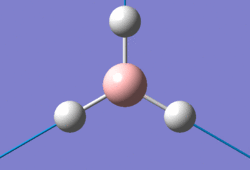
BH3 Optimization (3-21G basis set)

The optimised B-H bond distance is 1.19 Å and the optimised bond angle is 120.0 degrees.
This is the 3-21G optimised BH3 file: opt_bh3
Summary Table
| Summary | Results |
|---|---|
| File name | BH3 Optimisation |
| File type | .log |
| Calculation Type | FOPT |
| Calculation Method | RB3LYP |
| Basis set | 3-21G |
| Charge | 0 |
| Spin | Singlet |
| E(RB3LYP) | -26.462 a.u. |
| RMS Gradient Norm | 0.000 a.u. |
| Imaginary | Freq |
| Dipole moment | 0.00 Debye |
| Point Group | D3H |
"Item" Table
Item                            Value      Threshold          Converged?

 Maximum Force                 0.000413       0.000450             YES

 RMS Force                     0.000271       0.000300             YES

 Maximum Displacement          0.001610       0.001800             YES

 RMS Displacement              0.001054       0.001200             YES

 Predicted change in Energy = -1.071764D-06

 Optimization completed.

 -- Stationary point found.
BH3 Optimization [6-31G(d,p)basis set]
The optimised B-H bond distance is 1.19 Å and the optimised bond angle is 120.0 degrees.

Summary table
| Summary | Results |
|---|---|
| File name | BH3 Optimisation 631g_dp |
| File type | .log |
| Calculation Type | FOPT |
| Calculation Method | RB3LYP |
| Basis set | 6-31G(d,p) |
| Charge | 0 |
| Spin | Singlet |
| E(RB3LYP) | -26.615 a.u. |
| RMS Gradient Norm | 0.000 a.u. |
| Imaginary | Freq |
| Dipole moment | 0.00 Debye |
| Point Group | D3H |
This is the 6-31G(d,p) BH3 optimisation file: opt_631G_dpbh3
"Item" table
  Item                   Value     Threshold  Converged?

 Maximum Force            0.000017     0.000450     YES

 RMS     Force            0.000011     0.000300     YES

 Maximum Displacement     0.000068     0.001800     YES

 RMS     Displacement     0.000045     0.001200     YES

 Predicted change in Energy = -1.770138D-09

 Optimization completed.

    -- Stationary point found.
GaBr3 Optimization (LanL2DZ basis set)

Here's the link to the GaBr3 optimisation in the D-space: GaBr3 D-space
The optimised Ga-Br bond length is 2.35 Å and the optimised bond angle is 120.0 degrees.
The literature Ga-Br bond length is 2.249 ± 0.005 Å at 638 K, this is reasonably close to the optimised bond length. [1]
Summary table
| Summary | Results |
|---|---|
| File name | GaBr3 Optimisation |
| File type | .log |
| Calculation Type | FOPT |
| Calculation Method | RB3LYP |
| Basis set | LANL2DZ |
| Charge | 0 |
| Spin | Singlet |
| E(RB3LYP) | -41.701 a.u. |
| RMS Gradient Norm | 0.000 a.u. |
| Imaginary | Freq |
| Dipole moment | 0.00 Debye |
| Point Group | D3H |
"Item" table
Item                        Value       Threshold    Converged?

Maximum Force              0.000000      0.000450       YES

RMS Force                  0.000000      0.000300       YES

Maximum Displacement       0.000003      0.001800       YES

RMS Displacement           0.000002      0.001200       YES

Predicted change in Energy = -1.282682D-12

Optimization completed.

-- Stationary point found.
BBr3 Optimization (6-31G d,p basis set)

This is the 6-31G (d,p) optimised BBr3 file: opt_bbr3
The optimised B-Br bond distance is 2.02 Å and the optimised bond angle is 120.0 degrees.
Summary table
| Summary | Results |
|---|---|
| File name | BBr3 Optimisation |
| File type | .log |
| Calculation Type | FOPT |
| Calculation Method | RB3LYP |
| Basis set | Gen |
| Charge | 0 |
| Spin | Singlet |
| E(RB3LYP) | -64.429 a.u. |
| RMS Gradient Norm | 0.000 a.u. |
| Imaginary | Freq |
| Dipole moment | 0.00 Debye |
| Point Group | D3H |
"Item" table
Item                   Value Threshold Converged?

Maximum Force          0.000008 0.000450 YES

RMS Force              0.000005 0.000300 YES

Maximum Displacement   0.000036 0.001800 YES

RMS Displacement       0.000023 0.001200 YES

Predicted change in Energy = -4.026995D-10

Optimization completed.

-- Stationary point found.
Comparison between BH3, GaBr3, and BBr3
| B-H | Ga-Br | B-Br |
| 1.19 | 2.35 | 2.02 |
What difference does changing the ligand have?
The B-Br bond length is almost twice as large as B-H bond length, this is because Br valence orbital (4p) is much more diffuse than the valence orbital (1s) of H. This means that the overlap between the sp3 orbital of the boron (BH3 is a dimer) and the 1s orbital of H will be greater than the overlap between the sp2 orbital of the boron (BBr3 is a monomer) and the 4p orbital of Br.
Also, Br is more electronegative than H, which means that the difference in energy between the B and Br orbitals will be larger than the difference in energy between B and H; the closer in energy the overlapping orbitals are to each other the greater the overlap. A larger overlap leads to a larger splitting energy, and larger splitting energies lead to bonding MOs that are lower in energy. This means that the bonding MOs of BH3 will be lower in energy than the (corresponding) bonding MOs of BBr3. Bonding MOs that are lower in energy lead to stronger (and shorter) bonds, hence the reason why the B-H bond length is smaller than the B-Br bond length.
In conclusion, a change in ligand can lead to a change in bond length and to a change in geometry (this is explained in the next sub-section).
How are H and Br similar, how are they different?
Similarities: H and Br are both X ligands (a one electron donor ligand). H and Br exist in their diatomic form, H2 and Br2 (respectively).
Differences: H only needs two electrons to complete its valence (1s) orbital, Br needs 8 electrons to complete its 4p valence orbital. H can also exist as both an anion and a cation; Br can't exist as a cation. Br has three lone pairs; H has no lone pairs. The reason why BBr3 can exist as a monomer (but not BH3) is due to the presence of the lone pairs on Br; Pi-donation from the filled 4p orbitals on Br to the empty 2p orbital on B strengthens the B-Br bond.
What difference does changing the central element make?
The Ga-Br bond length is slightly bigger than the B-Br bond length, this is because GaBr3 exists as a dimer (whereas BBr3 exists as a monomer). In GaBr3, Ga is sp3 hybridised and forms a normal 2e-2c bonds with the terminal Br, and 2e-3c bonds with the bridging Br. The 2e-3c bonds are longer than the normal 2c-2e bonds because the bond order of a 2e-3c bond is 0.5 (compared to a bond order of 1, for a 2c-2e bond). This means that the average Ga-Br bond length will be larger than the average B-Br bond length. The reason why GaBr3 is a dimer is because the 4p-4p pi overlap between Ga and Br is much weaker than the 2p-4p overlap between B and Br; dimerisation is needed to relieve the electron deficiency in Ga. The B-Br bond length is also stronger (and smaller) due to the 2p-4p overlap.
Also, B is more similar to Br than Ga, in terms of electronegativity. This means that the B orbitals are more similar in energy to the Br orbitals and, therefore, the splitting energy of each overlap (for BBr3) will be larger than the corresponding orbital within GaBr3; overlaps with a larger splitting energy yield more stable bonding MOs. Hence, the B-Br bonds should have a shorter bond distance than Ga-Br (and this is, indeed, the case).
In conclusion, a change in the central can lead to a change in bond length and to a change in geometry.
How are B and Ga similar, how are they different?
Similarities: Ga and Br are both group 13 atoms. They both have a similar reactivity. They are both electron deficient in their monomeric (BH3 and GaBr3) form.
Differences: B can form stronger bonds with any given ligand.
In some structures gaussview does not draw in the bonds where we expect, does this mean there is no bond? Why?
the reason why gaussview does this is because (like in MO theory) individual electrons are not assigned to individual atoms; the electrons are delocalised around the entire molecule. The bonds are still there, but Gaussview doesn't show them in a 2e-2c fashion.
What is a bond?
A bond is the accumulation of electron density between two atoms/molecules; it is what ultimately attracts two atoms/molecules together. In MO theory, if a bonding MO is (fully) occupied then (unless its corresponding antibonding orbital is also fully occupied there's a bond between the atoms/molecules that contributed (their AOs/FAOs) to the bonding MO.
Frequency analysis of BH3
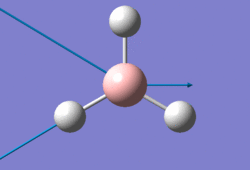
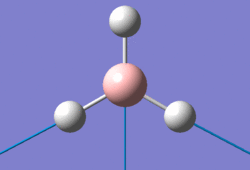
This is the completed 6-31G(d,p) frequency analysis of BH3 file: freq_bh3
Low frequencies
Low frequencies --- -9 -9 -0 -0 0.5 2.4

Low frequencies --- 1160 1210 1210
"Item" table
Item                         Value       Threshold   Converged?

Maximum Force                0.000017    0.000450      YES

RMS Force                    0.000009    0.000300      YES

Maximum Displacement         0.000068    0.001800      YES

RMS  Displacement            0.000034    0.001200      YES

Predicted change in Energy = -1.779492D-09

Optimization completed.

-- Stationary point found.
Summary table
| Summary | Results |
|---|---|
| File name | FrederickT_BH3_FREQ |
| File type | .log |
| Calculation Type | FOPT |
| Calculation Method | RB3LYP |
| Basis set | 6-31G(d,p) |
| Charge | 0 |
| Spin | Singlet |
| E(RB3LYP) | -26.615 a.u. |
| RMS Gradient Norm | 0.000 a.u. |
| Imaginary | Freq |
| Dipole moment | 0.00 Debye |
| Point Group | D3H |
Vibration table
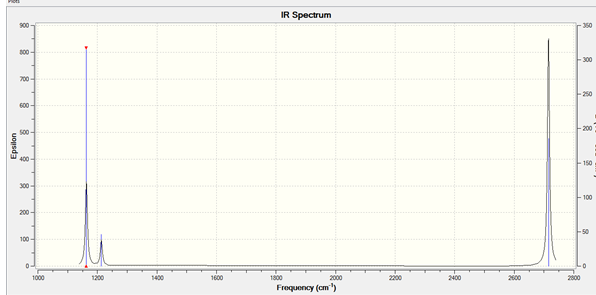
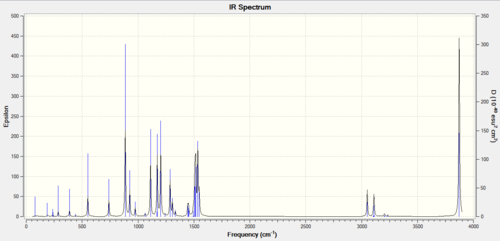
IR spectrum
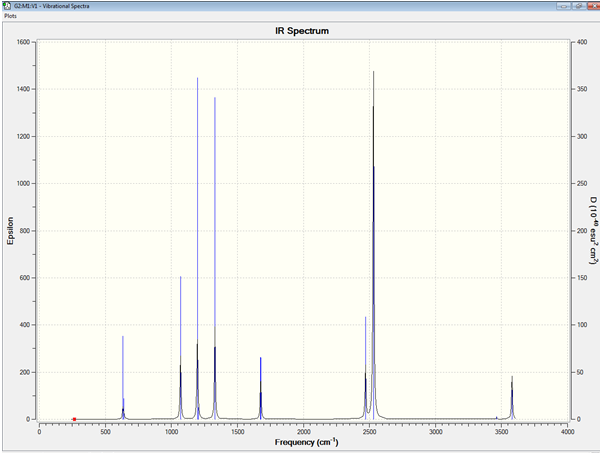
Why are there less than six peaks in the spectrum?
There are two degenerate (E') vibrational modes (at 1210 and 2720 cm-1, respectively); the two degenerate vibrational modes appear as one peak. Only vibrational modes that lead to a net change in the dipole moment of the molecule absorb infrared radiation, and this is the reason why the A1' vibrational mode doesn't appear in the IR spectrum (it is a totally symmetric mode - it doesn't cause a net change in dipole moment); the IR spectrum only shows the two different degenerate E' vibrational modes and the A2" vibrational mode.
Frequency analysis of GaBr3
Here's the link to the GaBr3 D-space that was done for its frequency analysis: GaBr3 D-space freq
Low Frequencies
Low frequencies --- -1 -1 0 0 0 1

Low frequencies --- 76 76 100
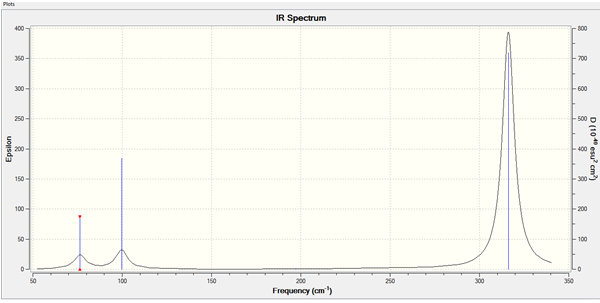
The lowest "real" normal mode is 76 cm-1.
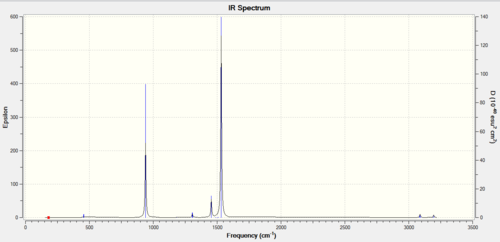
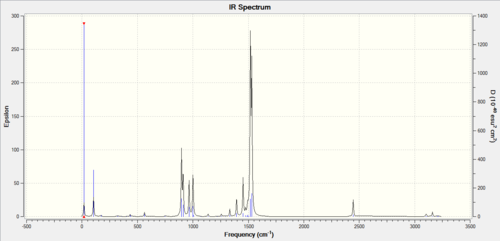
IR spectrum
Frequency comparison between GaBr3 and BH3
Frequency comparison table
| BH3 | GaBr3 | ||||
| Frequency | Intensity | Symmetry label | Frequency | Intensity | Symmetry label |
| 1160 | 93 | A2" | 76 | 3 | E' |
| 1210 | 14 | E' | 76 | 3 | E' |
| 1210 | 14 | E' | 100 | 9 | A2" |
| 2580 | 0 | A1' | 197 | 0 | A1' |
| 2720 | 126 | E' | 320 | 57 | E' |
| 2720 | 126 | E' | 320 | 57 | E' |
What does the large difference in the value of the frequencies for BH3 compared to GaBr3 indicate?
The large difference in frequency values indicates that the Ga-Br bond length is different to the B-H bond length. The 1s-(2)sp3 overlap between H and B is greater than the 4p-(4)sp3 overlap between Br and Ga (both BH3 and GaBr3 are dimers). Bond length and bond strength are inversely proportional. The reduced mass of GaBr3 is larger than the reduced mass of BH3. The equation that is used for bond frequency is
Where is the reduced mass of the system and is the bond strength.
Has there been a reordering of modes?
Yes, there has been a reordering;
the lowest "real" mode for BH3 is the mode with the frequency label A2", in contrast to GaBr3 - its lowest "real" mode has a frequency of 76 cm-1, this is an E' vibrational mode.
How are these spectra similar?
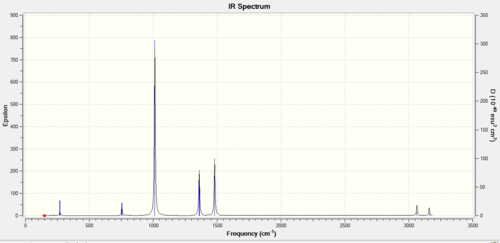
Both spectra have three peaks (despite the fact that GaBr3 and BH3 both show 6 different forms of vibrations).
For both spectra two modes lie fairly closely together, the A2" and E' modes and then the other two modes also lie fairly close together, the A1' and E' modes, but higher in energy. Why is this?
The A" and E' modes are similar in frequency (in both spectra). Quantum mechanically, the energy states for each normal mode is given by
The above equation shows that frequency is proportional to energy, hence the reason why the A2" and E' modes lie fairly close together; the A1' and E' have similar frequencies for the exact same reason.
Why must you use the same method and basis set for both the optimisation and frequency analysis calculations?
Because the frequency analysis is also used to confirm that the structure of the optimised molecule is a minimum (on the potential energy surface of the system); if the basis set and the method are not exactly the same then the frequency analysis of the molecule will not be able to confirm this.
What is the purpose of carrying out a frequency analysis?
The frequency analysis is used to predict the IR spectrum of the molecule, to explain why some peaks are not present, to find out the symmetry label of each form of vibration, and to confirm that the structure of the optimised molecule is a minimum (a frequency analysis is essentially the second derivative of the potential energy surface).
What do the "Low frequencies" represent?
The different motions of the center of mass of the entire molecule give rise to the frequencies shown on the first line of the "low frequencies" section; the centre of mass is larger than the reduced mass of the system, hence the low frequencies:
The second line shows the (three) forms of vibrations that have lowest frequencies.
Molecular orbitals of BH3
Are there any significant differences between the real and LCAO MOs?
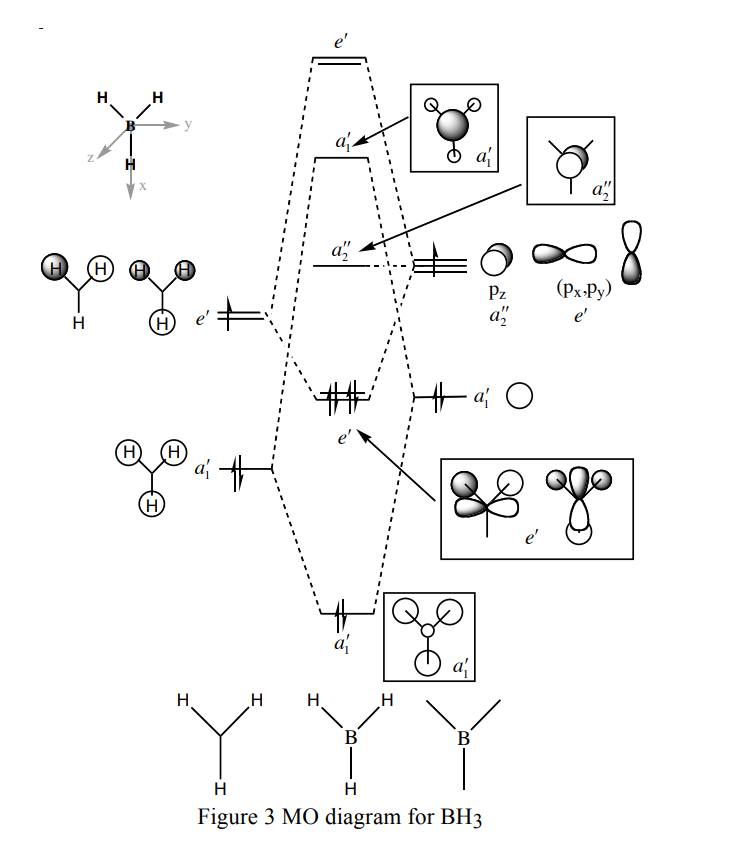
There are no significant differences between the real and the LCAO MOs; the relative energy of each MO, and the relative coefficients of the fragment orbitals that make up each of the MOs, were predicted correctly using qualitative MO theory. It should be noted that, unlike LCAO MOs, real MOs combine the AOs on different centres; the LCAO MOs show the individual AO components.
What does this say about the accuracy and usefulness of qualitative MO theory?
Qualitative MO theory is very useful in accurately predicting the MOs of simple molecules.
NBO Analysis of NH3
This is the 6-31G(d,p) NH3 optimisation file: NH3_opt. This the 6-31G(d,p) NH3 frequency file: NH3_freq. And this the 6-31G(d,p) NH3 MO file: NH3_energy
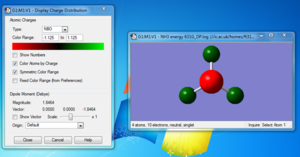
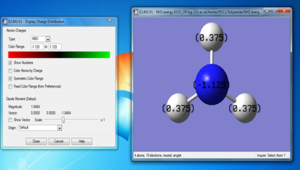
Summary table
| Summary | Results |
|---|---|
| File name | NH3 OPTIMISATION 631G_DP |
| File type | .log |
| Calculation Type | FOPT |
| Calculation Method | RB3LYP |
| Basis set | 6-31G(d,p) |
| Charge | 0 |
| Spin | Singlet |
| E(RB3LYP) | -56.558 a.u. |
| RMS Gradient Norm | 0.000 a.u. |
| Imaginary | Freq |
| Dipole moment | 1.85 Debye |
| Point Group | C3V |
"Item" table
Item                Value  Threshold Converged?

Maximum Force        0.000005 0.000450 YES

RMS Force            0.000003 0.000300 YES

Maximum Displacement 0.000010 0.001800 YES

RMS Displacement     0.000007 0.001200 YES

Predicted change in Energy = -7.830712D-11

Optimization completed.

-- Stationary point found
Low frequencies
Low frequencies --- -12 -12 0 0 0 26
Low frequencies --- 1090 1690 1690
Association energies: Ammonia-Borane
This is the 6-31G(d,p) NH3BH3 optimisation file: NH3BH3_opt.
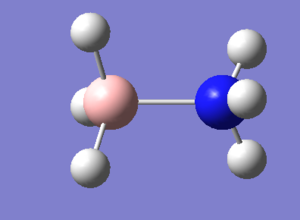
Low frequencies
Low frequencies --- 0 0 0 18 23 41
Low frequencies --- 270 630 640
Summary table
| Summary | Results |
|---|---|
| File name | NH3BH3 optimisation |
| File type | .log |
| Calculation Type | FOPT |
| Calculation Method | RB3LYP |
| Basis set | 6-31G(d,p) |
| Charge | 0 |
| Spin | Singlet |
| E(RB3LYP) | -83.225 a.u. |
| RMS Gradient Norm | 0.000 a.u. |
| Imaginary | Freq |
| Dipole moment | 5.57 Debye |
| Point Group | C1 |
The point group should be Td.
"Item" table
Item                    Value Threshold Converged?

Maximum Force           0.000128 0.000450 YES

RMS Force               0.000057 0.000300 YES

Maximum Displacement   0.000631  0.001800 YES

RMS Displacement        0.000304 0.001200 YES

Predicted change in Energy=-1.626461D-07

Optimization completed.

-- Stationary point found.
Energy comparison
| BH3 | NH3 | NH3 BH3 |
| -26.615 | -56.558 | -83.225 |
= -0.052.u. = -137 KJ/mol, this is the association energy for combinging a molecule of NH3 with BH3.
IR spectrum
Ionic Liquids (Part 1)
Optimisation of [N(CH3)4]+
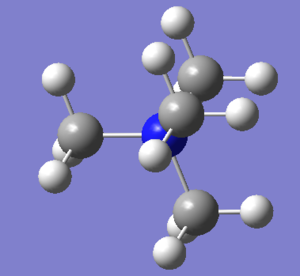
The optimised N-C bond length is 1.51 Å and the optimised C-N-C bond angle is 109.5 degrees. N(CH3)4 is a tetrahedral cation, and this is confirmed by its bond angle of 109.5 degrees. The optimised C-H bond length is 1.09 Å.
This is the 6-31G(d,p) optimised [N(CH3)4]+ file: opt_[N(CH3)4]+. And this is the frequency file: freq_[N(CH3)4]+.
Summary table
| Summary | Results |
|---|---|
| File name | [N(CH3)4]+_optimisation |
| File type | .log |
| Calculation Type | FOPT |
| Calculation Method | RB3LYP |
| Basis set | 6-31G(d,p) |
| Charge | 1 |
| Spin | Singlet |
| E(RB3LYP) | -214.181 a.u. |
| RMS Gradient Norm | 0.000 a.u. |
| Imaginary | Freq |
| Dipole moment | 0.00 Debye |
| Point Group | C1 |
The point group should be Td.
"Item" table
Item                  Value Threshold Converged?

Maximum Force           0.000107 0.000450 YES

RMS Force               0.000031 0.000300 YES

Maximum Displacement    0.001023 0.001800 YES

RMS Displacement        0.000357 0.001200 YES

Predicted change in Energy = -1.390556D-07

Optimization completed.

-- Stationary point found
Low Frequencies
Low frequencies --- -14 0 0 0 10 23
Low frequencies --- 180 280 290
IR spectrum
Optimisation of [P(CH3)4]+
The optimised P-C bond length is 1.82 Å and the optimised C-P-C bond angle is 109.5 degrees. P(CH3)4 is a tetrahedral cation, and this is confirmed by its bond angle of 109.5 degrees. The optimised C-H bond length is 1.09 Å.
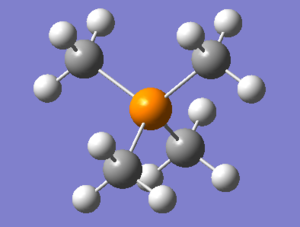
This is the 6-31G(d,p) optimised [P(CH3)4]+ file: opt_[P(CH3)4]+. And this is the frequency file: freq_[P(CH3)4]+.
Summary table
| Summary | Results |
|---|---|
| File name | [P(CH3)4]+_OPTIMISATION |
| File type | .log |
| Calculation Type | FOPT |
| Calculation Method | RB3LYP |
| Basis set | 6-31G(d,p) |
| Charge | 1 |
| Spin | Singlet |
| E(RB3LYP) | -500.827 a.u. |
| RMS Gradient Norm | 0.000 a.u. |
| Imaginary | Freq |
| Dipole moment | 0.00 Debye |
| Point Group | C1 |
The point group should be Td.
"Item" table
Item                           Value   Threshold  Converged?
Maximum Force                   0.000073 0.000450   YES
RMS Force                       0.000033 0.000300   YES
Maximum Displacement            0.000808 0.001800   YES
RMS Displacement                0.000269 0.001200   YES
Predicted change in Energy = -2.205226D-07
Optimization completed.
-- Stationary point found.
Low frequencies
 Low frequencies --- -36 -16 -0 06 06 18
 Low frequencies --- 150 190 190
IR spectrum
Optimisation of [S(CH3)3]+
The optimised S-C bond length is 1.82 Å and the optimised bond angle is 102.7 degrees. S(CH3)3 should have a trigonal pyramidal geometry due to the presence of a lone pair on S; the pyramidal bond angle is approximately 107 degrees - 102.7 degrees is clearly shorter than that - the reason for this is because the lone pair is more diffuse than that of any corresponding main group atom (occupying the central position of a molecule). The optimised C-H bond length is 1.09 Å.
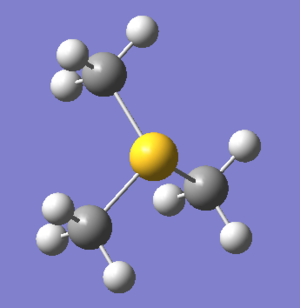
This is the 6-31G(d,p) optimised [S(CH3)3]+ file: opt_[S(CH3)3]+.
And this is the frequency file: freq_[S(CH3)3]+.
Summary table
| Summary | Results |
|---|---|
| File name | [S(CH3)3]+_OPTIMISATION |
| File type | .log |
| Calculation Type | FOPT |
| Calculation Method | RB3LYP |
| Basis set | 6-31G(d,p) |
| Charge | 1 |
| Spin | Singlet |
| E(RB3LYP) | -517.683 a.u. |
| RMS Gradient Norm | 0.000 a.u. |
| Imaginary | Freq |
| Dipole moment | 0.97 Debye |
| Point Group | C1 |
The point group should be C3V.
"Item" table
Item                          Value Threshold Converged?

Maximum Force               0.000103 0.000450 YES

RMS Force                   0.000030 0.000300 YES

Maximum Displacement        0.001518 0.001800 YES

RMS Displacement            0.000558 0.001200 YES

Predicted change in Energy=-1.194911D-06

Optimization completed.

-- Stationary point found.
Low frequencies
Low frequencies --- -16 -10 0 0 0 21
Low frequencies --- 150 190 200
IR Spectrum
Molecular Orbitals of [N(CH3)4]+
This is the 6-31G(d,p) energy fchk file: energy_[N(CH3)4]+.
Ionic Liquids (Part 2)
NBO analysis of [N(CH3)4]+, [P(CH3)4]+, and [S(CH3)3]+
This is the [N(CH3)4]+ energy log file: energy_[N(CH3)4]+.
This is the [P(CH3)4]+ energy log file: energy_[P(CH3)4]+.
This is the [S(CH3)3]+ energy log file: energy_[S(CH3)3]+.
| [N(CH3)4]+ | [P(CH3)4]+ | [S(CH3)3]+ | ||||||
| Charge on N | Charge on C | Charge on H | Charge on P | Charge on C | Charge on H | Charge on S | Charge on C | Charge on H |
| -0.296 | -0.483 | 0.269 | 1.667 | -1.060 | 0.298 | 0.917 | -0.845 | 0.279/0.297 |

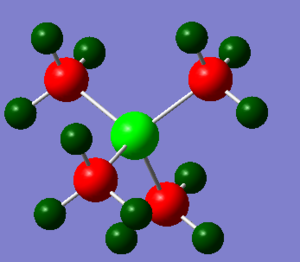

Explain the relative contribution of the C and heteroatom to the C-X bond.
The charge difference between P and C (to the C-P bond) is slightly larger than the charge difference between S and C (to the C-S bond), and is noticeably larger than the charge difference between N and C (to the C-N bond). From the NBO analysis, it can be seen that 40.43% of the P-C bond comes from phosphorus and 59.57% comes from carbon. The sp3 orbitals of the phosphorus bonds with the remaining sp3 orbitals from each of the four carbons. The LCAO for the bonding between P and C is
0.636(sp2.97)P + 0.772(sp2.96)C.
The LCAO also shows that the carbon contributes more to the P-C bond than phosphorus, because carbon is more electronegative than phosphorus.
It can also be seen, from the NBO analysis, that 48.67% of the S-C bond comes from the carbon and 51.33% comes from sulphur. The LCAO for the bonding between S and C is
0.717(sp4.86)S + 0.698(sp4.07)C.
Obviously, sp4 and sp5 hybridisations don't exist; molecular orbital mixing is the likely reason for the presence of "sp4.86" and " sp4.07" hybridised orbitals. Sulphur is only slightly more electronegative than carbon - this explains why the MO mixing is large. MO mixing changes the AO contribution to the (new) MOs, and that is why the hydrogens don't all have the same NBO charge.
It can also be seen, from the NBO analysis, that 66.35% of the N-C bond comes from the nitrogen and 33.65% comes from carbon. The sp3 orbitals of the nitrogen bonds with the remaining sp3 orbitals from each of the four carbons. The LCAO for the bonding between N and C is
0.815(sp3.00)N + 0.580(sp3.80)C.
This shows that there's some degree of molecular orbital mixing in [N(CH3)4]+, but the degree of mixing is a lot smaller for [N(CH3)4]+ than it is for [S(CH3)3]+. The LCAO shows that the nitrogen is more electronegative than carbon. Despite the electronegativity difference between N and C is slightly larger than the electronegativity difference between S and C; the NBO charge difference between S and C is a lot larger due to the fact that the degree of mixing is a lot larger for [S(CH3)3]+. But the charge difference between P and C is so large that even the large molecular orbital mixing in [S(CH3)3]+ isn't enough for the NBO charge difference between S and C to match the NBO charge difference bwteen S and C.
What does the "formal" positive charge on the N represent in the traditional picture?
A "formal charge" is the electron distribution a particular Lewis structure could have, assuming that the electrons are distributed in such a way that there is perfect covalency. The +1 formal charge represents the fact that the number of groups the nitrogen is bonded to is 1 greater than the number of electrons needed to complete nitrogen's valence shell. The formal charge concept disregards electronegativity completely.
On what atoms is the positive charge actually located for this cation?
The positive charge is actually located on the hydrogens.
Analysis of [N(CH3)3(CH2)OH]+
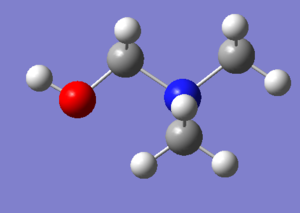
This is the 6-31G(d,p) optimised [N(CH3)3(CH2)OH]+ file: opt_[N(CH3)3(CH2)OH]+. And this is the frequency file: freq_[N(CH3)3(CH2)OH]+.
Summary table
| Summary | Results |
|---|---|
| File name | [N(CH3)3(CH2OH)]+_OPTIMISATION |
| File type | .log |
| Calculation Type | FOPT |
| Calculation Method | RB3LYP |
| Basis set | 6-31G(d,p) |
| Charge | 1 |
| Spin | Singlet |
| E(RB3LYP) | -289.393 a.u. |
| RMS Gradient Norm | 0.000 a.u. |
| Imaginary | Freq |
| Dipole moment | 1.58 Debye |
| Point Group | C1 |
The point group should be Td.
"Item" table
Item                           Value       Threshold      Converged?
Maximum Force                0.000053      0.000450         YES
RMS Force                    0.000011      0.000300         YES
Maximum Displacement         0.000983      0.001800         YES
RMS Displacement             0.000252      0.001200         YES
Predicted change in Energy=-2.619367D-08
Optimization completed.
-- Stationary point found.
Low frequencies
Low frequencies --- -250 -48 -40 -35 0 0
Low frequencies --- 0 81 190
IR spectrum
Analysis of [N(CH3)3(CH2)CN]+
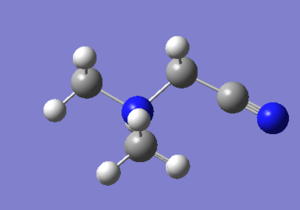
This is the 6-31G(d,p) optimised [N(CH3)3(CH2)OH]+ file: opt_[N(CH3)3(CH2)CN]+. And this is the frequency file: freq_[N(CH3)3(CH2)CN]+.
| Summary | Results |
|---|---|
| File name | [N(CH3)3(CH2CN)]+_optimisation |
| File type | .log |
| Calculation Type | FOPT |
| Calculation Method | RB3LYP |
| Basis set | 6-31G(d,p) |
| Charge | 1 |
| Spin | Singlet |
| E(RB3LYP) | -306.394 a.u. |
| RMS Gradient Norm | 0.000 a.u. |
| Imaginary | Freq |
| Dipole moment | 5.76 Debye |
| Point Group | C1 |
The point group should be Td.
"Item" table
 Item                               Value       Threshold       Converged?
Maximum Force                     0.000052       0.000450         YES
RMS Force                         0.000009       0.000300         YES
Maximum Displacement              0.001642       0.001800         YES
RMS Displacement                  0.000349       0.001200         YES
Predicted change in Energy=-2.559033D-08
Optimization completed.
-- Stationary point found.
Low frequencies
Low frequencies --- -70 -54 -30 0 0 0
Low frequencies --- 44 110 180
IR spectrum
NBO analysis of [N(CH3)3(CH2OH)]+ and N(CH3)3(CH2CN)]+
N(CH3)3(CH2CN)]+
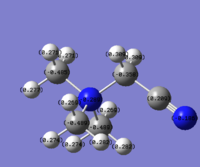
The carbon that is bonded directly to the CN group has an NBO charge of -0.358; the hydrogens of that carbon have each have an NBO charge of 0.241. The central N atom has an NBO charge change from -0.309 (as in [N(CH3)4]+) to -0.289. The next (two) adjacent carbons have an NBO charge of -0.489; the carbons each have hydrogens with NBO charges of 0.282, 0.274 and 0.269, respectively. The furthermost carbon (with respect to CN) has an NBO charge of -0.489; the hydrogens of that carbon have an NBO charge of 0.277/0.271 (0.277 is the NBO charge of the furthermost hydrogen).
The reason why the carbon that is directly bonded to the very electron withdrawing CN group has the most positive NBO charge is because the (positively charged) central N atom is also (but to a greater extent) electron withdrawing. There's a "tug-of-war" between the central N atom and the CN functional group for the electron density of that carbon atom; the tug-of-war action lessens the electron-withdrawing ability of the nitrogen (with respect to that carbon) - this is also the reason why the NBO charge for the central nitrogen in N(CH3)3(CH2CN)]+ is more positive than the NBO charge for the central nitrogen atom in [N(CH3)4]+. The other three carbon atoms feel the full-effect of the central atom's electron withdrawing ability. The NBO charges of the three non-adjacent carbons are essentially the same (with an NBO charge difference of only 0.001). The 0.001 difference could be due to the fact that the two carbon atoms (with an NBO charge of -0.489) are geometrically closer to the CN functional group - this could also the reason why the the three hydrogens (of each carbon) have different NBO charges; the NBO charge of 0.282 belongs to the hydrogens that are pointing towards the direction of the CN group. The hydrogen atom with an NBO charge of 0.277 is geometrically closer to the CN functional group than the hydrogen atoms with an NBO charge of 0.271.
The expected general trend is that the more negatively charge the carbon should have the less positively charged hydrogens, but this is not always the case because geometrical considerations also need to be taken into account.
This is the energy log file: energy_N(CH3)3(CH2CN)]+.
[N(CH3)3(CH2OH)]+
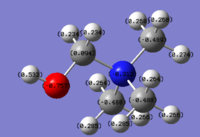
The carbon that is bonded directly to the OH group has an NBO charge of 0.094; the hydrogens of that carbon each have an NBO charge of 0.234. The central N atom has an NBO charge change from -0.309 (as in [N(CH3)4]+) to -0.313. The next (two) adjacent carbons have an NBO charge of -0.488; the carbons each have hydrogens with NBO charges of 0.285, 0.264 and 0.266, respectively. The furthermost carbon (with respect to OH) has an NBO charge of -0.489; the hydrogens of that carbon have an NBO charge of 0.274/0.268 (0.274 is the NBO charge of the furthermost hydrogen).
The reason why the carbon, that is directly bonded to the very electron withdrawing OH group, has a positive NBO charge is because the (positively charged) central N atom is also (to a much lesser extent) electron withdrawing. There's a "tug-of-war" between the central N atom and the CN functional group for the electron density of that carbon atom; the tug-of-war action significantly lessens the electron-withdrawing ability of the nitrogen (with respect to that carbon). OH is slightly more electron withdrawing than the central nitrogen atom, this is also the reason why the NBO charge for the central nitrogen in [N(CH3)3]+ is more negative than the NBO charge for the central nitrogen atom in [N(CH3)4)]+. The other three carbon atoms feel the full-effect of the central atom's electron withdrawing ability. OH is more electron withdrawing than N; unlike in [N(CH3)3(CH2CN)]+, it is OH that is the main electron withdrawing group/atom.
OH and the furthermost carbon are antiperiplanar, with respect to each other. This means that the electrons in the O-H σ-orbital is able to interact with the σ*-orbital of the C-H (the two orbitals can overlap efficiently in this conformation). Because of this interaction, the OH group is able to donate more electron-density to the furthermost carbon than it would at a different conformation. This is the reason why the NBO charge of the furthermost carbon is (slightly) more negative than the NBO charge of the other two non-adjacent carbons.
This is the energy log file: energy_N(CH3)3(CH2OH)]+
HOMO-LUMO analysis
| [N(CH3)4]+ | [N(CH3)3(CH2OH)]+ | [N(CH3)3(CH2CN)]+ | |||
| HOMO | LUMO | HOMO | LUMO | HOMO | LUMO |

|

|

|

|

|

|
| -0.579 a.u. | -0.133 a.u. | -0.466 a.u. | -0.120 a.u. | -0.500 a.u. | -0.182 a.u. |
This is the 6-31G(d,p) energy fchk file for [N(CH3)3(CH2CN)]+: energy_[N(CH3)3(CH2CN)]+. And this is the 6-31G(d,p) energy fchk file [N(CH3)3(CH2OH)]+: energy_[N(CH3)3(CH2OH)]+.
How has the shape of the orbitals changed?
The LUMO of the three cations are very similar; only the OH and CN parts, of their respective LUMO, are noticably different. The HOMO of the [N(CH3)3(CH2OH)]+ and [N(CH3)3(CH2CN)]+ cations are noticably different to the HOMO of [N(CH3)4]+ cation. This is due the presence of the additional functional group; The AO orbital of the central N and the MO orbital of the CH3 "fragments" are (in general) not high enough in energy to interact with the antibonding MO orbital of the CH2CN/ CH2CN fragment. This is the reason why the HOMO of the [N(CH3)3(CH2OH)]+ and [N(CH3)3(CH2CN)]+ cations (mainly) enclose the CH2CN region of [N(CH3)3(CH2CN)]+ and the CH2OH region of [N(CH3)3(CH2OH)]+, respectively.
The reason why the LUMOs are so similar is because the bonding MO of the CH2CN/ CH2CN fragment are too low in energy to significantly contribute to the LUMO of [N(CH3)3(CH2CN)]+/[N(CH3)3(CH2OH)]+.
Has the energy of these orbitals moved?
Only slightly - the HOMO, and the LUMO, of the three cations are still similar in magnitude. The HOMO of [N(CH3)3(CH2CN)]+ and [N(CH3)3(CH2OH)]+ are both higher in energy than the HOMO of [N(CH3)4]+, this is because the HOMO of [N(CH3)3(CH2OH)]+ and [N(CH3)3(CH2CN)]+ both have a through-space antibonding interaction, the HOMO of [N(CH3)4]+ does not.
The LUMO of the [N(CH3)4]+ cation has a higher energy than the LUMO of the [N(CH3)3(CH2CN)]+ and a lower energy than the LUMO of the [N(CH3)3(CH2OH)]+ cations. This is because the LUMO of the [N(CH3)3(CH2OH)]+ cation has a direct (sigma) antibonding and a through-space antibonding interaction; the LUMO of the [N(CH3)3(CH2CN)]+ has a very strong direct (sigma) bonding interaction and a direct (pi) antibonding interaction - the strong sigma bonding interaction is much stronger than the (relatively weak) pi antibonding interaction, and this is the reason why the LUMO of the [N(CH3)3(CH2CN)]+ cation is lower in energy than the [N(CH3)4]+ cation.
Has the HOMO-LUMO gap changed in size?
Yes, the HOMO-LUMO gap of the has changed. The HOMO-LUMO gap for [N(CH3)4]+, [N(CH3)3(CH2OH)]+ and [N(CH3)3(CH2CN)]+ are 0.466, 0.346 and 0.318 a.u. (respectively).
What chemical impact could these changes have?
[N(CH3)3(CH2CN)]+ is the most reactive (oxidising) cation because it is more able to accept an electron because of the fact that its HOMO-LUMO energy gap is the smallest; the occupation of an electron in the antibonding LUMO is less destabilising for [N(CH3)3(CH2CN)]+.
Summary
The data obtained from this project can be explained rigorously by applying the various theories within physical and inorganic chemistry

