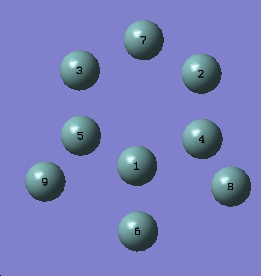
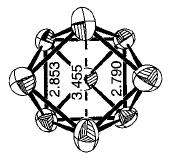
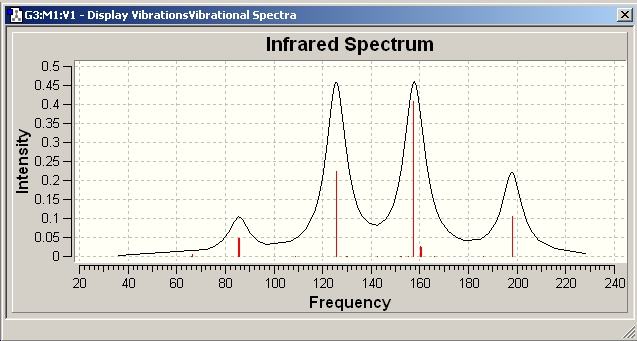
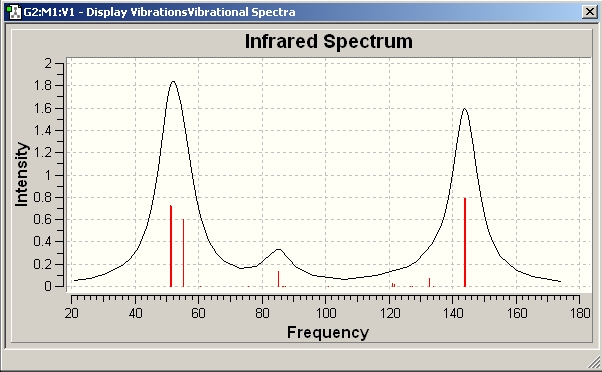
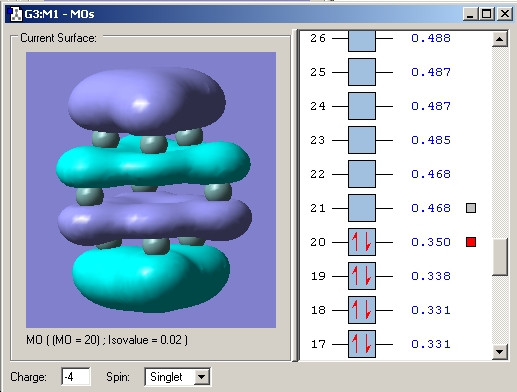
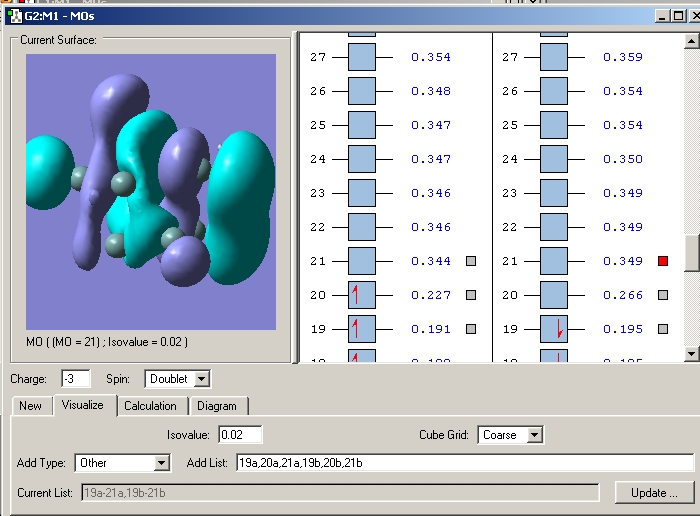
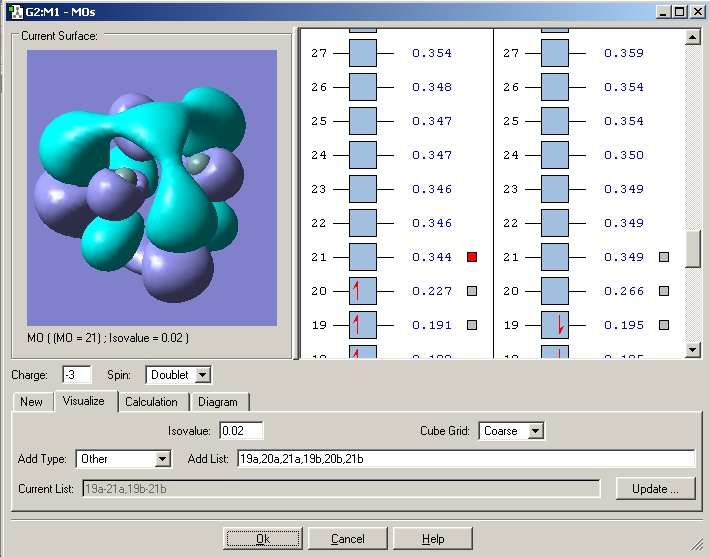
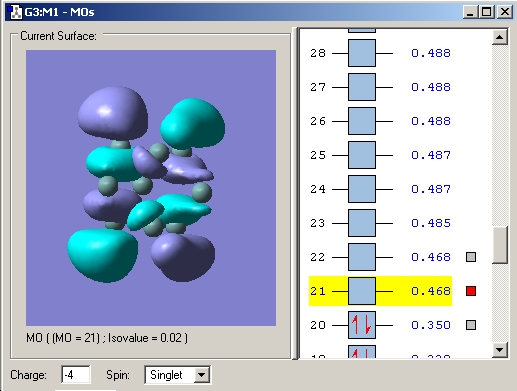
Rep:Mod:fleur1987
BH3 Introductory Module
BH3
A model of BH3 was created in GaussView as instructed in the online tutorial and the bond distance button used to set all the B-H bond lengths equal to 1.50000 amstrongs (even though this level of accuracy is beyond what can be calculated by these methods, it is what was input).
Changing the bond length
An optimization calculation was then carried out to find the optimium position of the boron and hydrogen nuclei in the molecule for this paticular electronic configuration.
This was done using DFT B3LYP method and 3-21G basis set.
The Gaussian output file FLEUR_BH3_OPT.log was then opened.
The optimised B-H bond distance was found to be 1.19435 amstrongs however this can be regarded as only accurate to 0.01 amstrongs figures, hence the distance is 1.19 amstrongs. This exactly matches that reported in the literature. [1]. The optimised H-B-H bond angle was found to be 120.0 degrees (accurate to 0.1 degrees).
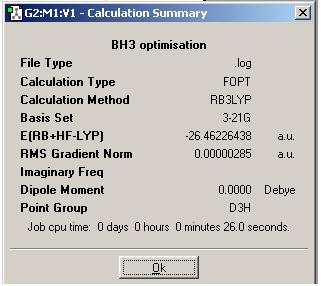
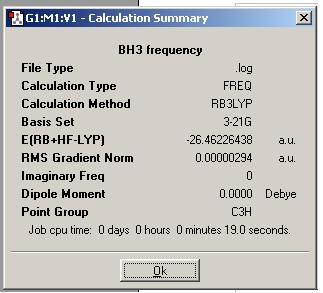
The results summary was then viewed and is shown below.
Note that the energy is given in atomic units where 1 atomic unit is 2625 kJ/mol. Note that the gradient is much smaller than 0.001 indicating that the molecule has actually been optimised.
The RMS gradient is the change in potential energy with the change in bond length (dy/dx) i.e. the first derivative of the potential energy surface. When this is zero the PES is at it’s minimum and the system is in equilibrium configuration.
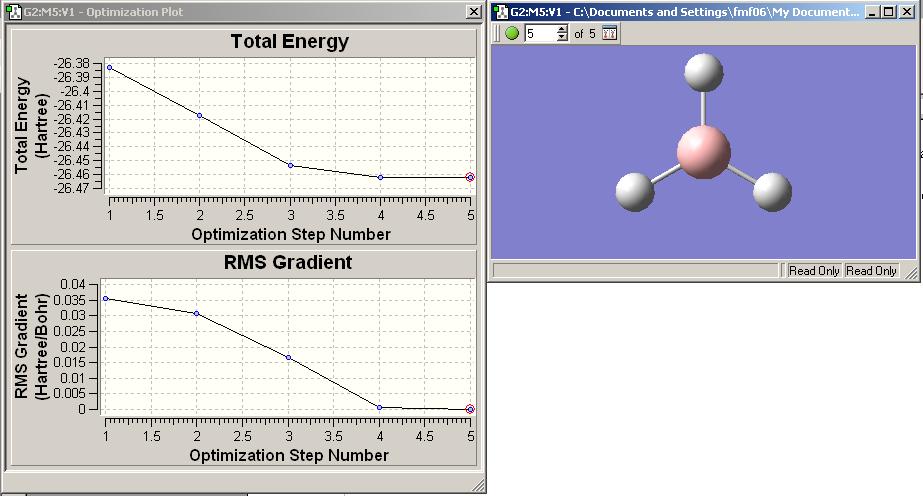
The total energy curve and RMS gradient curve for this optimisation is shown below.
BCl3
A molecule of BCl3 was created in GaussView and the symmetry set to "Very tight (0.0001)"
D3h.
The molecule was optimised using DFT B3 LYP method and this time a LanL2MB
Basis set was used. The B-Cl optimum bond length found was 1.87 amstrongs.
And the bond angles were exactly 120.0 degrees as the symmetry had been set to D3h.
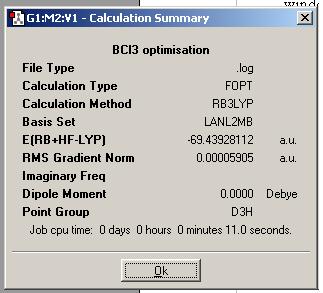
The results of the calculation are shown below.
The energy is in hartree and 1 hartree = 2625.5 KJ/mol. The error is about 1 KJ/mol or 3.8 x 10 -4 Hartree. Hence the energy is -69.439 Hartree.
The dipole moment is accurate to 0.001 debye and hence is 0.000 debye.
The frequency is accurate to the nearest 10 cm-1 but by convention are reported to the nearest cm-1. An imaginary frequency was not reported.
Independent work
The small molecule I chose was AlCl3
AlCl3 was created in GaussView as outlined for BCl3 in the introduction.
The point group was constrained 'very tight (0.0001)' to D3h (not C1 as shown in printscreen).
The molecule geometry was then optimised using the DFT B3LYP method and the LanL2MB basis set as my molecule contains non first row elements. As Al is in the same group (3) and only one row down from B in the periodic table the same methods that gave good results when used for BCl3 are expected to give good results for AlCl3. As the same method and thus the same approximations have been used the two sets of results obtained can be compared.
The log file was then opened and the following information obtained.
The energy is in hartree and 1 hartree = 2625.5 KJ/mol. The error is about 1 KJ/mol or 3.8 x 10 -4 Hartree. Hence the energy is -46.910 Hartree or -123162 KJ/mol.
The dipole moment is accurate to 0.001 debye and hence is 0.000 debye, indicating a planar structure of D3h symmetry.
The frequency is accurate to the nearest 10 cm-1 but by convention are reported to the nearest cm-1, however this job did not return an 'imaginary frequency'.
Bond length 2.32 amstrongs, This is longer than the 1.87 amstrong optimised radius for BCl3. This observation can be rationalised by considering the fact that as the periodic table is descended the molecules get larger and the atomic orbitals become larger and more diffuse, hence bonds become longer and weaker. The reported literature Al-C bond length for a terminal Al-Cl bond is 2.289 amstrongs for the gas phase Al2Cl6 diamer. Hence the obtained results are in good accord with literature data and sensible values have been obtained by the calculation.
Bond angles 120.0 degrees as the point group was constrained to D3h.
The final co-ordinates obtained from the log file were:
Center Atomic Atomic Coordinates (Angstroms)
Number Number Type X Y Z
1 17 0 0.000000 2.323667 0.000000
2 17 0 2.012355 -1.161834 0.000000
3 17 0 -2.012355 -1.161834 0.000000
4 13 0 0.000000 0.000000 0.000000
Where atomic number 17 is a Cl molecule and 13 is an Al molecule.
This molecule can be found at:
https://www.ch.ic.ac.uk/wiki/index.php/Image:Fleur_alcl3_opt.gjf
https://www.ch.ic.ac.uk/wiki/images/3/3a/Fleur_alcl3_opt.gjf
Vibrational Analysis
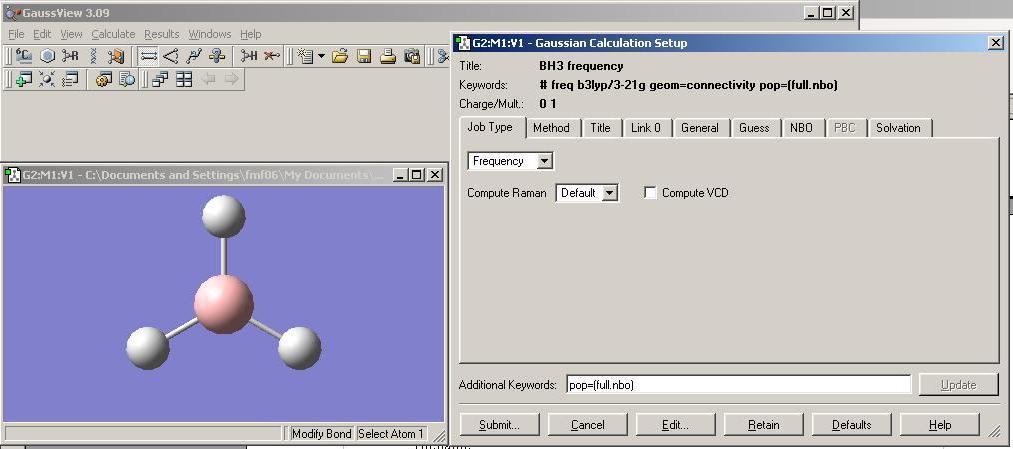
A copy of the BH3 molecule created and optimised earlier was opened in GaussView and renamed. A Gaussian frequency calculation was then set up and the additional keywords pop=(full,nbo) typed in to request a full analysis of the electron density and MOs of BH3 also.
The job was then submitted to Gaussian. The completed file was checked to see if the calculation had actually been carried out by looking at the ‘Result Summary’ shown below. Looking at the energy one can see that it is in fact the same as that obtained for BH3 during the optimisation calculation (see above) and hence the structure is the same.
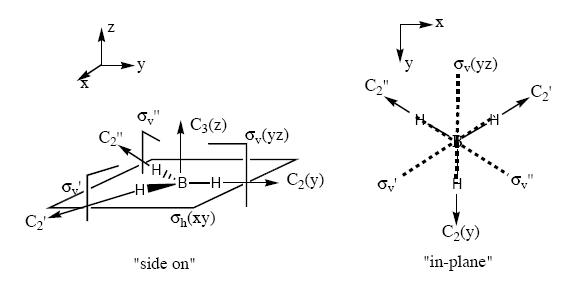
Note that the assigned point group has now changed to C3h. Examination of the molecule reveals that this is not in fact the point group, and the point group is still D3h as the BH3 molecule still contains the symmetry elements shown in the diagram below (taken from Patricia Hunt's year Molecular orbitals lecture notes). This is in accord with the experimental observation[2] and calculated spectra which predicts an intensity of 0.0 for the 2593 cm-1 mode. If the structure was in fact C3v this mode would result in a small change in dipole moment and thus would have a small but finite predicted IR absorption. Also the reported dipole monent of 0.00 (no net dipole) is only possible if the molecule is planar (i.e. has D3h point group).
The output file was then opened and the vibrations checked for negative frequencies, which there were none implying that the molecule is at an energy minimum.
6 vibrational frequencies were reported.
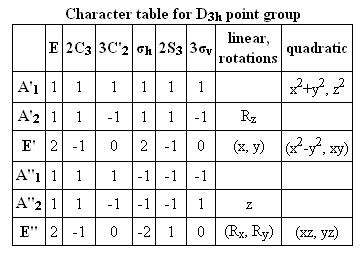
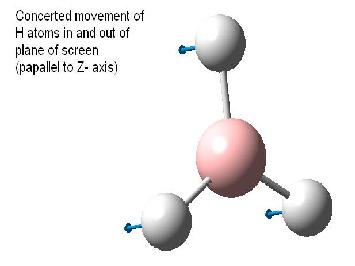
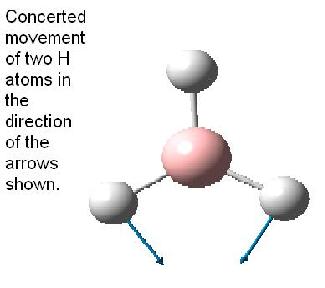
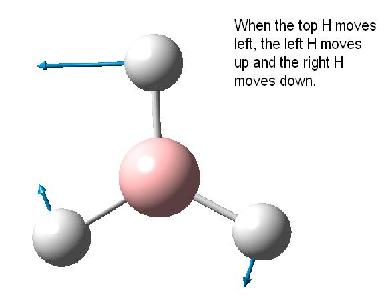
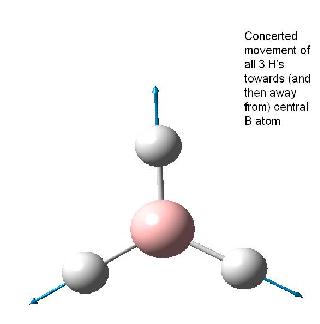
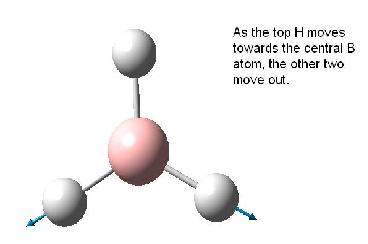
The table below reports the frequencies, intensities and symmetry labels of the stretches. Note that the axis are defined such that the z-axis is coincident with the C3 (highest order) rotation axis, the y-axis is the horizontal axis and the vertical axis is the x-axis. Note the molecule is viewed at a slight angle to enable visualisation of the form of the vibration. Symmetry labels were derived from examination of the character table for D3h as this is the point group of BH3, shown below.
Character Table D3h
Vibrational Frequency table
Frequencies of vibrations have been rounded to the nearest integer. Intensities have been rounded to one decimal place. The obtained vibratinal frequencies were compared to those obtained from infrared diode laser spectroscopy[3][4] and found to be very similar indication that the calculation ran correctly and that this method and basis set are appropriate to model the BH3 molecule.
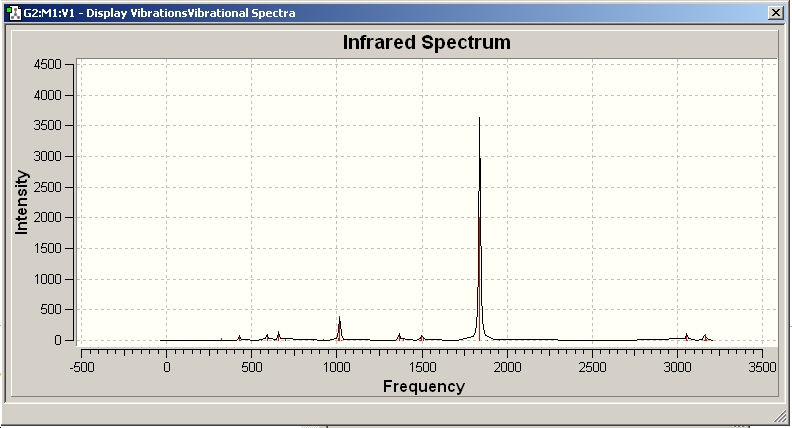
IR Spectra
Only 3 peaks can be seen here. This is as vibrations 2 and 3 are degenerate and hence appear at the same frequency. This is also true of vibrations 5 and 6. Vibration 4 does not result in a change of dipole moment and hence this stretch is not IR active according to the IR selection rules and thus will not be seen on the IR spectra.
Molecular Orbitals
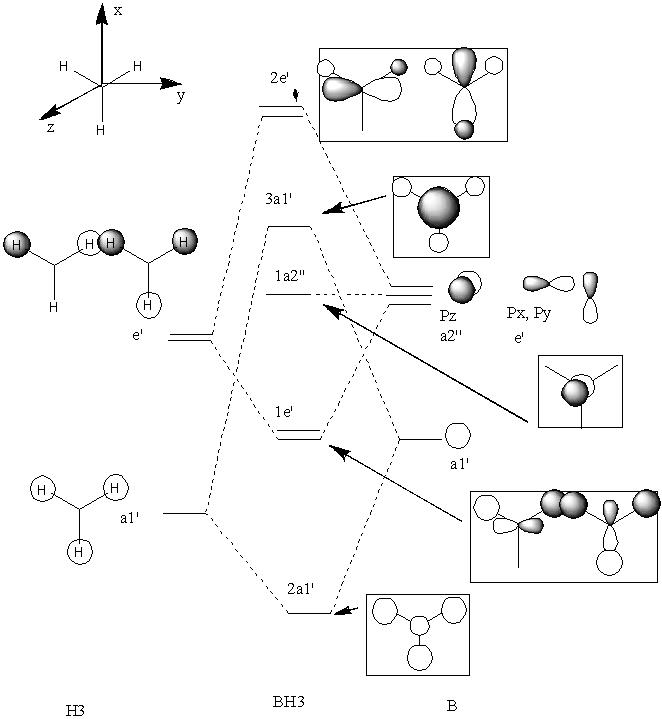
BH3 is a trigonal planar molecule with the point group D3h. The MO diagram is shown below
MO diagram
The molecular orbitals were calculated by opening the checkpoint file of the optimised BH3 molecule and running the calculation as outlined previously, this time putting pop=full into the additional keywords to switch on the MO analysis.
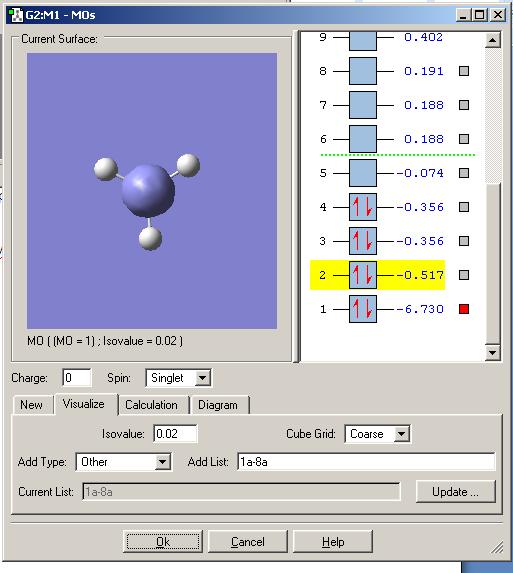
The MO’s were then visialised in GaussView, the resulting MO energy levels are shown below.
Comparing these to those predicted from qualitative MO theory (i.e. those in the diagram above) it is clear that the appearance/form of the MO’s is the same for both qualitative and quantitative calculations. Hence qualitative MO theory is very useful for predicting the appearance of the MO’s, it is very accurate in this respect for the filled MO’s. Upon examination of the unoccupied MO’s one can see that they deviate slightly from those predicted by qualitative MO theory. For example the 3a1’ orbital is predicted to have a large region of one phase around the central boron atom and 3 smaller out of phase lobes around each H. However the qualitative MO calculation predicts that all 4 will be of approximately equal size. This arises as the unfilled orbitals are more diffuse and hence their form harder to predict.
One striking difference is that qualitative MO theory placed the degenerate 2e’ orbitals as the highest energy wheras quantitative placed the 3a1’ orbital as highest energy. This arises as without calculation it is difficult to predict the energies of the orbitals when drawing an MO diagram. Hence essentially the ordering is an educated guesss and hence sometimes may be incorrect. This is especially true of the high energy antibongding orbitals, it is hard to predict which will be higher from examination alone. This is a limitation of qualitative MO theory.
Isomers of Mo(CO)4L2
Models of cis and trans Mo(CO)4(CH3)2 were built in order to analyse the predicted frequencies and compare them to what is expected from application of IR selection rules and what is observed experimentally for similar systems. Note that PPh3 is a more usual ligand but the phenyl groups are large, if they were used in the calculation the job would take a long time. Hence they have been replaced in this example with CH3 groups as these are smaller and thus much less demanding to compute.
The method used for optimising the structures and computing the frequencies is briefly outlined below.
Firstly models of cis and trans Mo(CO)4(CH3)2 were built in GaussView. A gaussian calculation was then set up for an initial optimisation using a low level calculation method and a small basis set. This is as the two structures which need to be optimised are large and hence if a higher level calculation was carried out without a pre-optiisation the job would take a very long time. By carrying out a pre-optimisation the total time for completion of the job is shortened and the computational demand lessened, saving both time and money.
In order to do this the method (DFT) B3LYP (Becke 3 term with Lee, Yang, Parr exchange, a hybrid density functional) was used with the basis set LANL2MB. As this method has a low level of accuracy the convergence criteria were set to loose. This is as otherwise the convergence criteria would be more accurate than the accuracy that could be obtained by the calculation and hence would never converge. This would cause the job to fail.
The calculation setup window, along with the first few lines of the input file are shown below.
Setup
Input file
%chk=trans_opt1
%mem=6MW
%nproc=1
# opt=loose b3lyp/lanl2mb geom=connectivity
trans mo complex opt 1
0 1
Mo 0.63829785 -0.48936169 0.00000000
C 2.69829785 -0.48936169 0.00000000
O 4.01829785 -0.48936169 0.00000000
C 0.63829785 1.57063831 0.00000000
O 0.63829785 2.89063831 0.00000000 etc...
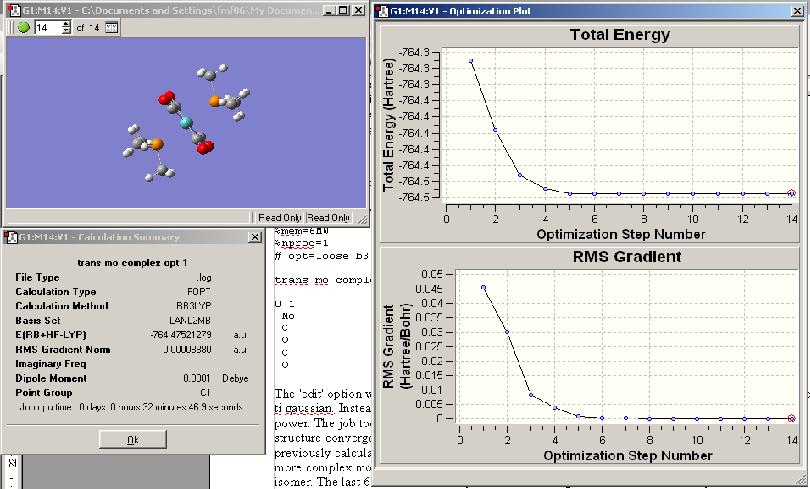
The 'edit' option was then chosen and the file saved under an appropriate name and NOT submitted to gaussian. Instead the input file was uploaded onto the scan server which has greater computing power. The job took 32 minutes and 49.4 seconds on this server. The optimisation of the trans structure converged in 14 steps and that of the cis in 16 steps, this is much larger than for the previously calculated BH3 molecule indicating the increased computational demand of optimising a more complex molecule. The plot of energies and RMS gradients is shown below for the trans isomer. The last 6 values are all very similar indicating that the level of accuracy of the calculation is not much higher than the convergence criteria, even though it was set to loose. Thus another optimisation is required in order to get satisfactory optimisation.
Using this output file as a starting point another gaussian calculation was set up as before this time using the LANL2-DZ basis set and setting the optimisation criteria very tight by typing int=ultrafine scf=conver=9 into the additional keywords section. This can be used as the method is now much more accurate and thus will converge even with a tight criteria. The job was then submitted to the server as before.
Examination of the log file (choose 'view file' option in GaussView) showed the output file to contain the following message:
Warning! P atom 10 may be hypervalent but has no d functions.
Warning! P atom 11 may be hypervalent but has no d functions.
In order to improve the calculation the phosphorus d orbitals were added by manually editing the .gjf file. The keyword 'extrabasis' was added to the start line and the following was typed at the end of the file in order to do this.
(blank line)
P 0
D 1 1.0
0.55 0.100D+01
****
(blank line)
This file was submitted for an initial optimisation as before without opening in GaussView and then further optimisation and frequency analysis carried out upon it.
Geometries of optimised structures
Cis
The output file resulting from the second optimisation of the file with the P d-orbitals included gave a molecule of the geometry shown in the Jmol below.
This calculation is also published to D-Space at the following location:http://hdl.handle.net/10042/to-1789
The second optimisation of the cis-Mo complex without the P d-orbitals included was also run for comparison.
This is published to D-space at the following location: http://hdl.handle.net/10042/to-1809
Examination of this structure shows that of the 3 the C-P bonds on each P(CH3)3 ligand, 2 are are gauche with respect to the Mo-CO bonds but one is ecliped with the Mo-P bond. The angle between the two P(CH3)3 ligands is 95.2 degrees, that between the P(CH3)3 ligands and the carbonyl ligand adjacent is 86.2 for one and 89.5 degrees for the other. Hence the two are not symmetrically equivalent, thus the reported point group is C1. However the structure only deviates slightly from one which has a higher symmetry C2v point group.The angle between two carbonyls in the same plane as the P(CH3)3 is 87.2. This can be rationalised by considering that the lowest energy consormation will be one that minimises the repulsion between the two bulky ligands (hence the angle between them is largest) whilst also minimising steric repulsion of the carbonyl ligands (that contain electronegative oxygens) with each other (hence this angle is the next largest).
One noteworthy point is that the Mo-C bonds trans to the P(CH3)3 ligands are 1.98 amstrongs whilst those cis are 2.03 amstrongs. This implies that the phosphine ligands are worse pi acceptors (or better sigma donors) than carbonyl ones, as this would mean that the relevant metal d-orbitals would have more electron density with which to backbond to the opposite carbonyl and hence increase the strength (and decrease the length) of the C-Mo bond. This bond shortening trans to P(CH3)3 is because CO has a stronger trans effect than P(CH3)3.
The Mo-C bond lengths are shorter than the Mo-P bond lengths (2.62 amstrongs), this can be attributed to the steric bulk of the PR3 group and also the strengthening of the Mo-C carbonyl bond via backbonding into the vacant pi antibonding orbital.
The overall structure is now a distorted octahedral geometry(as a pose to a regular octahedral structure which would be the case for e.g. Mo(CO)6). The reported point group in the output file is C1
Comparison to literature
In order to check that my calculations returned sensible results I searched the literature for experimental data. The complex cis-Mo(CO)4(P(CH3)3)2 could not be found, this is not surprising as originally I replaced larger groups with CH3 to reduce the computational demand of the calculations. The crystallographic data for the very similar cis-Mo(CO)4(P(CHex)3)2 was found[5] and used for comparison.
The numbering of the atoms is shown in the figure below
Atom Labels
| Literature | Calculated | Calculated (no P d-orbitals) | |
| Mo-P Bond Length (A) | 2.65 | 2.65 | 2.66 |
| Mo-C Bond Length trans/eq(A) | 1.92 | 1.98 | 1.98 |
| Mo-C Bond Length cis/ax (A) | 2.04 | 2.03 | 2.03 |
| P-Mo-P angle (degrees) | 104.8 | 95.3 | 95.3 |
| C2-Mo-C3 angle (degrees) | 84.2 | 88.9 | 89.0 |
| P1-Mo-C3 angles (degrees) | 86.5 | 89.5 | 89.5 |
| P2-Mo-C2 angle (degrees) | 84.8 | 86.1 | 86.2 |
As can be seen in the table above these calculations are very close to those obtained to similar structures in the literature. The calculations run where the P d-orbitals were included gave better correlation to literature, although only by a vary small amount, overall there was little difference. However as including them in the calculation gives more realistic results it was thee files that were used for later frequency calculations. As the compounds being compared are not the same, some of the differences can be attributed to the increased bulk of the “R” group on the phosphine ligand (cyclohexane is much larger than methane) which would increase the steric repulsion and hence would be expected to increase the P1-Mo-P2 angle and increase the Mo-P bond length. Thus the calculated results can be considered as very accurate.
Trans
The output file resulting from the second optimisation gave a molecule of the geometry shown in the Jmol below.
This calculation is also published to D-Space at the following location:http://hdl.handle.net/10042/to-1788
The optimisation was also run on the complex that did not have P d-orbitals added for comparison.
This can be found on D-space at the following loacation: http://hdl.handle.net/10042/to-1814
The C-P bonds are orientated so they are gauche to those on the opposite P(CH3)3 ligand to minimise the energy of the confomation. The P-Mo-C bond angles are 88.9 and 91.1 degrees and the C-Mo-C angles are 90.0 degrees. Hence this structure is much more symmetrical and resembles a regular octahedra much more than the cis isomer, with the only distortion being the slight deviation of the bond angles from 90 degrees. Hence the reported point group is C1 but is very close to having the much higher symmetry D4h point group.
The C-Mo bond lengths are all 2.03 amstrongs. The P-Mo bond lengths are 2.57 amstrongs, this is shorter than those in the cis isomer, as in the trans isomer the P(CH3)3 ligands are not adjacent and hence do not experience as much of an increase in steric repulsion with each other upon approaching the metal center. Also the carbonyl group has a strong trans effect (which results in an increase in bond length), in the cis isomer both phosphines are trans to a carbonyl wheras in the trans isomer neither are. This can also be seen by the carbonyl Mo-C bonds all having the longer 2.03 amstrong length and none having the 1.98 amstrong length that was reported in the cis isomer. This is as CO has a stronger trans effect than P(CH3)3 and in this complex all the CO groups are trans to each other.
Comparison to literature
The crystallographic data for rans-[Mo(CO)4(PCy3)2] was used for comparison to the calculated results as in the case of the cis isomer. [6]
| Literature | Calculated | Calculated (no P d-orbitals) | |
| Mo-P Bond length (A) | 2.54 | 2.57 | 2.57 |
| Mo-C Bond length (A) | 2.03 | 2.03 | 2.02 |
| C1-Mo-C2 angle (degrees) | 92.17 | 89.92 | 89.91 |
| P-Mo-C2 angle (degrees) | 87.08 | 88.02 | 89.04 |
As in the case of the cis isomer, the data corresponds well to that reported in the literature, with the values obtained from the d-orbital corrected calculations being very slightly closer to experimental values. The reason the results do not give the exact same values as those found from x-ray crystallography can be in part attributed to the fact that the literature values used for comparison are not for the same complex, but for one with more bulky P(cHex)3 phosphine ligands. As the values are similar to those obtained in literature it can be concluded that there were n mistakes in the calculation and that the basis set and method are appropriate for this type of complex.
IR Spectra
The IR spectra of both isomers were calculated as outlined for NH3.
The results for the cis isomer can be found at:http://hdl.handle.net/10042/to-1821
The results for the trans isomer can be found at:http://hdl.handle.net/10042/to-1820
The trans isomer has a high symmetry D4h point group and all the carbonyls are equivalent. Hence only one of the carbonyl stretching modes (asymmetric) is IR active and thus only one carbonyl peak is expected to be seen in the IR spectra.
In the cis isomer, the symmetry is lower (C2v) and hence four of the carbonyl stretching modes are expected to be IR active. Also, dues to the trans effect discussed earlier, carbonyls trans to phosphine ligands (as a pose to CO ligands which have a stronger trans effect) will have shorter, stronger C-Mo bonds and thus weaker CO bonds (as they experience more backbonding into the antibondong CO pi orbitals). As a result these carbonyls will absorb at lower wavenumbers.
Cis IR Spectra
The calculated vibrational frequencies were compared to cis Mo(CO)4(DPPE) as reported by Kayran et al. [7] as the literature IR data for cis-Mo(CO)4(P(CH3)3)2 was unavaliable, as was that for the complex to which the geometry was compared to in the previous section. The slight differences in the frequencies can be in part be attributed to the fact that I am comparing to a different complex. The symmetries of the stretches were assigned based on the character table for the C2v point group (even though the complex is slightly distorted from C2v, it is the closest symmetry i.e. the pseudo-symmetry).
Analysis of vibrations
| Vibration | Literature | Stretching frequency | Symmetry | |||
|
1889 | 1848 | B2 | |||
|
1908 | 1850 | B1 | |||
|
1928 | 1870 | A1 | |||
|
2017 | 1960 | A1 |
The B1 and B2 stretching modes are of very similar energy as they both involve the stretching of 2 carbonyl CO bonds in a way that is symmetric in either x or y. The A1 modes involve stretching of 4 carbonyl CO bonds and thus occur at higher wavenumbers, with the symmetric stretch being the one requiring the most energy.
Trans IR spectra
The IR spectra of the trans isomer showed only one CO stretching mode, in agreement from that predicted by taking into account it's pseudo-symmetry of D4h.
This calculated frequency was 1839 cm-1 corresponding to the asymmetric A2u stretching mode. This is in accord with the literature IR for trans Mo(CO)4(P(cHex)3)2 [8]which also showed a single carbonyl stretching frequency at 1870 cm-1. The difference in the values is as the two complexes contain different phosphine ligands.
Vibration |
Thermal Stability
Energies
The results summaries for the cis and trans isomers are shown below. Note that both RMS gradients are very small hence the calculations both converged sucessfully.
Cis isomer
Trans results
The energy of the cis isomer is -2030457 kJ/mol
The dipole moment is 8.879 debye
The energy of the trans isomer is -2030450 kJ/mol
The dipole moment is 0.000 debye
Hence the cis isomer is of a lower energy, and hence more stable, but only slightly. The energies could be reversed by changing the three methyl groups on the phosphine ligand for more bulky/sterically demanding groups such as ethyl or n-butyl. This would greatly increase the steric repulsion in the cis isomer raising it's energy, and hence the trans isomer would be more stable. In the case of PPh3, ligand dissociation occurs more readitly than cis to trans isomerisation and so this group although bulky enough to change the relative stabilities of the two, would not result in much cis to trans isomerisation.[9]. However more recently it has been found that the gas phase cis isomer of Mo(CO)4[PPh3]2 is predicted (from DFT calculations, method and basis set not mentioned in mapaer) to be more stable than the trans from by 72.98 kJ/mol (rationalised by the electronic staabilisation possible in this form) implying that the reason for the trans isomer being more stable is not due to sterics vs electronic stabilisation alone, but also due to environmental and entropic factors. [10]
Ammonia
Symmetry
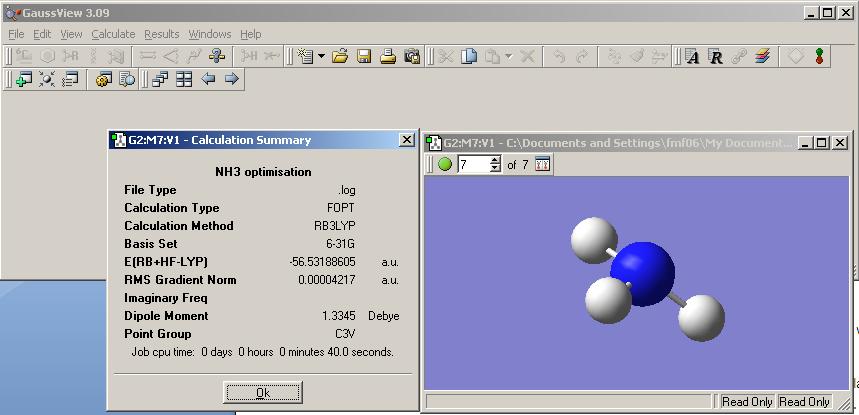
A molecule of NH3 was built in GaussView and a Gaussian optimisation calculation. This was set up similarly to the one previously outlined for BH3.
For the following calculations B3LYP method and 6-31G basis sets were used. As BH3 is a similar molecule to NH3 it is reasonable to assume that the B3LYP will also give good results for NH3.
6-31G is a larger basis set than 3-21G (which was used for BH3). The larger basis set is used to give a greater accuracy to the calculations.
The results file was opened and the symmetry was found to be C3V as expected from inspection of the molecule.
Next another NH3 molecule was drawn in GaussView and one of the N-H bonds modified to be 1.01 amstrongs (i.e. the C3 symmetry of the molecule was removed). This molecule was optimised as before, this time choosing ‘ignore symmetry’ in the general tab.
The results file showed the symmetry of the optimised molecule to be C1 symmetry. It is worth noting that the optimised NH3 has all 3 N-H bond lengths equal (found using the inquire button in GaussView.) One of the angles between the H-N-H bond differed from the other two H-N-H angles by 0.005 degrees (116.143 vs the other two at 116.137). However as the calculation only reports angles with an accuracy of 0.01 degrees, rounding to this number of significant figures gives the same angle (116.14 degrees). However a slightly different angle and dipole moment is in accord with the reported lower symmetry C1 point group as a pose to the higher symmetry C3V point group found for the previous model of NH3.
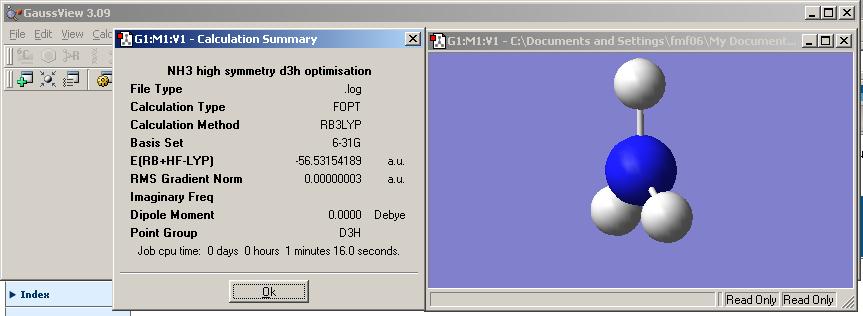
The file nh3_b3lyp_d3h.txt was copied into notepad and saved as a .gjf file. This was then optimised as for the previous two examples and the results file viewed. Note that this molecule represents the planar transition state (of inversion process) and resembles BH3 in that it has D3h symmetry. The results file was viewed and is shown below.
Note that this mlecule is planar and hence does not have a net dipole.
Symmetry Groups
At this point it seems relevant to include a quick reminder of the definitions of the symmetry groups as this knowledge will be useful when analysing results.
Definitions:
Cn = a rotational axis where rotation about it by 360/n degrees leaves the molecule unchanged.
Sigma v = a mirror plane parallel to the z axis.
Sigma h = a mirror plane orthogonal to the z axis.
E = the identity symmetry element, does nothing to the molecule.
Sn = rotation by 360/n followed by reflection in a plane orthogonal to the rotation axis leaves the molecule unchanged.
C1
Molecules which are left unchanged when only the symmetry operation E is performed on them have C1 symmetry. This is a very low symmetry point group where the molecule is essentially not symmetric at all!
C3V
Molecules with C3v point group have symmetry elements E (and are thus a subgroup of C1), 2C3 and 3 sigma v.
D3h
Molecules with D3h point group have symmetry elements E (and are thus a subgroup of C1), 2C3 and 3 sigma v (and are thus a sugroup of 3Cv) and 3C2, 2S3 and sigma h.
Analysis of results
Symmetry:
The three NH3 molecules were given different symmetries when they were input into the gaussian calculation. The resulting optimised structures also have different structures. The most marked difference is between the D3h and the C1/C3v structures. Whilst the C1 and C3v point group structures appear pyramidal in shape the D3h group by definition is planar.
The C3v and C1 structures appear the same upon initial examination but closer examination reveals them to be slightly different, and their reported symmetries are not the same (see results summaries above).
Using the inquire button in GaussView to analyse the optimised N-H bond lengths and H-N-H angles one can see that the optimised bond length increases as symmetry decreases and the H-N-H angle decreases as symmetry decreases. (this is logical and could be predicted by considering tetrahedral vs trigonal planar geometries in the case of C3v and D3h so this is a good indication that the calculations are correct).
It is also interesting to note that as C1 is by definition less symmetric than C3v and does not contain symmetry elements other than E, the optimised structure does not have all the H-N-N angles and N-H bond lengths the same. Whiles the accuracy of the calculation is not great enough to make these differences significant when reporting the bond lengths and H-N-H angles, it is worth noting that the Gaussian calculation has reported them as slightly different and hence maintained the C1 symmetry rather than allow it to go to C3v. The unrounded data obtained straight from GaussView is shown below to demonstrate this. Note that the accuracy of the calculations is not this high (as mentioned previously).
N-H bond lengths and H-N-H angles
Hence a molecule cannot 'break symmetry' during an optimisation. This is worth keeping in mind when carrying out optimisations on highly symmetric molecules as if the input file is not symmetric the output file will not be either, as exemplified by the C1/C3v structures.
The literature values for C3v ammonia is 1.017 amstrongs and the H-N-H angles is 107.8 degrees.[11] This shows that the basis set and method used are not that accurate but give values comparable to those observed experimentally and hence this method and basis set would be good as a first optimisation.
Time of calculations:
Increasing the symmtry of the NH3 increased the time taken to run the calculations. Examination of the Results summary revealed that the C1 calculation took 10 seconds, wheras the higher symmtry C3v calculation took 15seconds and the very high symmetry D3h calculation took 1 minute 16 seconds (this seemed very long and repitition of the calculation after rebooting the laptop took only 33 seconds and gave the same results). Thus the higher the symmetry the longer the calculation takes as the program has more constraints to abide to when optimiseing the geometry.
All the RMS gradients were checked and found to be very close to zero implying all optimisations had been carried out correctly and the equilibrium structures found.
Thus from the above two observations one can conclude that if one has a high symmetry structure to optimise it is necessary to define the symmetry in the inut file as the moleculae cannot break symmetry in the calculation and also allow more time for the calculation. As higher symmetry calculations are more computationally demanding, optimising larger structures may require submitting the calculation to a scan/alternative server as a standard computer or laptop my not have be able to cope with the job.
Energies:
The energies are given in a.u. Or Hartree in the shown results files (see earlier) where 1 Hartree = 2625.5 KJ/mol and the error is approx 1 KJ/mol. The converted energies rounded to the appropriate number of significan figures are given below.
The energy of the C1 NH3 is – 148424 KJ/mol
The energy of the C3v NH3 is -148424 KJ/mol
The energy of the D3h NH3 is -148423 KJ/mol
This result shows that the D3h structure, which represents the transition state for inversion, is only 1 KJ/mol higher energy than the other two isomers (which represent the ground state). This energy difference did seem anomalously low and so a literature search was performed in order to compare my results to those obtained by others by ab initio calculations. In order to check my calculation was correct the RMS gradient was examined and found to be much smaller than 0.001 indicating the calculation converged correctly. In the literatere [12] HF calculations gave and inversion barrier of 22.0 KJ/mol and MP2 gave 25.1 KJ/mol No calculations using the same method and basis set used for my analysis (DFT B3LYP and 6-31G) assumably because this is much less accurate than others. The accuracy (no. of decimal places they report) is also greater as the calculations I ran.[13]
The input files were examined and appeared to not contain any mistakes. The calculations were set up and run again just in case, but the same results were obtained. Hence the very low difference can be attributed to the inaccuracy of the method and small basis set used. The C1 is slightly lower energy than the C3v but this is not significant and when the accuracy of the calculation is considered they are essentially the same energy.
Effects of changing the method and basis set
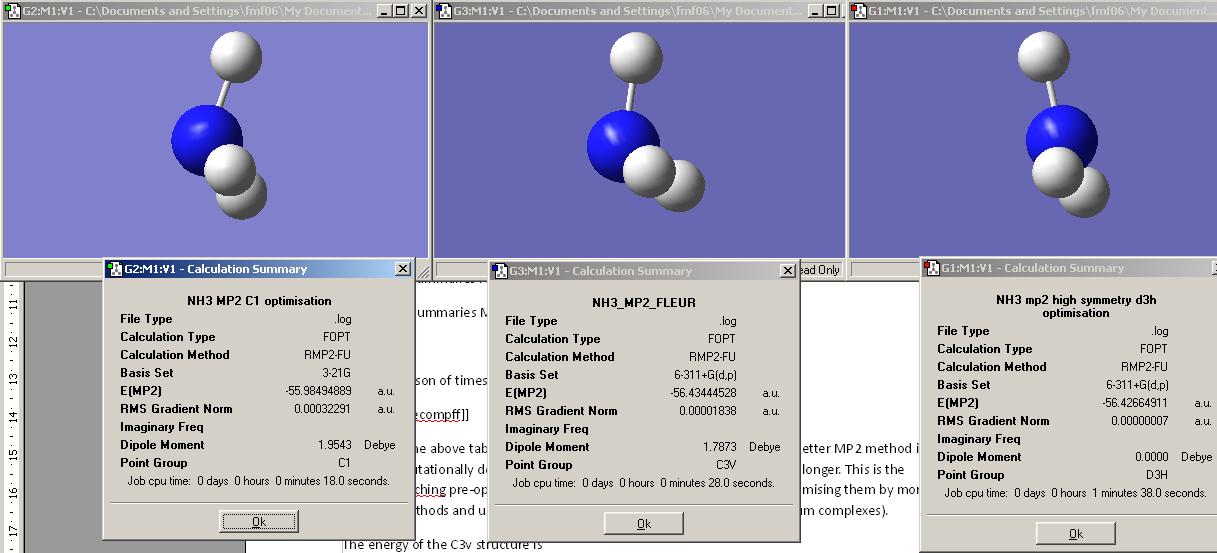
Another molecule of NH3 was made from scratch in GaussView. This time when optimising the structure, the MP method was used rather than the DFT method and the larger 6-311+G d,p basis set was used. The option include all electrons was picked.
This was repeated for a C1 type structure where the bond length had been altered (as above).
The file nh3_mp2_d3h.com was also used to run an optimisation of the planar NH3 using this method.
The results summaries for these three calculations are shown below.
Results Summaries MP2 calculations
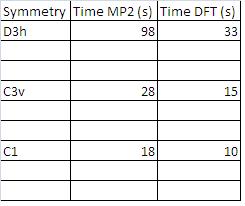
Comparison of times taken to complete calculations
Examining the above table one can see that in using the larger basis set and better MP2 method is more computationally demanding and thus the calculations take significantly longer. This is the rationale beching pre-optimising structures using a small basis set before optimising them by more accurate methods and using larger basis sets (as was done for the Molybdenum complexes).
The energy of the C3v structure is -148168 KJ/mol
The energy of the D3h structure is -148148 KJ/mol
Hence the barrier to inversion as predicted by this level of calculation is 20 KJ/mol. This is much higher than that predicted by the previous lower level calculation but is also more realistic as if the transition state was only 1 KJ/mol higher than the ground state the inversion would be too fast to be observable at most temperatures above 0K.
Comparison to the experimentally measured inversion barrier of 24.3 KJ/mol reveals the second method to be much more accurate than the first. However it does not agree completely with experiment and a larger basis set/ more accurate method (such as CBS (complete basis set) or G2) would be expected to give a result even closer to that experimentally derived.
Percent error DTF calculation = (1 - 1/24.3) x 100% = 96.0% extreemly inaccurate.
Percent error MP2 calculation = (1 – 20/24.30) x 100% = 17.7 % accuracy greatly improved.
The H-N-H bond angles in the C3v structure were 109.4 degrees. This is much closer to the experimentally observed H-N-H angle of 107 degrees indicating the increased accuracy gained by using a better method and larger basis set. The N-H bond lengths in the were 1.00 amstrongs (same as previous B3LYP calculation). Literature experimental values and calculations for NH3 bond lengths (by HF and MP2 methods) are in good accord with the results obtained by MP2.[14]
HF:1.000 amstrongs
MP2:1.011 amstrongs
Expt:1.012 amstrongs
The Inversion Mechanism
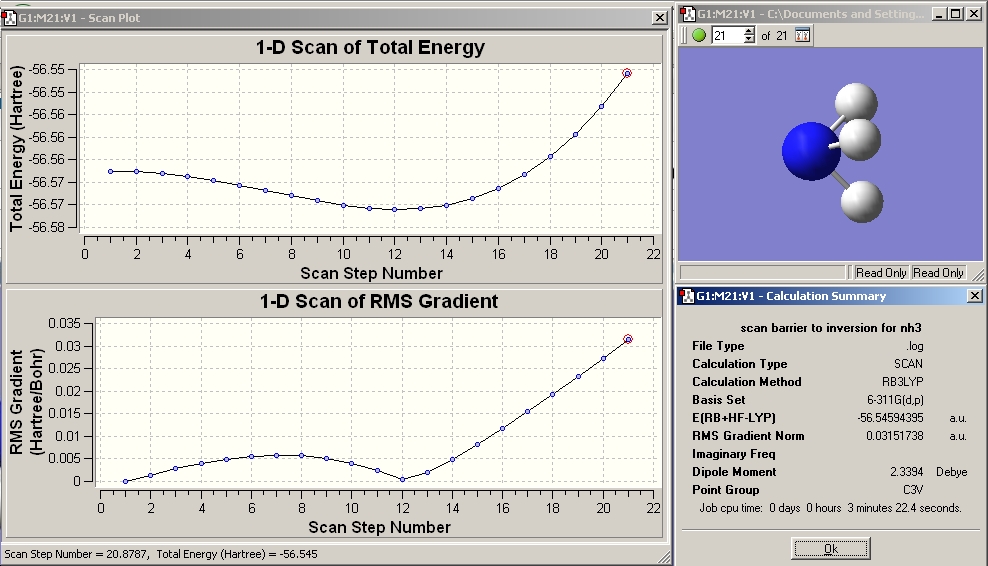
The link to the file nh3_scan_log.txt was opened in GaussView. The file nh3_scan_com.txt was downloaded and the calculation run. These two processes were done as an exercise to understand the scan method used to connect the D3h and C3v structures together on a reaction path. Below is shown a graph of the potential energies and RMS gradient of the scan along with the geometry of the final structure of NH3 at it's energy maxima. The energy minima corresponds to the ground state c3v structure and the initial starting point (local maxima on left of graph) correspons to the D3h planar NH3 transition state.
The online web page and information in the cited references were used to gain insight into the reaction path of the inversion mechanism.
Vibrational Analysis
The frequencies of the B3LYP/6-31G C3v and D3h optimised structures of NH3 were calculated as previously outlined in this wiki page (see BH3 section). The energies were checked to be the same as those obtained from the optimisation to ensure the correct calculation had been carried out.
The vibrations were animated and found to appear very similar to those of BH3. This make intuitive sense as the ground state NH3 molecule has C3v symmetry which is a subgroup of D3h. The transition state has the same symmetry and hence one would expect vibrations of the same symmetry as only the bond length (and thus strength) is different, not the geometry.
Vibrational Frequencies
D3h vibrational spectra
C3v vibrational spectra
It is worth noting that one major difference in the vibrational spectra that arises as a result of symmetry is that in the D3h transition state the vibrational mode with a1' symmetry has no absorbance as it does not result in a change in dipole moment wheras the C3v ground state has a small but finite absorbance for the corresponding a1 mode as this results in a small net change in dipole moment of the molecule and hence is IR active.
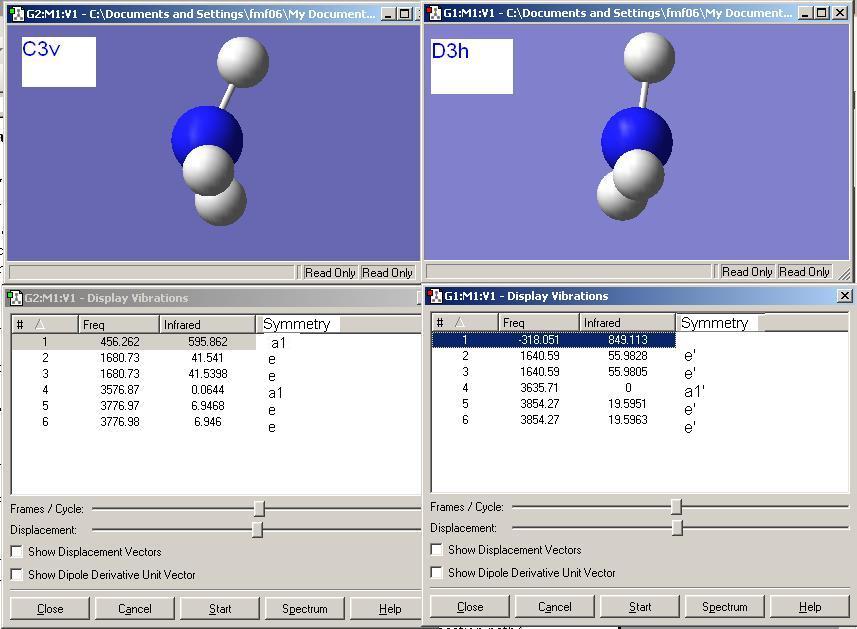
As shown above the D3h has 5 positive frequencies and one negative frequency. The negative frequency is present because this is a transition state and when visualised this vibration (-318 cm-1) corresponds to the umberlla like inversion mechanism of NH3. The corresponding C3v stretch that follows the inversion mechanism is the one at 456 cm-1.
The C3v structure has 6 positive vibrational modes, analagous to BH3.
The vibrational modes of both structures have been matched up in the table below (the C3v molecule was been orientated so that the simialrities between the vibrational modes are obvious in the screenshots).
C3v and D3h Comparison Table
Comparison to Literature
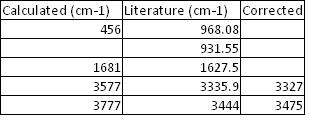
The stretching frequencies calculated for the C3v ground state are compared to those found experimentally in the literature in the table below. As the method used is known to overestimate the stretching frequencies an arbitary correction of -8% was applied and the results of this are shown in the 3rd table.
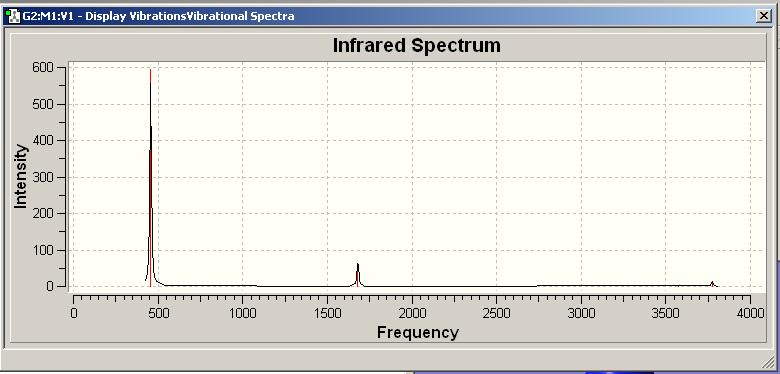
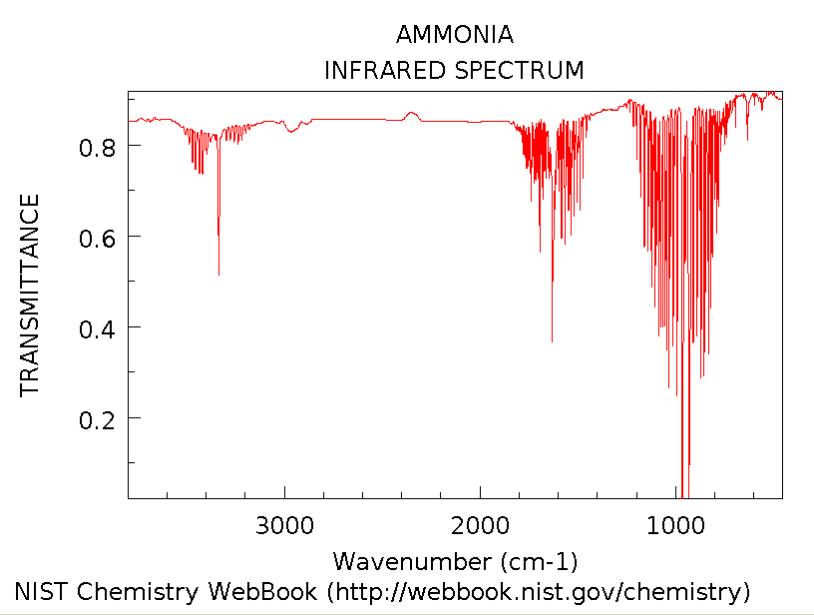
The major difference is that in the real spectra the band around 900 cm-1 is double, (see spectra from literature). This is due to the tunnelling of the lone pair through the nitrogen in the ammonia molecule. This inversion process causes a division between the states that are symmetrical with respect to inversion, and those that are asymmetrical. The band separation is the total inversion splitting/difference. The corresponding frequency obtained from calculation is the one at 456 cm-1. This does not match that reported experimentally. This could be due to the fact that the IR spectra in the literature was not recorded below 900 cm-1. However a more likely explination is that this method calculated the energy difference between the C3v ground state and the D3h transition state as only 1 Kj/mol. This is much lower than that observed experimentally/ obtained from higher level calculations. The stretching frequency at 456 involves going via the D3h structure and thus if the energy difference between these two is underestimated by the calculation, the stretching frequency will be as well. [15]
Mini Project - Ge9 Zintl Anions
This mini project explores some of the observed properties of the Ge9 zintl anions introduced in the third year Advanced Main Group Chemisrty course.[16]
A zintl anion is a polyatomic anion of a post transition-metal/semimetal.They are formed when the metal of interest is dissolved in either NH3 or elthylene diamine along with an alkali metal. The zintl phase forms when the pauling electronegativity difference between the two metals is approximately 0.4 . When this is the case electrons are almost completely transferred to the more electronegative post transition metal/semimetal towhilst maintaining some type of metallic bonding character. The zintl anions can be isolated by addition of 222-cryptand. This allows them to be crystallised and hence their structure determined.
They are named after Edward Zintl who first reported their formation and composition in the 1930's and sparked much further interest into the field. [17] Of the compounds being investigated the 4- and 3- have been characterised and their structure confirmed[18] but that of the 2- anion has not. It was crysallised but the crystal structure was so defective that the structure could not be determined, only the charge. Hence the structure of this anion must be guessed/ predicted and this is where computational chemistry can be usefully applied.
The anions of interest also display some unusual and interesting structural and chemical properties[19] and I feel a deeper understanding of these properites can be obtained from carrying out computational calculations and analysing the results, hence this is the motivation behind this project.
Aims of this project
To predict the structures of the three Ge9 zintl anions using structure optimisation calculations and see if the obtained results are in accordance with those reported in literature.
To see if the cluster structures obay Wades rules[20] and thus predict if they are HOMO aromatic or not and use this to rationalise their reported reactivity.
To calculate the MO's of the clusters in order to further investigate their possible HOMO aromaticity and visualise the cluster bonding interactions. To use the obtained MO's to rationalise the structural effects of reduction. To compare the results with those obtained in the literature and thus compare the results obtained from using different methods and basis sets on the zintl clusters.
To compute the energies of the three anions and see if this can account for the reports that all three exist as an equilibrium in ammonia/ethylene diamine solution. To use the obtained data to try to predict the position of this equilibrium.
To compute the predicted frequencies of the cluster vibrations and see if and how they differ for each complex and try to rationalise the results.
To compute the relative energies of the triplet and singlet Ge94- anions and use this along with the computed MO's to try to rationalise the reported multiplicity of the cluster.
Structure of the Ge92- zintl anion
Method
The Ge9 cluster was drawn in GaussView. A pre-optimisation was carried out using the B3LYP method and LANL2MB basis set (small). The convergence criteria were set to loose (as outlined for Mo comlexes earlier in this wiki). The charge of the cluster was changed to 2- so that the first few lines of the input file were as shown below:
%chk=ge92-_loose_opt
%mem=6MW
%nproc=1
# opt=loose b3lyp/lanl2mb geom=connectivity
Ge9 2- opt 1
-2 1
Ge -3.21210158 2.10772688 0.15335105
Ge 1.00066424 0.66091839 0.15335105 ... etc.
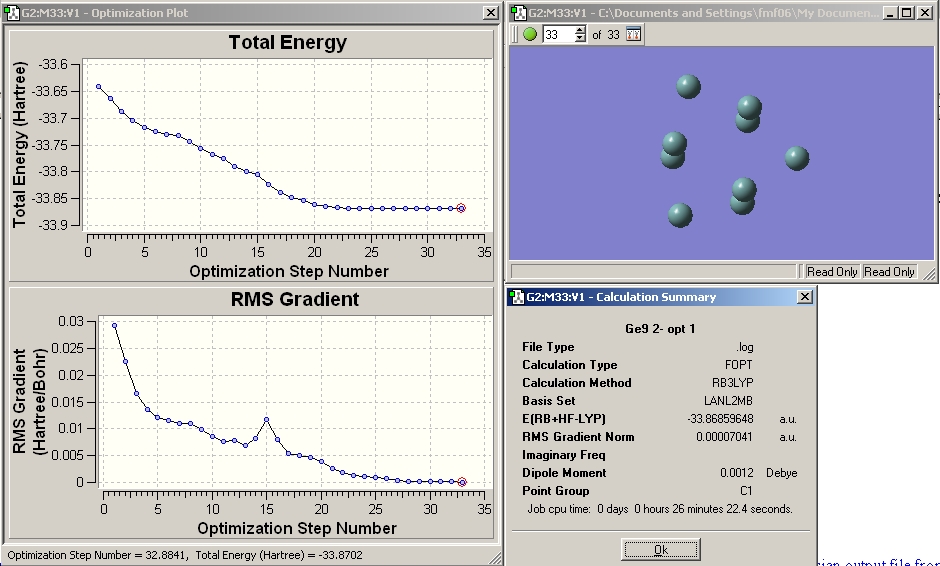
The calculation was submitted to the chemistry server. The resulting gaussian output file from this calculation was downloaded and opened in GaussView. The results summary is shown below. It was checked to ensure that the RMS gradient was below 0.001 (i.e. that the calculation converged). The calculation was also checked by calculating the frequencies and ensuring the resultant energy obtained for the structure was the same (i.e. that both calculations gave the same structure and thus a minimum has been reached). The data obtained from these calculations in discussed later in the project.(Note - this checking by frequency analysis was done for all the optimisations carried out in this miniproject)
Another optimisation was then run (as outlined previously for Mo complexes) using the larger basis set LANL2DZ and the additional keywords int=ultrafine scf=conver=9
which makes the convergence criteria tight.
The first few llines of the input file are shown below:
%Chk=ge92-opt2.chk
%nproc=1
# opt b3lyp/lanl2dz geom=connectivity int=ultrafine scf=conver=9
Ge9 2- opt 2
-2 1
Ge -1.82521400 0.12553000 1.59949300
Ge 0.79649900 -1.64545200 1.60092400 ... etc.
This was also submitted to the chemistry server and the output file opened in GaussView.
The results file was checked to ensure the calculation converged as before and can be seen below.
Structure of the Ge92- zintl anion
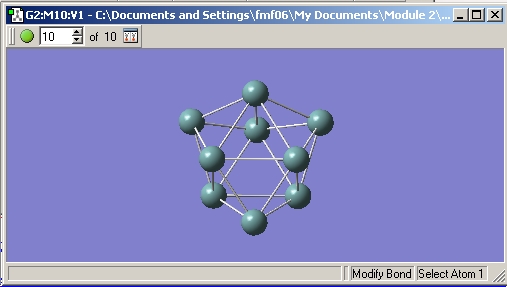
The resulting structure of the Ge9 2- anion was a tricapped trigonal prism.
It can be found on D-space at: http://hdl.handle.net/10042/to-1865
The structure can be seen more clearly on the diagram below which has had bonds drawn in manually.
Wades Rules
Structures of clusters comprised of group 14 elements bearing a relatively small number of substituents can often be rationalised using Wades rules (originally developed for Boron clusters).[21]. In order to see if these rules were applicable to the zintl anions the predicted structure was calculated ;
9 Ge atoms = 4 x 9= 27 electrons
2- charge = 2 electrons
9 lone pairs = -18 electrons
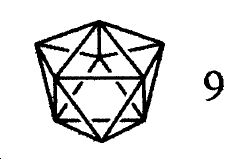
Total skeletal electrons = 20 = 10 pairs = n+1
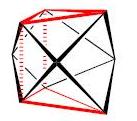
This corresponds to a closo structure with 9 vertecies shown below.(picture taken from reference)
9 vertex cluster structure predicted using wades rules
Comparison of this to the structue obtained shows them to be very similar and hence wades rules are applicable to this system. This implies that the bonding is not simple 2 atom-2 electron bonding but rather delocalised cluster bonding. Closo clusters often diplay '3D aromaticity' , this idea will be investigated further by calculating the MO's of the cluster.
The cluster is not a regular one however as all the bond lengths are not equal. The vertical bonds are all equal (and the angles between them and the base are all 90.0 degrees), the bonds making up the triangular bases are all equal (and the angles between them are all 60.0 degrees), and the bonds from the 'capping atoms' to the 'prism' atoms are all equal.The bond lengths of the highlighted bonds are shown in the table below.
| Bond | Bond length (Amstrongs) |
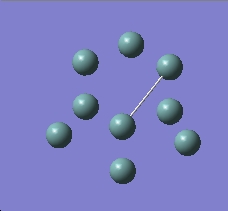 |
2.99 |
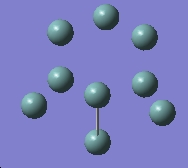 |
2.96 |
 |
2.75 |
Comparison to literature
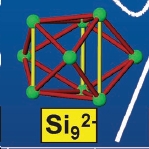
As the Ge9 2- zintl anion crystallises in such a highly defective form when isolated with 222 cryptand, the authors who crystallied it in the literature were unable to determine the structure, bond lengths and angles from the data they obtained. However, the structure of the lighter Si9 2- group 14 zintl anion has been characterised[22]. Whilst bond lengths will obviously be different for the different elements due to them having different radii etc. the overall structures would be predicted to be the same thus the comparison is still useful. The structure of the Si9 2- cluster was found to be a tricapped trigonal prism (see picture below, taken from reference 19), hence my calculation result is in accord with literature (and wades rules) and seems sensible. Thus I can assume that the calculation ran correctly and that the method and basis set are sufficiently accurate and appropriate for use on Ge9 zintl anions.
Structure of the Si92- zintl anion
Effect of reduction to Ge93- and Ge94-
Upon reduction of the Ge92- zintl anion the structure is reported to change from a tricapped trigonal prism, to a monocapped square prism (structure d) in diagram, taken from reference) or a distorted tricapped trigonal prism with some of the vertical edges elongated(structures b) and c) in diagram). Interestingly the stretching appears to occur along 'hinges' and many of the bonds remain the same length in all 3 structures. These are the bonds between the base atoms(that form a regular triangle) and the bonds between these atoms and the capping atoms.[23]
In order to investigate this unusual observation the optimised geometries of the 3- and 4- clusters were calculated, using the same methodology as outlined for Ge9 2- above, but this time changing the charge. The Ge9 4- cluster was reported to be a singlet and so the multiplicity entered was 1, as it was for the 2- zintl anion.
Ge9 3- (spin contaminated)
The Ge9 3- is reported to be a monoradical with one unpaired electron i.e. S = ½. Using the rule Ms (multiplicity) = (2S+1) this anion has Ms = 2 and is a doublet. This data was put into the calculation so that the top few lines of the input file were as follows (multiplicity highlighted in bold);
%Chk=ge93-opt1
%nproc=1
- opt=loose b3lyp/lanl2mb geom=connectivity
Ge9 3- pre-opt 1
-3 2
Ge -1.82521400 0.12553000 1.59949300
Ge 0.79649900 -1.64545200 1.60092400 ... etc.
As a result of there being an unpaired spin, an unrestricted calculation must be carried out as there are unpaired eletrons, thus the wavefunction of every individual electron must be calculated. This is in contrast to the restricted shell calculations carried out for molecules with S=0 (i.e. singlet 2- and 4- Ge9 clusters, where the wavefunction of each paired electrons is assumed to be the same as the one it is paired with).
The pre-optimisations and optimisations were run on the chemistry server as previously outlined for the 2- cluster.
The Ge9 3- structure obtained from the calulation can be seen below.
It can be found on D-space at: http://hdl.handle.net/10042/to-1866
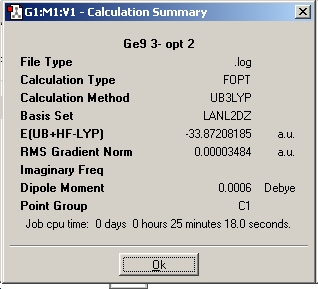
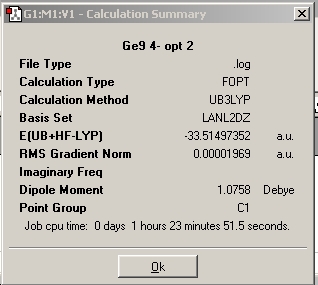
The results summary of the Ge9 3- calculation is shown below. The RMS value was checked to ensure convergence had occurred, which it had.
Note that the distortion of the structure results in the reported dipole for the 3- anion being double that of the Ge9 2- anion (0.0003 vs 0.0006). However both values are very small and the difference is only 0.0003 debye which my be considered insignificant as the calculation is only accurate to 0.001 debye.
As just over twice as many wavefunctions muct be calculated (as are carrying out an unrestricted calculation), the calculation took a longer amount of time than it did for the singlet clusters. The log file was checked for spin contamination. by examining the output file. This gives a value of S2. If the spin os 0.5 (doublet) then this value should be 0.25 , wheras if the spin is 1 (triplet) then this value would be 1, if the spin was 0 (singlet) this value would be 0 and if spin contamination has occurred then the spin will be somewhere in between these values implying that the calculation has mixed the spin states. The reported S2 value was 0.7500 implying that spin contamination had occured in this calculation. Measures can be taken to avoid this occurring in calculations but they are above the level of this course (and the knowledge of the demonstrator asked) so at this point the best thing to do is analyse the spin contaminated file but bear in mind that the results obtained from it may not be as accurate as expected due to this unfortunate occurance. When a frequency analysis was carried out the output file had a different energy and this shows that spin contamination had resulted in the optimisation calculation not returning a minimum optimised geometry. The geometry obtained from frequency analysis was therefore also analysed and it's structure shown to display trends much more in accord with those found in literature.
Ge9 3- Restricted - Open calculation
Later consultation of a different demonstrator and research into the Gaussian online manual revealed that use of a 'restricted-open' shell calculation will calculate all the wavefunctions except the singly occupied one using a restricted calculation and the one with the unpaired electron in using an open one, preventing spin contamination in the calculation. Thus the Ge9 3- calculations were run again. I have included the spin contaminated data in order to highlight the possible effects of spin contamination in calculations and the importance of examining the output files using notepad after each calculation. The results of the 'R-O' calculation are shown below. The results summary was checked to ensure calculation had converged and it was found that this file did not converge. The file was also spin contaminated despite being run using a restricted open type calculation.
The significan line in the log file can be seen here.
>>>>>>>>>> Convergence criterion not met.
SCF Done:  E(ROB+HF-LYP) =  -33.7923087244     A.U. after  129 cycles
            Convg  =    0.8639D-02             -V/T =  3.8123
            S**2   =   0.7500
Annihilation of the first spin contaminant:
S**2 before annihilation     0.7500,   after     0.7500
Results Summary
Energy from Optimisation:-88722 Kj/mol
This is higher than that obtained from the spin contaminated calculation which converged under the tighter convergence criteria and so data from this calculation was used instead.
The optimisation calculation can be found on D-space at:http://hdl.handle.net/10042/to-1939
Ge9 4-
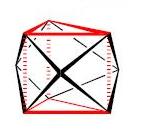
According to wades rules the Ge9 4- structure should be a nido monocapped square antiprism (shown below) of C4v symmetry.
Anothe possible structure is a distorted tricapped trigonal prism of D3h symmetry, like the 2- anion.
Two above figures taken from ref 23.
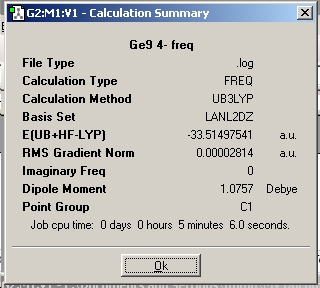
The results summary was checked in order to assure that the calculation converged. This is shown below.
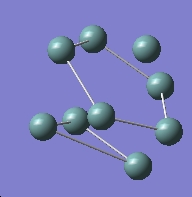
The geometry is shown below and can be found on D-space at : http://hdl.handle.net/10042/to-1867
Note that the reported dipole moment is larger than it was for the other two anions.
Comparison of structures
The three anions structures are compared to each other in the table below. Note that bond lengths are quoted to 3 decimal places, as a pose to 2. This is as a larger basis set and more accurate method have been used than for calculations previously carried out for BH3/NH3 (where the B3-LYP and 3-21 or 6-21 basis set (small) were used). Searching of literature and research into the methods and basis set show that using this level of calculation, three decimal places are often reported and the calculations are this accurate for most systems. [24]
The atom numbering system is shown in the diagram below;
Numbering System
Comparison Table
Literature values from "Conformation Isomerism of Nonagermanide Ions. Crystal Structures of Brown and Red [K-([2.2.2]crypt)]6Ge9Ge9·(ethylenediamine)x (x = 0.5, 1.5), Thomas F. Fssler, and Uwe Schtz Inorg. Chem., 1999, 38 (8), 1866-1870• DOI: 10.1021/ic981157j"
Looking at the pictures and the jmols the structures of all 3 clusters appear very similar. However examining the table above one can see that the structure is moving from a tricapped trigonal prism of D3h symmetry to a more distorted structure of C1 symmetry that resembles the tricapped trigonal prism but has two lengthened sides (like structure c) in figure above). For the 2- anion the bases have the angles between Ge1 Ge2 Ge3 (or 4,5,6) as 60.0 degrees and all the bond lengths are the same thus the bases are equilateral triangles. This is in accord with the literature. (see highlighted red triangles on figure above). As the cluster is reduced the bond lengths within the triangle begin to differ from each other, but only very slightly, (by a maximum of 0.004 amstrongs) and an overall approximate equilateral triangle base shape is maintained. One interesting point to note is that whilst the bond lengths increase along the prism's vertiacl edges, they decrease around the bases, i.e. these triangles get smaller. Examination of the MO's of each of the clusters may help provide some insight into this.
For the Ge3- anion the observed values and trends seen in the obtained data (from my spin contaminated calculation) for the prism heights is not in accord with that found in literature. The prism heights are all similar/the same wheras in the literature they are markedly different. This may be due to the spin contamination of the calculation I carried out, or may just be a limit of the method used. Examination of the prism heights for the frequency analysis output structure (which had a lower energy)carried out from the spin contaminated structure showed these bond lengths to follow the trend reported in the literature, backing up the idea that spin contamination is the cause of the anomaly.
For the Ge9 4- anion, whilst the bond lengths were overestimated by the calculation (likely a result of the structure not being in the gas phase but rather crystallised phase in the literature) the overall structure (a distorted tricapped trigonal prism with three different prism heights) is accurate.
This is not in accord with the structure predicted from wades rules, this deviation from ideal cluster formation has also been observed for Sb9 4- clusters [27]. The intermediate geometry between the nido and closo wades rule structures is characterised by the dihedral angle around the uncapped 'square face'. In a monocapped square antiprism this angle would be zero. The literature reports an angle of 16 which is in accord with the dihedral angle of 16.0 between Ge1-Ge9-Ge6-Ge8 in the calculated structure.
For all the complexes, the distances between the capping atoms differed for the different faces in the cluster, as did the distance from the capping atom to the atoms on the top and bottom triangular faces, in the literature wheras the structures obtained from calculations were more symmetrical in this respect. Most of the bond lengths also deviated somewhat from literature. This is probably dues to a number of factors outlined below.
Some reasons for deviation from literature
The calculations I ran are designed to minimise the energy assuming the molecule is in gas phase. The crystal structures in the literature are obviously solid phase and so this will cause deviations.
A crystal structure is a 'snapshot' or static picture of a crystal system that is actually moving/vibrating.
The Ge9 zintl anions are not a very well characterised series and there are many reported geometries and parameters .This compound is known to crystallise in different forms and there is much variation in the reported parameters in the literture, (see references 23 onwards). Even within one paper many different lengths and angles were reported for the 3- anion.[28] There is also much debate about weather the crystals containe the 2- and 4- cluster, or just two different versions of the 3- cluster.[29]
The Ge9 anion displays different structures when it is isolated as the zintl phase Ce3/4Ge9[30]
The zintl anion can only be crystallised upon addition of a cryptand to give [K+-crypt]3Ge93-. The addition of the large bulky cryptand ligand will have an effect on the crystal packing and the structure of the anion as it may be distorted into a different geometry in order to fit into the crystal lattice.
The Ge94- anion is known to crystallise in 4 different cluster structures [31]
The anion may be in a metastable state that it is kinetically trapped in but is not the lowest energy conformation.
The level of calculation and the method may not be accurate enough to provide reliable data
Spin contamination of the calculation may have affected the results for the 3- cluster.
The method B3LYP is not the most accurate one possible. If more computational power and time were avaliable (it was recommended that B3LYP be carried out on these molecules), higher level MP2 calculations may give results that correrlate better to the literature, as this method is more accurate.
Frequency calculations
The literature reports that the three zintl anions are in equilibrium in solution. Examination of the predicted structures and their similarity explains the ease of going from one to the other. In order to try to rationalise this further their relative energies were computed. In order to ensure an energy minima had been reached by the optimisation calculation the energy from frequence analysis and from optimisation were compared (as shown in the comparison table below). NB errors in calculation approximately 1kJ/mol so this is what energies have been reported to.
Comparison of energies of the Ge9 zintl anions
| Ge9 2- optimisation KJ/mol | Ge9 2- frequency KJ/mol | Ge9 3- optimisation (spin contaminated) KJ/mol | Ge9 3- frequency KJ/mol (spin contaminated) | Ge94- optimisation KJ/mol | Ge9 4- frequency KJ/mol |
|---|---|---|---|---|---|
| 89416 | -89416 | -88931 | -88833 | -88120 | -88120 |
Note the difference in the energies for the 3- cluster due to spin contamination of the optimisation calculation. The frequency analysis returned a structure that was higher in energy but corresponded better to literature trends in terms of bond lengths and geometry. This can be found on D-space at:http://hdl.handle.net/10042/to-1876 Repitition of the calculation using a restricted open shell gave a structure that was in accord with literature in that the 3 bond lengths making up the prism heights varied (3.373, 3.377 and 3.374 which is the same as those obtained by the frequency analysis of the spin contaminated structure).
Energy from optimisation:-88722 KJ/mol
This is higher in energy than for the spin contaminated calculation and is also spin contaminated so data from this structure was not used. frequency analysis gave a different, higher energy again (-88639 kcal/mol) so this calculation is inaccurate. Examinations of the files with a demonstrator and re-running the calculations gave the same result so the unrestricted spin contaminated results that converged were used for comparison in favour of the RO ones that didnt converge. Due to time limitations and limited knowledge of the reason why the calculation didnt converge the problem of spin contamination of this anion was not resolved.
From the data obtained it can be seen that the tree structures are not very close in energy. However the zintl phases are generated in a solution of a group1 alkali metal and ammonia. This solution effectively containes solvated electrons and is highly reducing, thus reduction can occur and the three zintl phases can exist in eqilibrium.
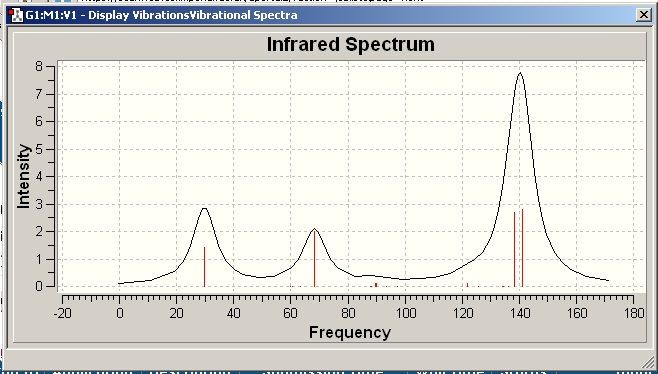
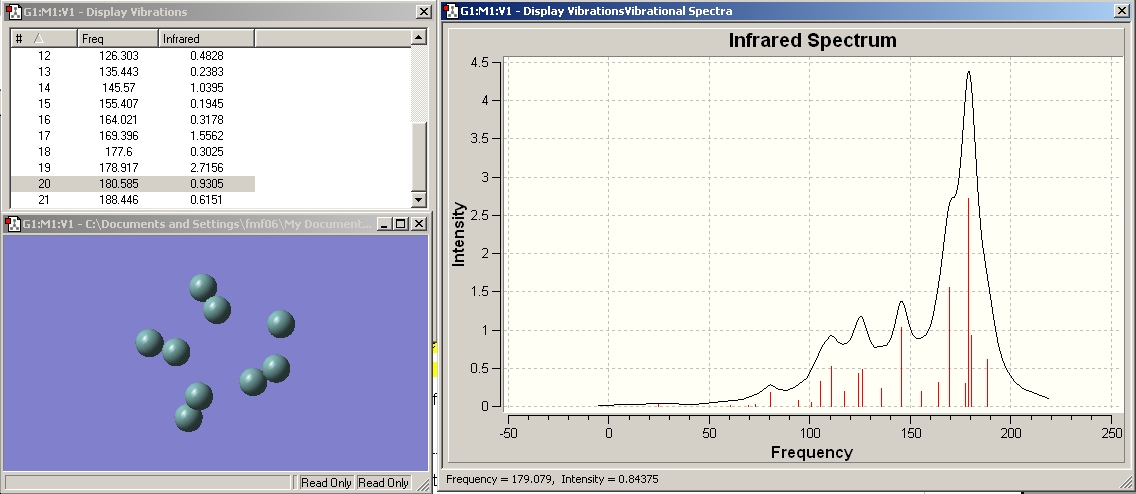
The spectrum obtained from the calculations can be seen below, as expected they differ from each other significantly.
Ge92-
Found on D-space at :http://hdl.handle.net/10042/to-1877
Ge93-
Found on D-space at:http://hdl.handle.net/10042/to-1876
Ge94-
Could not publish to D-space
Comparison of common vibrations
Given the general lengthening of the bond length I would predict the vibrations of the Ge clusters to occur at lower wavelengths as the series is progressed / the cluster goes from bearing a 2- charge to a 4- charge.
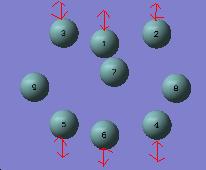
I would expect the stretching frequency corresponding to stretching the atoms that make up the bases to increase from the 2- to the 4- structure as these bond lengths decrease. The relevant vibrations were visualised in GaussView to see if this was the case.
| Vibration | Ge92- frequency | Ge93- frequency | Ge94- frequency |
|---|---|---|---|
1. 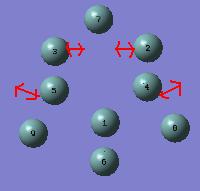 |
66 | 55 | 68 |
2. 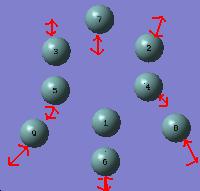 |
186 | 134 | 100 |
3.  |
155 | 101 | 94 |
The stretching frequency of vibration 1. which corresponds to stretching the bonds making up the base of the prism displays the expected trend when we go from the 2- cluster to the 4- cluster. The increase in wavenumbers corresponding to a decrease in bond length. The 3- cluster does not follow this trend, showing the lowest stretching frequency of all. This can be explained by measuring the distance between the atoms in the frequency output file in gaussview. This reveals them to be 3.11 amstrongs which is longer than in either of the other two clusters.
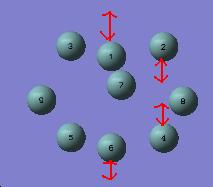
Vibration 2. corresponds to stretching all the bonds in the cluster in a breathing mode type fashion. This diplays the expected trend of reducing across the series as the bond lengths get longer.
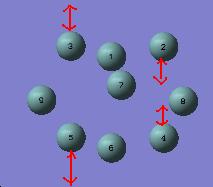
Vibration 3. corresponds to stretching of all 3 bonds making up the prism edges (heights) and decreases as expected across the series as the length of these bonds increases.
I wuold expect there to be 1 stretching frequency for the 3 prism height bonds as they are all the same length (and thus strength so vibrations are degenerate) in the 2- charged structure. In the other two clusters the vertical prism edge bonds are all different lengths and hence I would expect their stretching frequencies to be non degenerate
Ge92-
Examination of the vibrations revealed a stretching mode at 160 cm-1 that was doubly degenerate and corresponded to stretching the prism edges, as shown below. This is in accord with what was predicted from analysis of the structure.
Ge93-
As the lengths of the bonds Ge 2- Ge4 and Ge3- Ge5 are almost the same I would expect their stretches to be of the same energy. This is seen in the predicted spectra where two degenerate modes are reported at 126 cm-1.The length of the Ge1- Ge6 bond is slightly longer and therefore expected to occur at a slightly lower stretching frequency. This is seen at 121 cm-1.
Ge94-
The bond lengths are now more markedly different and display stretching frequencies , at 121 cm-1 and 122cm-1 (these vibrations correspond to the degenerate vibrations at 160 cm-1 in the 2- cluster. The degeneracy of this mode has been removed as all 3 bonds are no longer the same strength but all different strengths.). At the rest of the atoms in the molecule move differently in these stretches the difference between them may be exaggerrated
Conclusions Although the calculation for Ge9 3- must be treated as inaccurate due to spin contamination, the rest of the calculations appared to be accurate. As can be seen above all 3 differently charged clusters show very different IR spectra prdicted as the change in structure and bond strengths gives rise to different vibrational modes occuring and different imodes causing net dipoles. If an IR spectra of the Ge9 cluster could be recorded (no literature data was found for this) then identifying exactly which cluster was present may be possible. In the literature different authors give contrasting opinions as to whether a Ge9 3- crystal with two different cluster geometries has been obtained from crystallisation with 222-crypt or a mix of Ge2- and Ge4-. As the IR spectra are predicted to be different for the two ions this technique could possibly be used to resolve the dispute.
MO calculations to rationalise effects
Upon reduction a number of the bond lengths change.
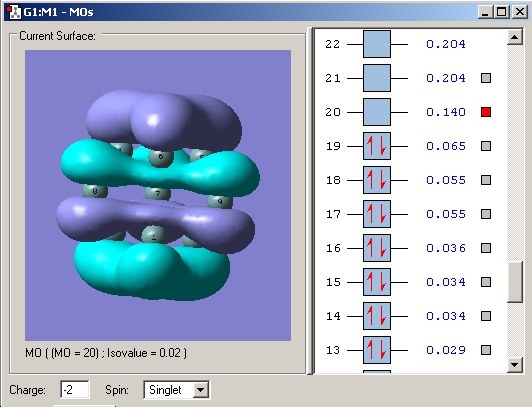
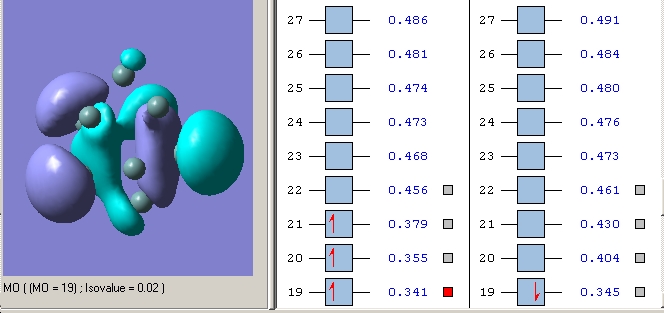
In order to try to rationalise the change in structure the MO'S of the three clusters were modelled. The results for the 2- cluster can be seen in a table below.
| Orbital | MO picture |
|---|---|
| LUMO+1 | 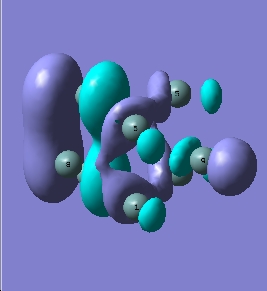
|
| LUMO+1 | 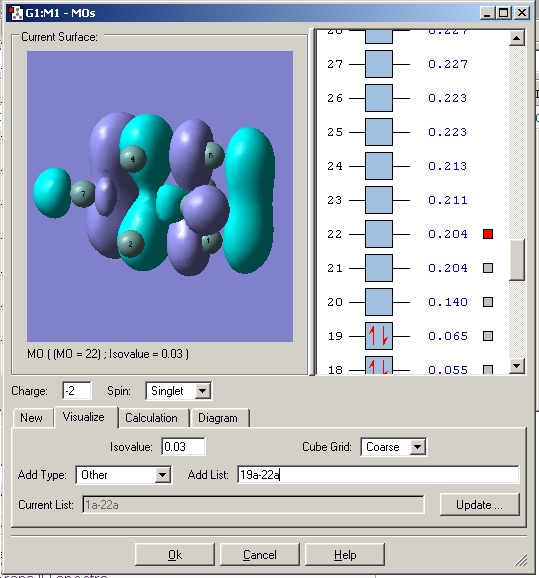
|
| LUMO | 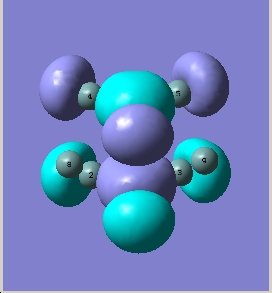
|
| HOMO | 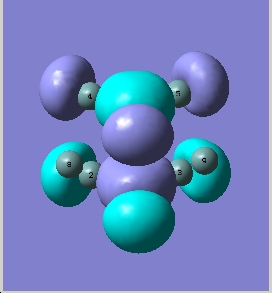
|
| HOMO-1 | 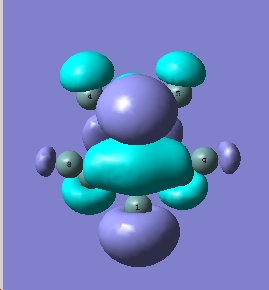
|
| HOMO-2 | 
|
| HOMO-3 | 
|
| 4th lowest energy | 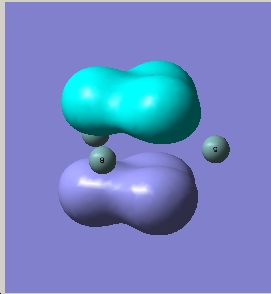
|
| 3rd lowest energy | 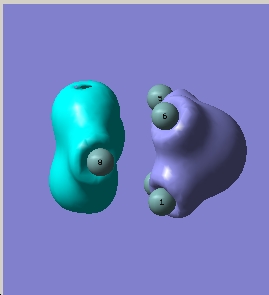
|
| 2nd lowest energy | 
|
| lowest energy | 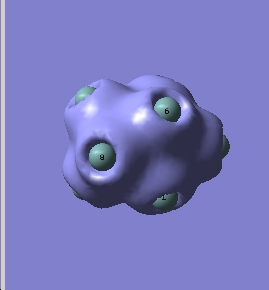
|
Comparison to literature
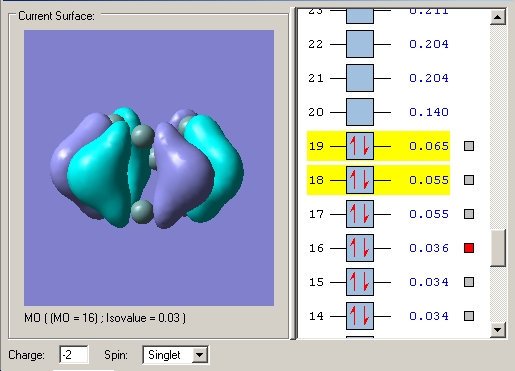
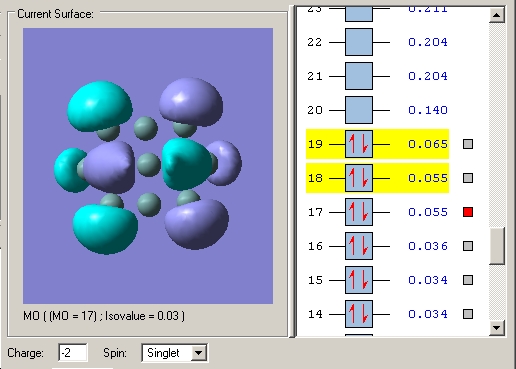
In order to ensure that the MO's obtained by my calculation were correct, they were compared to those found in literature (ref.19). My calculated MO's and energies were in accord with those in the literature.(qualitative, the actual energy figures were not given).
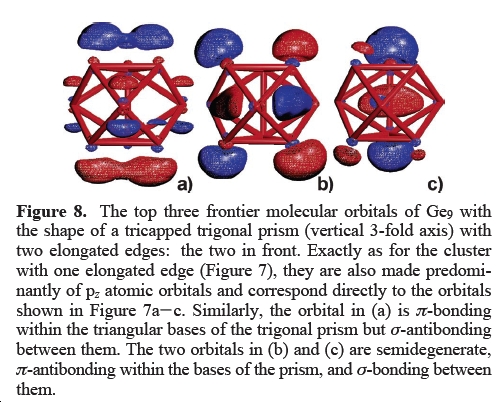
Literature MO's
The LUMO corresponds to a) in the diagram. b) and c) correspond to the HOMO-1 and HOMO-2 which are reported as degenerate in the literature (see caption) My calculation gave them both an energy of 0.055 Hartree (1.497eV) and is thus in agreement.
Rationalising change in bond lengths
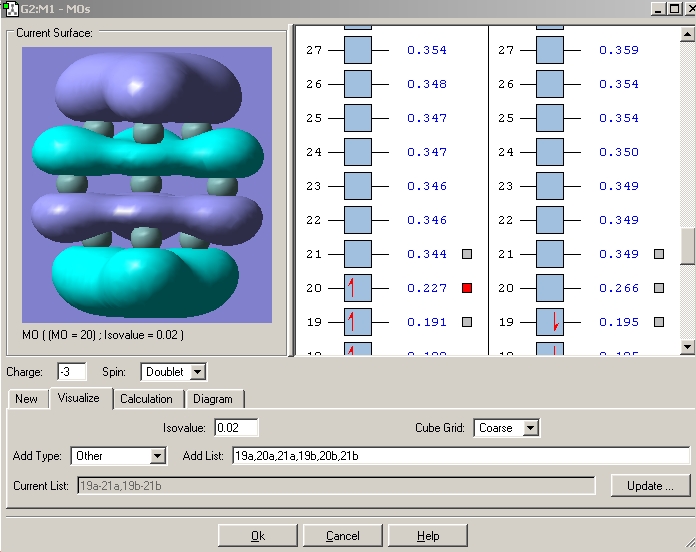
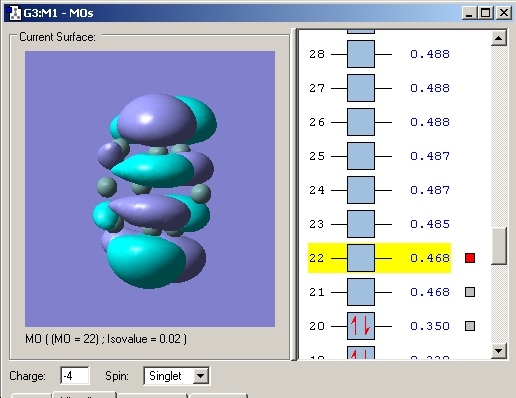
Upon reduction from 2- to 3- to 4- the bonds between the atoms making up the prism faces decrease. This can be rationalised by the fact that the LUMO is bonding in these regions and so the bonding interaction here is increased and thus the distance decreased. Another observation is that the prism height increases. Examination of the MO's reveals that all the occupied MO's in the 2- cluster are bonding and low energy. Upon reduction to the 3- cluster the high energy (over double that of the HOMO) LUMO becomes singly occupied. This MO is antibonding between the top and bottom faces and hence an increase in bond length is observed. This lengthening is further increased in the 4- cluster as an extra electron is added to the antibonding orbital.
LUMO 2- cluster
SOMO 3- cluster
HOMO 4- cluster
Note that upon lengthening the prism edges the orbital of interest lowers in energy. This is as the antibonding character of the MO between the atoms is lessened due to the increasing distance between these atoms.
However the asymmetrical lengthening of the prism edges cannot be rationalised by examination of this orbital alone. Examination of the LUMO+1 (or LUMO in the case of - and 4- charged clusters) shows it to be strongly pi bonding along one prism edge. Whilst along the other two prism edges, it is much less so with the electron density polarised away from the internuclear region between the prism edge atoms and instead residing towards the capping atoms.
LUMO+1 2- cluster The LUMO+1 is degenerate and the two MO's clearly do not have equal bonding character between the prism edge atoms in either MO, accounting for the asymmetric widening.
LUMO's in the 3- cluster
Interestingly the wavefunction for the 'LUMO' above unoccupied half of the SOMO is calculated to have a different form to the occupied one. This is symmetrical and antibonding between the atoms on the triangular faces and those along the prism edges.
LUMO's in the 4- cluster
The LUMO in the 4- cluster is also degenerate, however the two orbitals are of the same form, the lobes are just rotated around the cluster.
This LUMO is a different form to the corresponding LUMO+1 in the 2- cluster. This is as the unoccupied orbitals are much hareder to compute nd more diffuse hence the results obtained for occupied orbitals or those close to occupied orbitals are better than those obtained for orbitals that are not occupied and are far in energy from the occupied ones.
3D aromaticity and reactivity
The 2- cluster displays the structure predicted by wades rules for aromatic cluster compunds. Examining the computed MO's reveals that for the 2- cluster, all the MO's that are occupied are bonding in nature. This bonding is declocalised over the entire structure as a pose to localised as 2 center 2 electron bonds (examining the lower energy orbitals in the table above allows this to be seen clearly). This implies that the entire structure is aromatic. Similar MO's are obtained for the 3- and 4- clusters, except that in these clusters the HOMO is high energy orbital with a large amount of antibonding character.
The E9 zintl anions are kown to displace n6 pi bound ligands in metal tricarbonyl complexes. They act a 6 electron donors. Although Ge9 metal complexes have yet to be characterised, the corresponding Sn9 and Pb9 clusters have been successfully cystalised for metals Cr, Mo and W [32]. As they are in the same group ant the clusters have the same structure I would expect their MO's to have a similar form, hence their co-ordination can also be explained by examination of the Ge9 MO's.
Examination of the MO's of the clusters reveals that the HOMO-1 and HOMO-2 are of a similar energy and of the correct symmetry to overlap with the metal d-orbitals via a pi interaction, enabling them to act as 6 electron donors.
Rationalisation of the reported multiplicity of the Ge94- anion
The Ge94- cluster is reported to be a singlet. In order to confirm this the energies of both the singlet and triplet structures were computed by changing the multiplicity from 1 to 3 when performing optimisation. (as outlined for the doublet 3- cluster). The optimisations were run as before and the files checked by analysis of the RMS gradient in the results file (to ensure convergence had occurred) and energies from the frequency calculations. Energy from optimisation calculation: -87993 kJ/mol Energy from frequency calculation: - 87993 kJ/mol Energy of the singlet Ge9 4- anion: -88120 kJ/mol Comparison of the three energies shows that the calculation for the triplet did reach a minimum, and that this energy is higher than that of the singlet anion. Hence the singlet anion forms preferentially to the triplet.
Results summary from optimisation
Results summary from frequency calculation
The resulting structure of the triplet 4- cluster can be seen below:
It can be found on D-space at: http://hdl.handle.net/10042/to-1913 The triplet IR is very different to those obtained for the singlet, with more high energy vibrations present in the triplet spectrum. This can be rationalised by examining the relevant bond lengths in the triplet structure (those who's stretched result in a change in dipole). The Ge-Ge distances of adjacent atoms were found to be 2.62 – 2.78 amstrongs within the triangle and within the pentagon. This are shorter than those observed for the singlet state and thus the energy required for the vibration is higher.
Comparison of structures Comparing the structure of the triplet to the singlet 4- anion, the triplet does not display a distorted tricapped trigonal prism structure or a monocapped square antiprism structure (predicted from wades rules). Instead a structure consisting of a pentagon capped by an aton on one face and a triangle on the other is formed. This kind of structure is rather unusual and not observed frequently for cluster compounds (no examples could be found in literature) inplying that it is unstable and further explaining why the triplet does not form. Triplets are usually only lower energy when the HOMO and LUMO are degenerate, wheras in the case of the Ge9 4- anion the LUMO is over double the energy of the HOMO hence the singlet structure is lower energy.
MO's In order to rationalise why the triplet is higher energy, the MO's were calculated to see if it had the same type of aromatic delocalisation of the MO's over the structure. Results
| MO | Picture |
|---|---|
| LUMO | 
|
| SOMO | 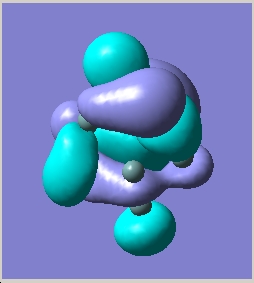
|
| SOMO | 
|
| HOMO | 
|
| HOMO-1 | 
|
As can be seen above the triplet orbitals do have some aromatic-type delocalisation of the MO's over the cluster but the highest occupied orbitals are highly anti-bonding in nature and high energy. Thus this structure is less stable than the singlet.
Final notes on spin contamination
Researching into spin operators[33] unveiled that the spin operator used in quantum calculations are:
Thus putting S=0.5 into these calculations would give an expectation value of 0.75 and thus the calculation for Ge9 3- would not be spin contaminated. If this is the value S**2 in the output file then the data I obtained is valid.
References
- ↑ Fourier transform infrared spectroscopy of the BH, v3 band,Kentarou Kawaguchi, J. Chem. Phys., Vol. 96, No. 5,1 March 1992
- ↑ Fourier transform infrared spectroscopy of the BH, v3 band,Kentarou Kawaguchi, J. Chem. Phys., Vol. 96, No. 5,1 March 1992
- ↑ K. Kawaguchi, J. E. Butler, C. Yamada, S. H. Bauer, T. Minowa, H. Kanamori, and E. Hirota, J. Chem. Phys. 87,243s ( 1987).
- ↑ Fourier transform infrared spectroscopy of the BH, v3 band,Kentarou Kawaguchi, J. Chem. Phys., Vol. 96, No. 5,1 March 1992
- ↑ cis-Tetracarbonylbis(tricyclohexyl-phosphine)molybdenum(0)and pentacarbonyl(tricyclohexylphos-phine)molybdenum(0),Jose E. Cortes-Figueroa, Madeline S. Leon-Velazquez,Johanna Ramos, Jerry P. Jasinski, David A. Keene,Jeffrey D. Zubkowskic and Edward J. Valent, Acta Cryst. (2000). C56, 1435-1437
- ↑ trans- Tetracarbon ylb is( tricyclohexylphosphine)molybdenum(0), trans-[Mo(CO)4(PCy3)2], ELMER C. ALYEA, GEORGE FERGUSON AND SHANMUGAPERUMAL KANNAN, Acta Cryst. (1996). C52, 765-767
- ↑ Inorganica Chimica Acta 284 (1999) 229-236
- ↑ trans- Tetracarbonyl b is( tricyclohexylphosphine)molybdenum(0), trans-[Mo(CO)4(PCy3)2] ELMER C. ALYEA, GEORGE FERGUSON ANDSHANMUGAPERUMAL KANNAN, Acta Cryst. (1996). C52, 765-767
- ↑ "Steric contributions to the solid-state structures of bis(phosphine) derivatives of molybdenum carbonyl. X-ray structural studies of cis-Mo(CO)4[PPh3-nMen]2 (n = 0, 1, 2)", F. Albert Cotton, Donald J. Darensbourg, Simonetta Klein, and Brian W. S. Kolthammer, Inorg. Chem., 21, (1982), p294-299
- ↑ ref3 "The crystal and molecular structure of trans-tetracarbonylbis(triphenyl-phosphine)chromium(0) in a new unit cell: Is the trans conformer more stable than the cis?", Dennis W. Bennett, Tasneem A. Siddiquee, Daniel T. Haworth, Shariff E. Kabir and Farzana Camellia. J. Chem. Cryst., 34 (6) (2004) p353-359
- ↑ http://www.alldatasheet.com/view.jsp?Searchword=NH3
- ↑ Schwerdtfeger, Laakkonen, and PyykkO: Trends in inversion barriers. I, J. Chem. Phys., Vol. 96, No. 9,l May 1992
- ↑ E D. Simandiras, N. C. Handy, and R. D. Amos, J. Chem. Phys. 88,3 174(1988).
- ↑ Linstrom, P.J.; Mallard, W.G. (eds.) NIST Chemistry WebBook, NIST Standard Reference Database Number 69. National Institute of Standards and Technology, Gaithersburg MD.
- ↑ Linstrom, P.J.; Mallard, W.G. (eds.) NIST Chemistry WebBook, NIST Standard Reference Database Number 69. National Institute of Standards and Technology, Gaithersburg MD.
- ↑ Scheschkewitz, David ; d.scheschkewiz@imperial.ac.uk
- ↑ Zintl, E.; Goubeau, J.; Dullenkopf, W. Z. Phys. Chem., Abt. A 1931, 154, 1. (b) Zintl, E.; Harder, A. Z. Z. Phys. Chem., Abt. A 1931, 154,47. (c) Zintl, E.; Dullenkopf, W. Z. Phys. Chem., Abt. B 1932, 16, 183. (d)Zintl, E.; Kaiser, H. Z. Anorg. Allg. Chem. 1933, 211, 113. (e) Zintl, E.;Harder, A. Neumayr, S. Z. Phys. Chem., Abt. A 1931, 154, 92.
- ↑ Corbett, J. D. Chem. ReV. 1985, 85, 383
- ↑ Chemistry of Deltahedral Zintl Ions, Slavi C. Sevov, and Jose M. Goicoechea, Organometallics, 2006, 25 (24), 5678-5692 • DOI: 10.1021/om060480o
- ↑ Evolving patterns in boron cluster chemistry, Mark A. Fox and Ken Wade, Pure Appl. Chem., Vol. 75, No. 9, pp. 1315–1323, 2003.
- ↑ Evolving patterns in boron cluster chemistry, Mark A. Fox and Ken WadePure Appl. Chem., Vol. 75, No. 9, pp. 1315–1323, 2003.
- ↑ Goicoechea, J. M.; Sevov, S. C. Inorg. Chem. 2005, 44, 2654
- ↑ Chemistry of Deltahedral Zintl Ions, Slavi C. Sevov, and Jose M. Goicoechea, Organometallics, 2006, 25 (24), 5678-5692 • DOI: 10.1021/om060480o
- ↑ DFT study of the structure and spectral behavior of new pt(II) complexes with 5-methyl-5(4-pyridyl)hydantoin Adriana Bakalova 1 *, Hristo Varbanov 1, Stancho Stanchev 2, Darvin Ivanov 1, Frank Jensen 3International Journal of Quantum Chemistry, Volume 109 Issue 4, Pages 826 - 836
- ↑ DFT study of electronic structure and geometry of neutral and anionic silver clusters, Vitaly E. Matulis, Oleg A. Ivashkevich and Valerij S. Gurin,Journal of Molecular Structure: THEOCHEM Volumes 664-665, 15 December 2003, Pages 291-308
- ↑ Computational Chemistry: A Practical Guide for Applying Techniques to Real-World Problems. David C. Young
- ↑ Fa¨ssler, T. F.; Hoffmann, R. Angew. Chem., Int. Ed. 1998, 38, 543; 18-crown-6 ) 1,7,10,13,16-hexaoxacyclooctadecane
- ↑ Conformation Isomerism of Nonagermanide Ions. Crystal Structures of Brown and Red [K-([2.2.2]crypt)]6Ge9Ge9·(ethylenediamine)x (x = 0.5, 1.5)Thomas F. Fssler, and Uwe SchtzInorg. Chem., 1999, 38 (8), 1866-1870• DOI: 10.1021/ic981157j
- ↑ Ge9 4-, A Deltahedral Zintl Ion Now Made in the Solid-state, Virginie Queneau and Slavi C. Sevov,Angew Chrm Int Ed Engl 1997,36, No 16
- ↑ J. Am. Chem. Soc., Vol. 121, No. 39, 1999
- ↑ Ge9 4-, A Deltahedral Zintl Ion Now Made in the Solid-state, Virginie Queneau and Slavi C. Sevov,Angew Chrm Int Ed Engl 1997,36, No 16
- ↑ Eichhorn, B. W.; Haushalter, R. C.; Pennington, W. T. J. Am. Chem. Soc. 1988, 110, 8704
- ↑ http://farside.ph.utexas.edu/teaching/qmech/lectures/node86.html


