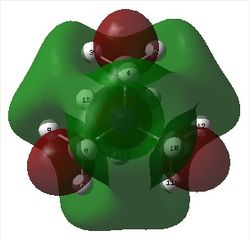
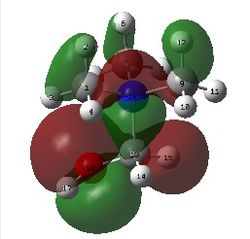
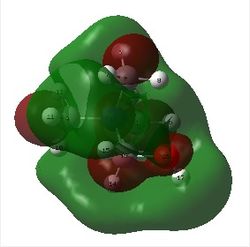
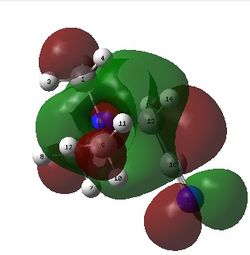
Rep:Mod:fkl11inmod18
Y3C Experiment: Inorganic Module
Name: Fong Kai Lee
CID number: 00690790
Part 1: Compulsory Section
Optimisation of Molecules
Computational analysis of molecules were carried out by using Gaussian software. Gaussian incorporates quantum mechanics which allows us to investigate structures and bonding of desired chemical compounds. GaussView is a program that is closely related to Gaussian. The method employed in GaussView determines the type of approximation to solve the Schrödinger equation of the molecule (electron density and energy) whereas the basis set represents the accuracy of the outcome of calculations. Higher basis set level requires relatively longer time to produce the calculations and vice versa. Of course, the duration of calculations carried out by Gaussian depends on the hardware of the computer used.
Optimisation of BH3
Usage of 3-21G basis set
BH3 was created in the program with one B-H bond distance was set to 1.53 Å, one B-H bond to 1.54 Å and last B-H bond to 1.55 Å. This was done to disrupt the symmetry of the molecule in order to optimise the molecule using DFT B3LYP method with 3-21G as basis set. The calculations for the optimisation of BH3 using the method mentioned earlier are shown here.
The table below shows the information of BH3 optimisation using the method mentioned earlier:
| File Type | .log |
| Calculation Type | FOPT |
| Calculation Method | RB3LYP |
| Basis Set | 3-21G |
| Charge | 0 |
| Spin | Singlet |
| Total Energy / atomic units | -26.46226429 |
| RMS Gradient Norm | 0.00008851 |
| Imaginary Freq | n/a |
| Dipole Moment / Debye | 0.00 |
| Point Group | Cs |
| Calculation Duration / seconds | 17.0 |
The information shown below indicates that both the forces and displacements for molecule optimisation were converged. This means that the job of optimisation of BH3 was done.
         Item               Value     Threshold  Converged?
 Maximum Force            0.000220     0.000450     YES
 RMS     Force            0.000106     0.000300     YES
 Maximum Displacement     0.000709     0.001800     YES
 RMS     Displacement     0.000447     0.001200     YES
 Predicted change in Energy=-1.672478D-07
 Optimization completed.
    -- Stationary point found.
The figure below shows the molecule of BH3 (with labeled atoms):

The B-H bond distance was found to be 1.19 Å and H-B-H bond angle to be 120.0° in BH3 from calculations. The calculated B-H bond length (1.19 Å) agrees well with the literature value (1.19 Å, determined by IR spectroscopy)[1] This indicates that the calculations carried out by Gaussian is quite accurate.
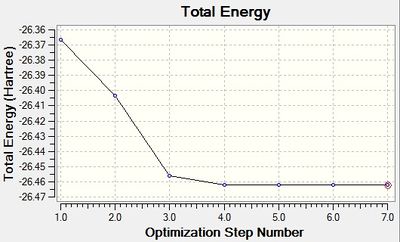
The graphs below show the progress of optimisation of BH3 by exploring the potential energy surface of the molecule to find the structure with minimal energy. The Root Mean Square (RMS) gradient graph indicates that the gradient approached zero as the minimum energy structure was found.
 |
 |
Usage of 6-31G(d,p) basis set
A higher level basis set 6-31G(d,p) was used to achieve a better optimisation of BH3. The calculations for the optimisation of BH3 using this basis set are shown here.
The table below shows the information of BH3 optimisation using 6-31G(d,p) as basis set:
| File Type | .log |
| Calculation Type | FOPT |
| Calculation Method | RB3LYP |
| Basis Set | 6-31G(d,p) |
| Charge | 0 |
| Spin | Singlet |
| Total Energy / atomic units | -26.61531648 |
| RMS Gradient Norm | 0.00055333 |
| Imaginary Freq | n/a |
| Dipole Moment / Debye | 0.00 |
| Point Group | Cs |
| Calculation Duration / seconds | 7.0 |
The information shown below indicates that both the forces and displacements for molecule optimisation were converged. This means that the job of optimisation of BH3 was done.
         Item               Value     Threshold  Converged?
 Maximum Force            0.000012     0.000450     YES
 RMS     Force            0.000008     0.000300     YES
 Maximum Displacement     0.000061     0.001800     YES
 RMS     Displacement     0.000038     0.001200     YES
 Predicted change in Energy=-1.069855D-09
 Optimization completed.
    -- Stationary point found.
The figure below shows the molecule of BH3 (with labeled atoms):
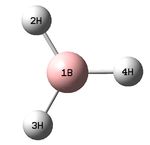
The B-H bond distance was found to be 1.19 Å and H-B-H bond angle to be 120.0° in BH3 from calculations.The calculated B-H bond length (1.19 Å) agrees well with the literature value (1.19 Å, determined by IR spectroscopy)[1] This indicates that the calculations carried out by Gaussian is quite accurate.
Summary
The total energy for optimised BH3 using 3-21G basis set is -26.46226429 a.u. whereas the total energy for optimised BH3 using 6-31G(d,p) basis set is -26.61531648 a.u.. The energy difference between these two optimised structures is 0.15305219 a.u. (about 402 kJ mol-1). Since there is a large amount of energy difference between usage of these two basis set, it is unreasonable to compare the calculated energy of molecule structures using different basis sets. It is more plausible to compare calculated energies for molecules with same number of atoms using the same basis set.
Optimisation of GaBr3
Optimisation of GaBr3 was done using DFT B3LYP method with LanL2DZ as medium level basis set. In addition, the symmetry of the molecule was restricted to D3h with the tolerance level set to very tight (0.0001) in order to achieve more accurate calculations. The calculations for the optimisation of GaBr3 using the method mentioned earlier can be found here: DOI:10042/27616
The table below shows the information of GaBr3 optimisation using the method mentioned earlier:
| File Type | .log |
| Calculation Type | FOPT |
| Calculation Method | RB3LYP |
| Basis Set | LANL2DZ |
| Charge | 0 |
| Spin | Singlet |
| Total Energy / atomic units | -41.70082783 |
| RMS Gradient Norm | 0.00000016 |
| Imaginary Freq | n/a |
| Dipole Moment / Debye | 0.00 |
| Point Group | D3h |
| Calculation Duration / seconds | 27.9 |
The information shown below indicates that both the forces and displacements for molecule optimisation were converged. This means that the job of optimisation of GaBr3 was done.
         Item               Value     Threshold  Converged?
 Maximum Force            0.000000     0.000450     YES
 RMS     Force            0.000000     0.000300     YES
 Maximum Displacement     0.000003     0.001800     YES
 RMS     Displacement     0.000002     0.001200     YES
 Predicted change in Energy=-1.282690D-12
 Optimization completed.
    -- Stationary point found.
The figure below shows the molecule of GaBr3 (with labeled atoms):
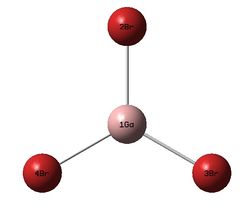
The Ga-Br bond distance was found to be 2.35 Å and Br-Ga-Br bond angle to be 120.0° in GaBr3 from calculations. The calculated Ga-Br bond length (2.35 Å) agrees well with the literature value (2.35 Å)[1] This indicates that the calculations carried out by Gaussian is quite accurate.
Optimisation of BBr3
Optimisation of BBr3 was done using DFT B3LYP method with GEN as basis set. Full basis set 6-31G(d,p) was applied to the B atom and pseudo-potential LanL2DZ applied on the Br atoms. In this way, lighter atom (B atom in this case) is treated with a full basis set which has a higher accuracy compared to heavier atoms. The calculations for the optimisation of BBr3 using the method mentioned earlier can be found here: DOI:10042/27619
The table below shows the information of BBr3 optimisation using the method mentioned earlier:
| File Type | .log |
| Calculation Type | FOPT |
| Calculation Method | RB3LYP |
| Basis Set | Gen |
| Charge | 0 |
| Spin | Singlet |
| Total Energy / atomic units | -64.43644900 |
| RMS Gradient Norm | 0.00000974 |
| Imaginary Freq | n/a |
| Dipole Moment / Debye | 0.00 |
| Point Group | Cs |
| Calculation Duration / seconds | 36.3 |
The information shown below indicates that both the forces and displacements for molecule optimisation were converged. This means that the job of optimisation of BBr3 was done.
         Item               Value     Threshold  Converged?
 Maximum Force            0.000018     0.000450     YES
 RMS     Force            0.000010     0.000300     YES
 Maximum Displacement     0.000106     0.001800     YES
 RMS     Displacement     0.000061     0.001200     YES
 Predicted change in Energy=-2.171373D-09
 Optimization completed.
    -- Stationary point found.
The figure below shows the molecule of BBr3 (with labeled atoms):
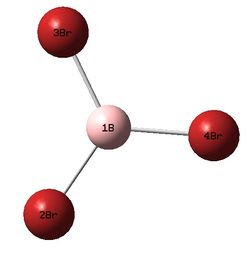
The optimised B-Br bond distance was found to be 1.93 Å and Br-B-Br bond angle to be 120.0° in BBr3 from calculations. The calculated B-Br bond length (1.93 Å) agrees quite well with the literature value (1.89 Å)[1] This indicates that the calculations carried out by Gaussian is quite accurate.
Structure Comparison Between BH3, BBr3 and GaBr3
The table below shows the optimised bond distances for BH3, BBr3 and GaBr3:
| Compound | Optimised bond distance / Å |
| BH3 | 1.19 |
| BBr3 | 1.93 |
| GaBr3 | 2.35 |
Comparisons are first carried out between BH3 and BBr3 in terms of the nature of the bonds formed and their bond lengths. Bromine (2.96 on the Pauling scale) [2] is much more electronegative than hydrogen (2.2) [3] and this will affect the nature of B-X bond formation where X is the ligand. For bromine, a polar covalent B-Br bond is formed in BBr3 due to large electronegativity difference (2.96 for Br and 2.04 for B) [2] [4] . However the dipole moment of BBr3 is zero as the symmetry of the molecules (trigonal planar) negates the individual dipoles created between B-Br which results in net dipole moment of zero. For hydrogen, a non-polar covalent B-H bond is formed in BH3 due to similar electronegativity of atoms (2.2 for H and 2.04 for B). [3] [4] The dipole moment of BH3 is zero due to symmetry of the molecule (trigonal planar).
As the ligand is changed from hydrogen to bromine atom, the bond length of B-X increases from 1.19 Å to 1.93 Å, with a bond length difference of 0.74 Å. This observation can be explained by the fact that bromine has a larger size (empirically measured covalent radius of 1.15 Å) than hydrogen (0.25 Å). [5] Hence, increased bond length will be observed when a larger atom such as bromine is involved in the bond formation.
Comparisons are then carried out between BBr3 and GaBr3 in terms of the nature of the bonds formed and their bond distances. As discussed previously, a polar covalent B-Br bond is formed in BBr3 due to large electronegativity difference between B and Br atoms. For Ga as the central atom, a polar covalent Ga-Br bond is formed in GaBr3 due to large electronegativiity difference (2.96 for Br on the Pauling scale and 1.81 for Ga). [2] [6] This is their similarity in both compounds as both central atoms have similar electronegativity values.
As the central atom is changed from boron to gallium atom, the bond length of Y-Br (where Y is the central atom) increases from 1.93 Å to 2.35 Å, with a bond length difference of 0.42 Å. This observation can be explained by the fact that gallium has a larger size (empirically measured covalent radius of 1.30 Å) than boron (0.85 Å). [5] Thus, increased bond length will be observed when a larger central atom such as gallium is involved in the bond formation.
In summary, atoms which are large such as GaBr3 will have longer bond lengths in the compound compared to small atoms like BH3. Great electronegativity difference between atoms involved in bonding will result in formation of a polar bond and vice versa.
Definition of A Bond
GaussView is a program which is associated closely with Gaussian software. It allows us to create desired molecules and submit calculations as an input to Gaussian which does all the calculations. The output results can then be viewed and analysed on GaussView. For some structures, GaussView does not draw in the bonds where we expect which seems to be strange. Actually this is because GaussView draws bond according to its distance criteria. In other words, a bond is defined by certain distance in GaussView. Thus, when two atoms are more far apart from pre-defined distance value, a bond is not drawn by GaussView. We may consider it as a weak interactions between the two atoms rather than a formal bond formation.
A chemical bond can be defined as the forces acting between two atoms or two groups of atoms which leads to formation of a molecule or compound with sufficient stability. In this case, the acting forces can be divided into two major interactions which are ionic bonds and covalent bonds. An ionic bond is formed due to strong interaction from the Coulombic attraction of the excess charges of oppositely charged ion. A covalent bond involves sharing of a pair electrons between two atoms which leads to formation of a bond. In these two cases, we can draw a line between the two atoms representing a bond is formed between them. [7] However, weaker interactions such as Wan der Waals forces also exists when two atoms or groups of atoms can interact positively within their range. In this case, a line is not usually drawn between them as they are not close enough to form a strong interaction, i.e. a bond.
Frequency Analysis of Molecules
Analysis for BH3
Refined Optimisation
Another optimisation of BH3 was done using DFT B3LYP method with 6-31G(d,p) basis set with additional keywords of 'int=ultrafine CPHF=fine'. This step was done in order to achieve a better optimisation where the additional keywords reflect a tighter converge criteria. The calculations for the optimisation of BH3 using the method mentioned earlier are shown here.
The table below shows the information of BH3 optimisation using the method mentioned earlier:
| File Type | .log |
| Calculation Type | FOPT |
| Calculation Method | RB3LYP |
| Basis Set | 6-31G(d,p) |
| Charge | 0 |
| Spin | Singlet |
| Total Energy / atomic units | -26.61532360 |
| RMS Gradient Norm | 0.00000591 |
| Imaginary Freq | n/a |
| Dipole Moment / Debye | 0.00 |
| Point Group | Cs |
| Calculation Duration / seconds | 5.0 |
The information shown below indicates that both the forces and displacements for molecule optimisation were converged. This means that the job of optimisation of BH3 was done.
         Item               Value     Threshold  Converged?
 Maximum Force            0.000009     0.000015     YES
 RMS     Force            0.000007     0.000010     YES
 Maximum Displacement     0.000052     0.000060     YES
 RMS     Displacement     0.000034     0.000040     YES
 Predicted change in Energy=-7.658188D-10
 Optimization completed.
    -- Stationary point found.
The figure below shows the molecule of BH3 (with labeled atoms)::
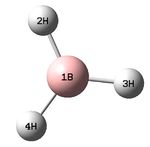
The B-H bond distance was found to be 1.19 Å and H-B-H bond angle to be 120.0° in BH3 from calculations. The calculated B-H bond length (1.19 Å) agrees well with the literature value (1.19 Å, determined by IR spectroscopy)[1] This indicates that the calculations carried out by Gaussian is quite accurate.
Frequency Calculations
The frequency calculation of BH3 was based on the pevious fully optimised molecule. The calculations for the frequency of BH3 using the method mentioned earlier are shown here.
The table below shows the information of BH3 calculations using the method mentioned earlier:
| File Type | .log |
| Calculation Type | FREQ |
| Calculation Method | RB3LYP |
| Basis Set | 6-31G(d,p) |
| Charge | 0 |
| Spin | Singlet |
| Total Energy / atomic units | -26.61532360 |
| RMS Gradient Norm | 0.00000591 |
| Imaginary Freq | 0 |
| Dipole Moment / Debye | 0.00 |
| Point Group | Cs |
| Calculation Duration / seconds | 9.0 |
The information shown below indicates that both the forces and displacements for molecule calculations were converged. This means that the job of frequency calculations of BH3 was done.
         Item               Value     Threshold  Converged?
 Maximum Force            0.000013     0.000450     YES
 RMS     Force            0.000006     0.000300     YES
 Maximum Displacement     0.000086     0.001800     YES
 RMS     Displacement     0.000043     0.001200     YES
 Predicted change in Energy=-1.172505D-09
 Optimization completed.
    -- Stationary point found.
Two low frequencies from the log file are presented below:
Low frequencies ---   -10   -10   -5   0   0    0
Low frequencies --- 1163 1213 1213
The first line of 'low frequencies' values are within ± 15 cm-1 and absence of negative frequencies observed in the second line of 'low frequencies' indicate that the molecule is fully optimised.
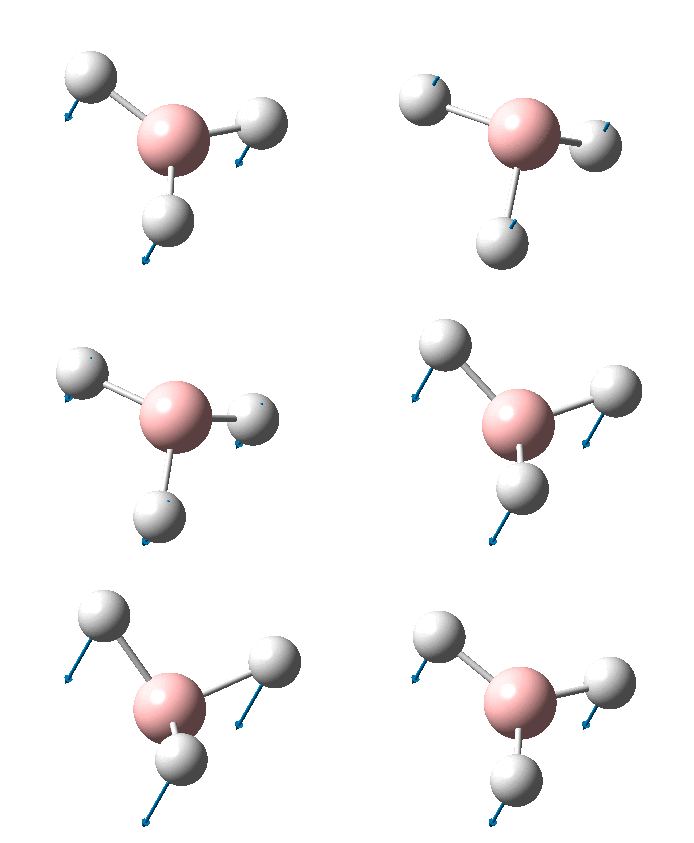
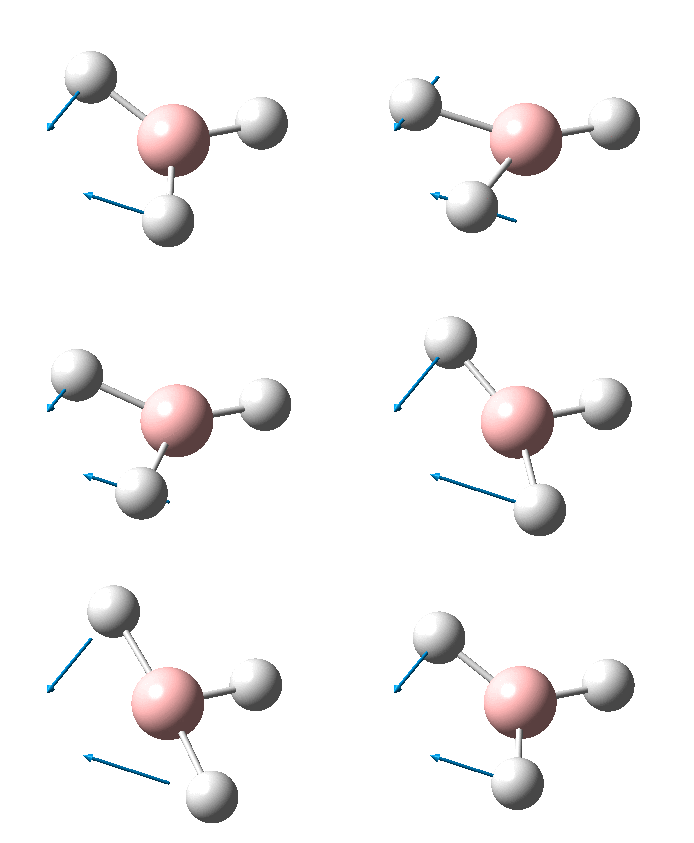
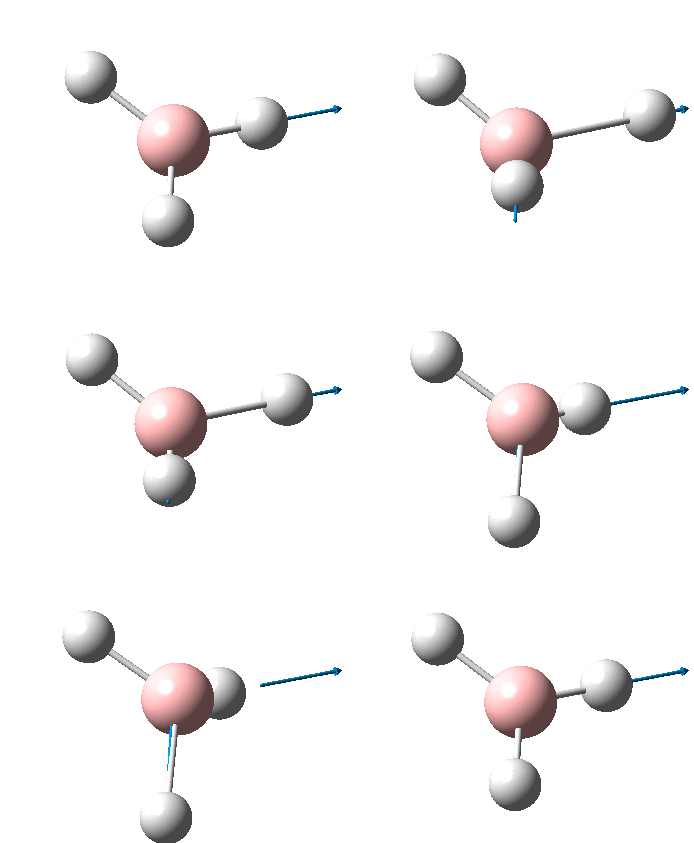
Animations of BH3 Vibrations
The table below shows the results from the frequency vibrations calculations of BH3:
The computed IR spectrum of BH3 is shown below:
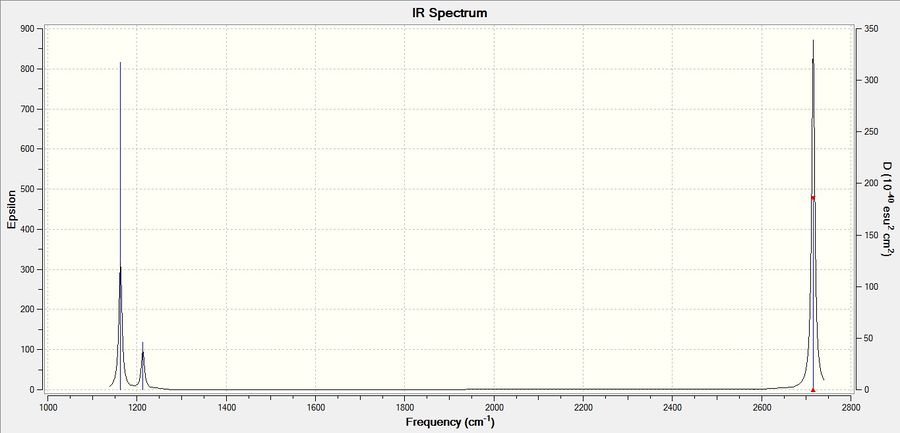
Every molecule has 3N vibrational frequencies where N is the number of atoms present and the number 3 represents that the molecule is in three-dimensional space. However, the actual vibrational frequencies of a molecule is 3N-6 where the term '-6' represents the possible motions of the center of mass of the molecule which need to be eliminated. From the formula 3N-6, the possible number of vibrational peaks of BH3 is 6 but there are only three peaks observed in the predicted spectrum. This is due to the fact that IR spectroscopy only records vibrations which show a change in dipole. Hence, vibrational number 4 (v=2583 cm-1) in the table above is not recorded because there is no change in dipole moment (total symmetrical motion). Vibrational numbers 2 and 3 (v=1213 cm-1) are degenerate as the vibration frequency is the same which shows up as a tall peak in the spectrum. The same reasoning is applied to peak numbers 5 and 6 (v=2716 cm-1) and a total of three peaks are recorded in the predicted spectrum of the molecule.
Analysis for GaBr3
Refined Optimisation
Another optimisation of GaBr3 was done using DFT B3LYP method with LanL2DZ basis set with additional keywords of 'int=ultrafine CPHF=fine'. This step was done in order to achieve a better optimisation where the additional keywords reflect a tighter converge criteria. The calculations for the optimisation of GaBr3 using the method mentioned earlier are shown here:DOI:10042/27638
The table below shows the information of GaBr3 optimisation using the method mentioned earlier:
| File Type | .log |
| Calculation Type | FOPT |
| Calculation Method | RB3LYP |
| Basis Set | LANL2DZ |
| Charge | 0 |
| Spin | Singlet |
| Total Energy / atomic units | -41.70082770 |
| RMS Gradient Norm | 0.00000020 |
| Imaginary Freq | n/a |
| Dipole Moment / Debye | 0.00 |
| Point Group | D3h |
| Calculation Duration / seconds | 12.7 |
The information shown below indicates that both the forces and displacements for molecule optimisation were converged. This means that the job of optimisation of GaBr3 was done.
         Item               Value     Threshold  Converged?
 Maximum Force            0.000000     0.000015     YES
 RMS     Force            0.000000     0.000010     YES
 Maximum Displacement     0.000003     0.000060     YES
 RMS     Displacement     0.000002     0.000040     YES
 Predicted change in Energy=-2.043759D-12
 Optimization completed.
    -- Stationary point found.
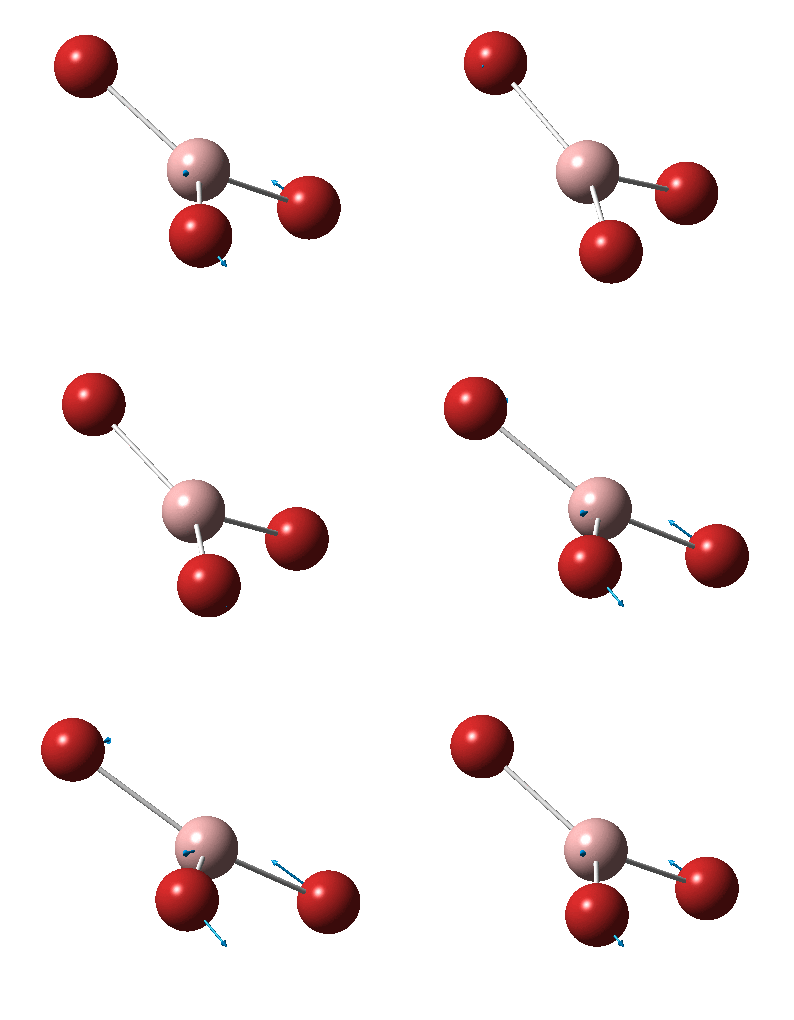
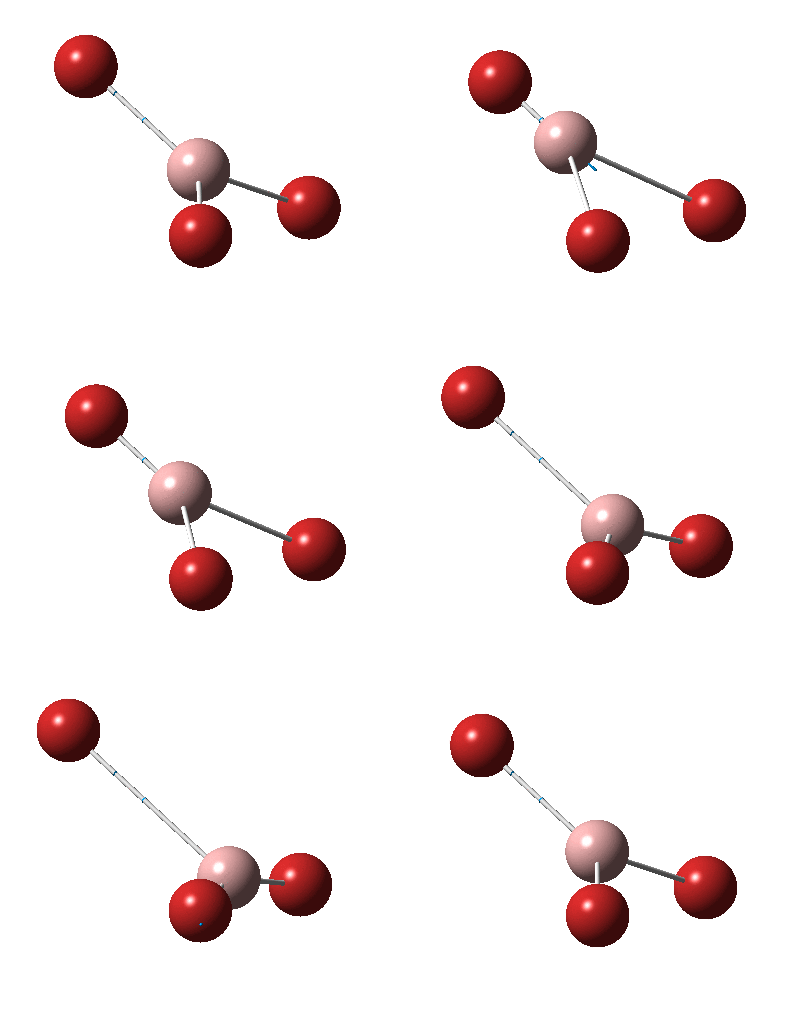
The figures below shows the molecule of GaBr3 :
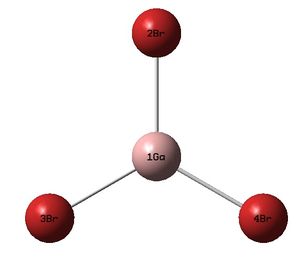
The Ga-Br bond distance was found to be 2.35 Å and Br-Ga-Br bond angle to be 120.0° in GaBr3 from calculations. The calculated Ga-Br bond length (2.35 Å) agrees well with the literature value (2.35 Å)[1] This indicates that the calculations carried out by Gaussian is quite accurate.
Frequency Calculations
The frequency calculation of GaBr3 was based on the pevious fully optimised molecule. The calculations for the frequency of GaBr3 using the method mentioned earlier are shown here: DOI:10042/27639
The table below shows the information of GaBr3 calculations using the method mentioned earlier:
| File Type | .log |
| Calculation Type | FREQ |
| Calculation Method | RB3LYP |
| Basis Set | LANL2DZ |
| Charge | 0 |
| Spin | Singlet |
| Total Energy / atomic units | -41.70082770 |
| RMS Gradient Norm | 0.00000020 |
| Imaginary Freq | 0 |
| Dipole Moment / Debye | 0.00 |
| Point Group | D3h |
| Calculation Duration / seconds | 28.0 |
The information shown below indicates that both the forces and displacements for molecule calculations were converged. This means that the job of frequency calculations of GaBr3 was done.
         Item               Value     Threshold  Converged?
 Maximum Force            0.000000     0.000450     YES
 RMS     Force            0.000000     0.000300     YES
 Maximum Displacement     0.000004     0.001800     YES
 RMS     Displacement     0.000002     0.001200     YES
 Predicted change in Energy=-2.149759D-12
 Optimization completed.
    -- Stationary point found.
Two low frequencies from the log file are presented below:
 Low frequencies ---   -1   0   0    0    1    1
 Low frequencies ---   76   76   100
The lowest "real" normal mode is the lowest vibrational frequency predicted (76 cm-1). The first line of 'low frequencies' values are within ± 15 cm-1 and absence of negative frequencies observed in the second line of 'low frequencies' indicate that the molecule is fully optimised.
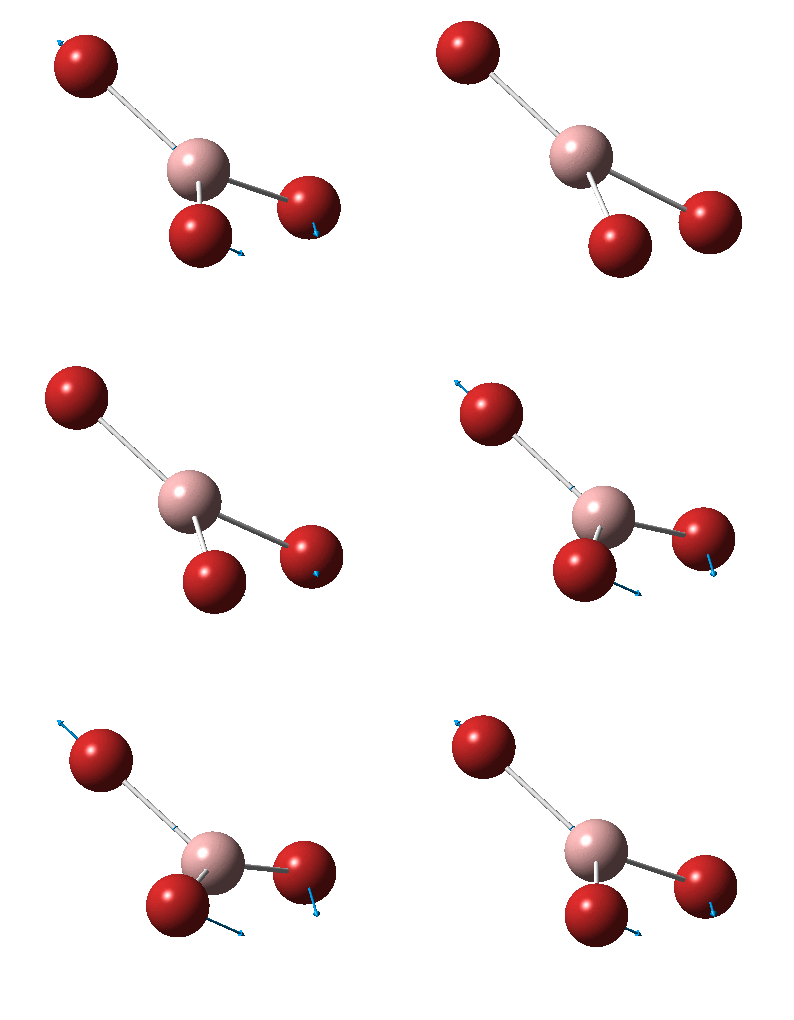
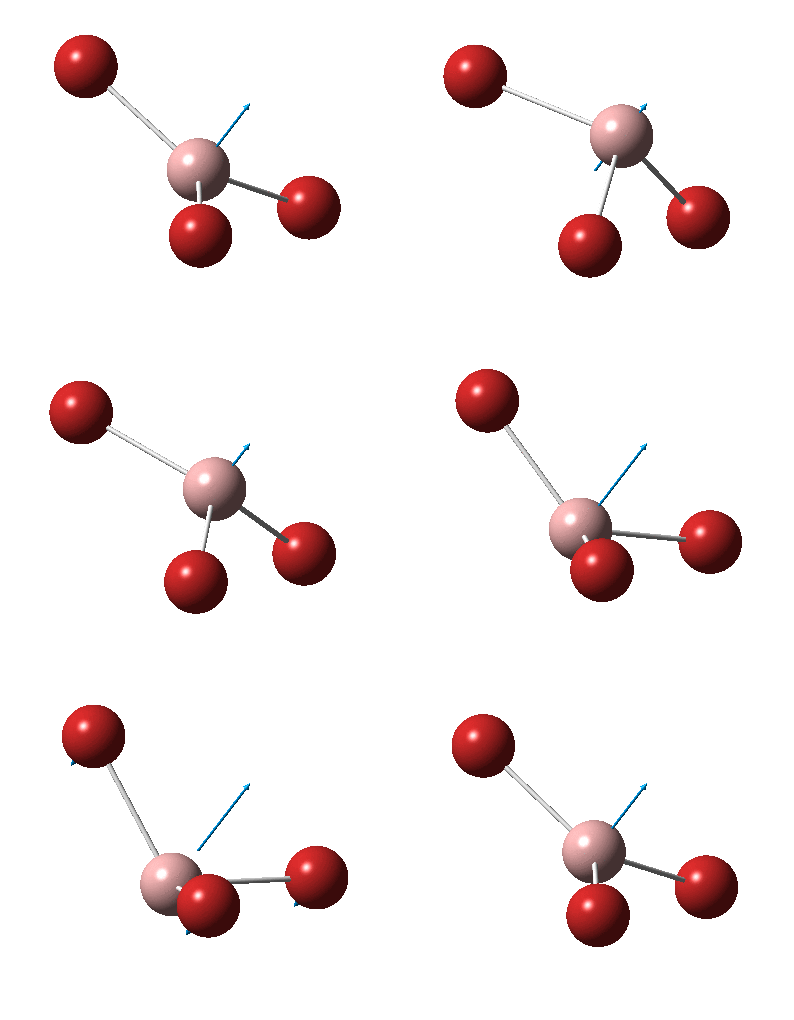
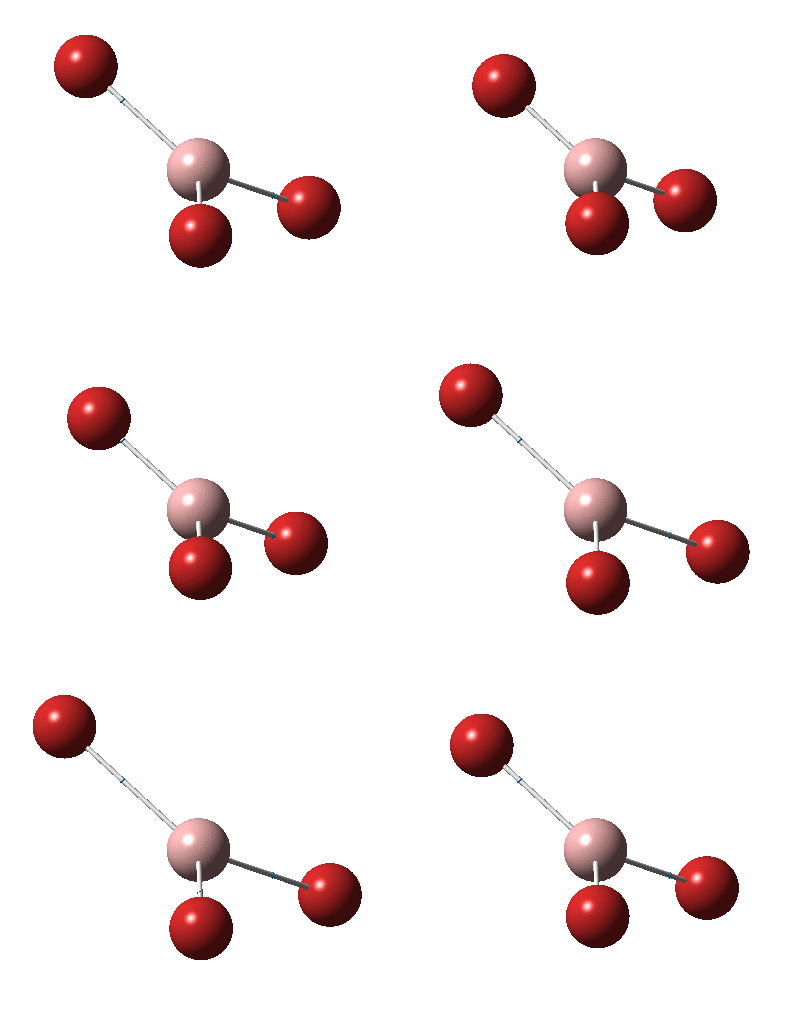
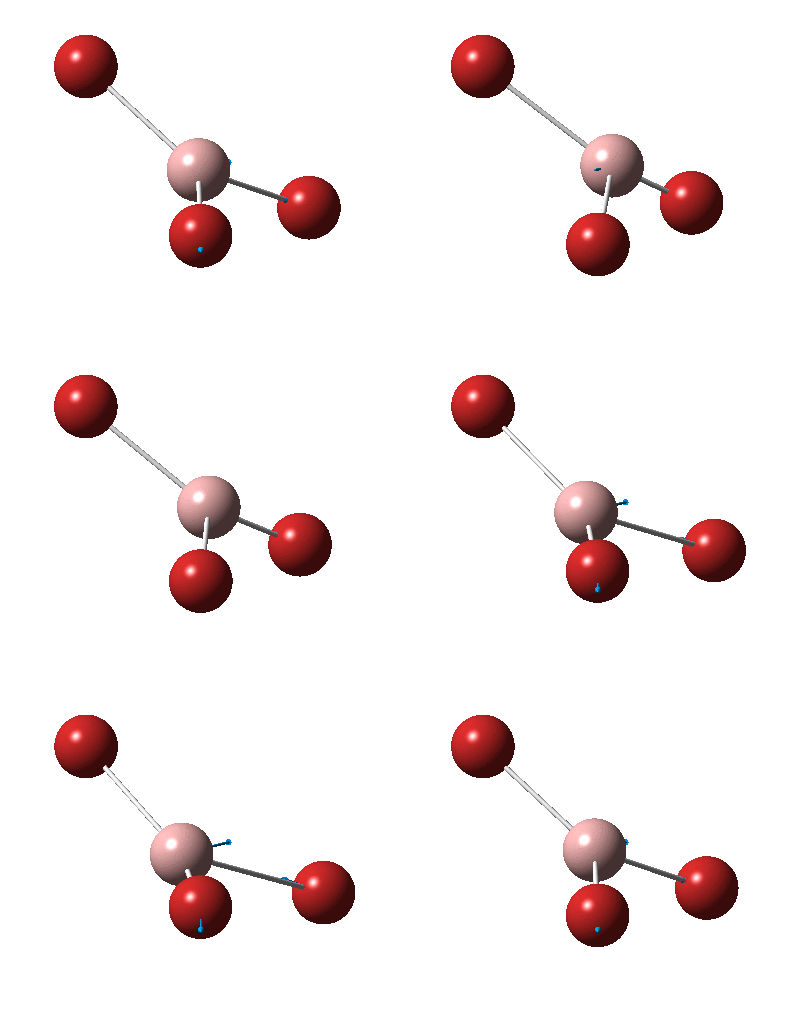
Animations of GaBr3 Vibrations
The table below shows the results from the frequency vibrations calculations of GaBr3:
The computed IR spectrum of GaBr3 is shown below:

Every molecule has 3N vibrational frequencies where N is the number of atoms present and the number 3 represents that the molecule is in three-dimensional space. However, the actual vibrational frequencies of a molecule is 3N-6 where the term '-6' represents the possible motions of the center of mass of the molecule which need to be eliminated. From the formula 3N-6, the number of vibrational peaks of GaBr3 is 6 but there are only three peaks observed in the predicted spectrum. This is due to the fact that IR spectroscopy only records vibrations which show a change in dipole. Hence, vibration number 4 (v=197 cm-1) in the table above is not recorded because there is no change in dipole moment (total symmetrical motion). Peak numbers 5 and 6 (v=316 cm-1) are degenerate as the vibration frequency is the same which shows up as a tall peak in the spectrum. The same reasoning is applied to peak numbers 1 and 2 (v=76 cm-1) and a total of three peaks are recorded in the predicted spectrum of the molecule.
Vibrational Frequencies Comparison Between BH3 and GaBr3
The table below shows the information of vibrational frequencies of BH3 and GaBr3:
| BH3 | GaBr3 | ||||
| Frequency / cm-1 | Intensity | Symmetry Point Group | Frequency / cm-1 | Intensity | Symmetry Point Group |
| 1163 | 93 | A2' | 76 | 3 | E' |
| 1213 | 14 | E' | 76 | 3 | E' |
| 1213 | 14 | E' | 100 | 9 | A2' |
| 2583 | 0 | A1' | 197 | 0 | A1' |
| 2716 | 126 | E' | 316 | 57 | E' |
| 2716 | 126 | E' | 316 | 57 | E' |
The large difference in the value of the frequencies for BH3 compared to GaBr3 is due to the large difference in the effective mass of the two molecules. The formula of wavenumber of IR absorbance and effective mass are shown below: [8]


where c is the speed of light, k is the force constant of a bond, meff is the effective mass, m1 and m2 are the mass of atom 1 and 2 respectively.
Hence from the equations above, Ga-Br has a greater effective mass than B-H and since the frequency is inversely proportional to the square root of effective mass, the IR wavenumber of Ga-Br is less than that of B-H. Lower IR frequencies of GaBr3 compared to BH3 also reflects the lower force constant of Ga-Br bond over B-H. This can be rationalised by their bond lengths, where Ga-Br bond distance is much longer than that of B-H.
There has been a reordering of the vibrational modes. In the IR spectrum of BH3, peak corresponding to A2' mode (1163 cm-1) first appears followed by a peak corresponding to a pair of modes (E') which are degenerate (1213 cm-1). The ordering is opposite to what is observed in the IR spectrum of GaBr cm-1 where peak corresponding to a pair of modes (E') which are degenerate (76 cm-1) appear first followed by a peak corresponding to A2' mode (100 cm-1).
The IR spectra of BH3 compared to GaBr3 are similar that there are three peaks observed in both spectra. There are six calculated vibrational frequencies for both spectra in which two pairs of frequencies are degenerate (have same frequency value). As discussed in sections of 'Animations of BH3 Vibrations' and 'Animations of GaBr3 Vibrations', only three peaks are observed in both spectra. Also, the most right peak (with highest frequency obsreved) in both spectra has the highest intensity.
For both spectra two modes lie fairly closely together, the A2' and E' modes and then the other two modes also lie fairly close together, the A1' and E' modes, but higher in energy. A1' and E' modes are higher in energy as there are change in the distance between the central atom and ligand atoms. In A1' mode, the ligand atoms move in and out together in a concerted motion from the centre of molecule (stretching motion) while the central atom remains stationary. Hence there is a change in the equilibrium distance between the ligand atoms and the central atom. High energy is required to overcome the positive interaction between the atoms in order to change the equilibrium bond distances. The same explanation goes for the E' modes in higher frequencies range. In A2' and E' modes in lower frequencies range, there is bond bending motions but no change in the bond equilibrium distance. Less energy is required to bend the bonds than energy required to stretch the bonds.
The same method and basis set for both the optimisation and frequency analysis calculations must be employed in GaussView. This is because the method determines the type of approximations needed to solve the Schrödinger equation of the molecule (electron density and energy) whereas the basis set represents the accuracy of the results of calculations. If the method and basis set are different for both the optimisation and frequency calculations, the total energy obtained for the same molecule will be different which will make the comparisons invalid.
A frequency analysis is carried out to determine the accuracy of the previous optimisation of the molecule. This also explains the fact that we need to used the same method and basis set for the optimisation and frequency calculations for the molecule to make valid comparisons. Frequency analysis finds the second derivative of the potential energy surface where a minimum state is achieved if all the calculated frequencies are positive. The optimisation of a molecule is bad if the calculated frequenices are negative. In addition, IR and Raman spectra can be generated from frequency analysis and can be compared with experimental spectra.
The term 'low frequencies' in the log file indicates the energy produced from translational and rotational motions of the molecule. It is better to make these low frequencies values to be zero via tighter optimisation.
Molecular Orbitals of BH3
Calculation of molecular orbitals (MOs) of BH3 was based on the refined, optimised molecule. The calculations for the MOs of BH3 can be found here: DOI:10042/27641
The table below shows the first eight MOs of BH3:
| Number | Energy Level | MO Diagram | Number | Energy Level | MO diagram |
| 1 | -6.771 |  |
5 | -0.066 | 
|
| 2 | -0.513 |  |
6 | 0.168 | 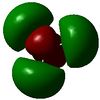
|
| 3 | -0.351 | 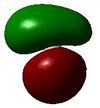 |
7 | 0.179 | 
|
| 4 | -0.351 |  |
8 | 0.179 | 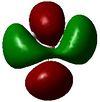
|
The diagram below shows the MO diagram of BH3. Computed MOs of BH3 are placed next to the Linear Combination of Atomic Orbitals (LCAO) MOs for comparison.
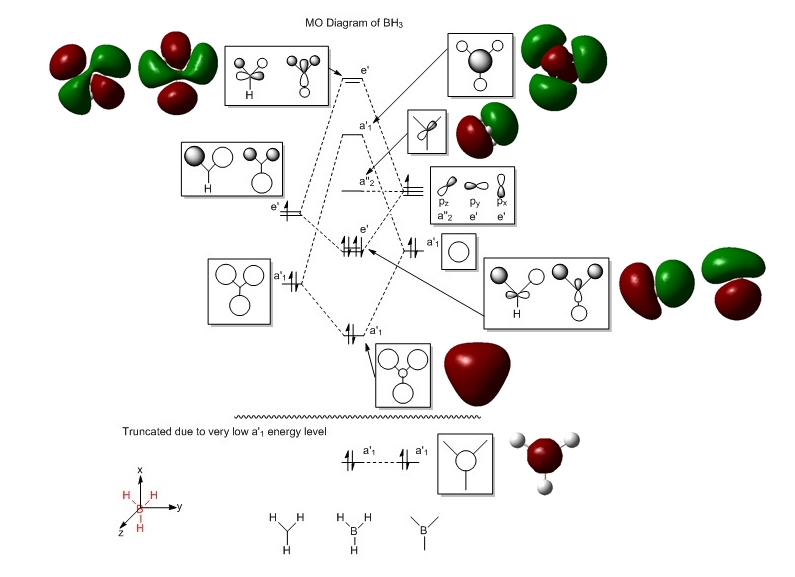
There is no significant differences between the predicted and LCAO MOs. The MOs are similar that the the polarity of the orbitals are consistent to each other and the shape of the MOs are generally consistent to each other. The predicted MOs that may have slight differences to LCAO MOs in terms of their shapes are probably ones that are unoccupied (from MO number 6 onwards). This is because they are more diffuse than the occupied ones.
The qualitative MO theory is very useful because one can predict the shapes and energy levels of the MOs quite easily without usage of computational calculations software. Note that calculations of MOs of a slightly complex molecule using a computer software takes a lot of time and effort (input of data) whereas qualitative MO theory provides a quick and fairly complete of picture of the MO diagram of the molecule. However, qualitative MO theory does not provide the exact position of energy level of the MOs lie and this must be done via calculations pathway.
NBO Analysis of NH3
Optimisation of Molecule
NH3 molecule was created and optimised using DFT B3LYP method with 6-31G(d,p) basis set with additional keywords of 'int=ultrafine CPHF=fine'. In addition, the symmetry of molecule was restricted to C3v and the tolerance limit to very tight (0.0001). All these were done to a very tight convergence criteria which leads to better optimisation of the molecule. The calculations for the optimisation of NH3 using the method mentioned earlier are shown here.
The table below shows the information of NH3 optimisation using the method mentioned earlier:
| File Type | .log |
| Calculation Type | FOPT |
| Calculation Method | RB3LYP |
| Basis Set | 6-31G(d,p) |
| Charge | 0 |
| Spin | Singlet |
| Total Energy / atomic units | -56.55776873 |
| RMS Gradient Norm | 0.00000323 |
| Imaginary Freq | n/a |
| Dipole Moment / Debye | 1.85 |
| Point Group | C3v |
| Calculation Duration / seconds | 37.0 |
The information shown below indicates that both the forces and displacements for molecule optimisation were converged. This means that the job of optimisation of NH3 was done.
         Item               Value     Threshold  Converged?
 Maximum Force            0.000006     0.000015     YES
 RMS     Force            0.000004     0.000010     YES
 Maximum Displacement     0.000012     0.000060     YES
 RMS     Displacement     0.000008     0.000040     YES
 Predicted change in Energy=-9.844226D-11
 Optimization completed.
    -- Stationary point found.
The figure below shows a molecule of NH3:
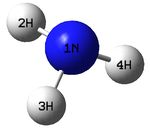
The N-H bond distance was found to be 1.02 Å and H-N-H bond angle to be 105.7° in NH3 from calculations. The calculated N-H bond length (1.02 Å) agrees well with the literature value (1.01 Å, determined by IR spectroscopy). The predicted H-N-H bond angle (105.7°) also agrees well with the literature value (106.7°) [1] This indicates that the calculations carried out by Gaussian is quite accurate.
Frequency Analysis of Molecule
The frequency calculation of NH3 was based on the previous optimised molecule. The calculations for the frequency of NH3 are shown here.
The table below shows the information of NH3 calculations using the method mentioned earlier:
| File Type | .log |
| Calculation Type | FREQ |
| Calculation Method | RB3LYP |
| Basis Set | 6-31G(d,p) |
| Charge | 0 |
| Spin | Singlet |
| Total Energy / atomic units | -56.55776872 |
| RMS Gradient Norm | 0.00000322 |
| Imaginary Freq | 0 |
| Dipole Moment / Debye | 1.85 |
| Point Group | C3 |
| Calculation Duration / seconds | 10.0 |
The information shown below indicates that both the forces and displacements for molecule calculations were converged. This means that the job of calculations for NH3 was done.
         Item               Value     Threshold  Converged?
 Maximum Force            0.000006     0.000450     YES
 RMS     Force            0.000003     0.000300     YES
 Maximum Displacement     0.000013     0.001800     YES
 RMS     Displacement     0.000007     0.001200     YES
 Predicted change in Energy=-1.131568D-10
 Optimization completed.
    -- Stationary point found.
Two lines of low frequencies from the log file are presented below:
Low frequencies ---   0    0    0    7    8    8
Low frequencies --- 1089 1694 1694
The first line of 'low frequencies' values are within ± 15 cm-1 and absence of negative frequencies observed in the second line of 'low frequencies' indicate that the molecule is fully optimised.
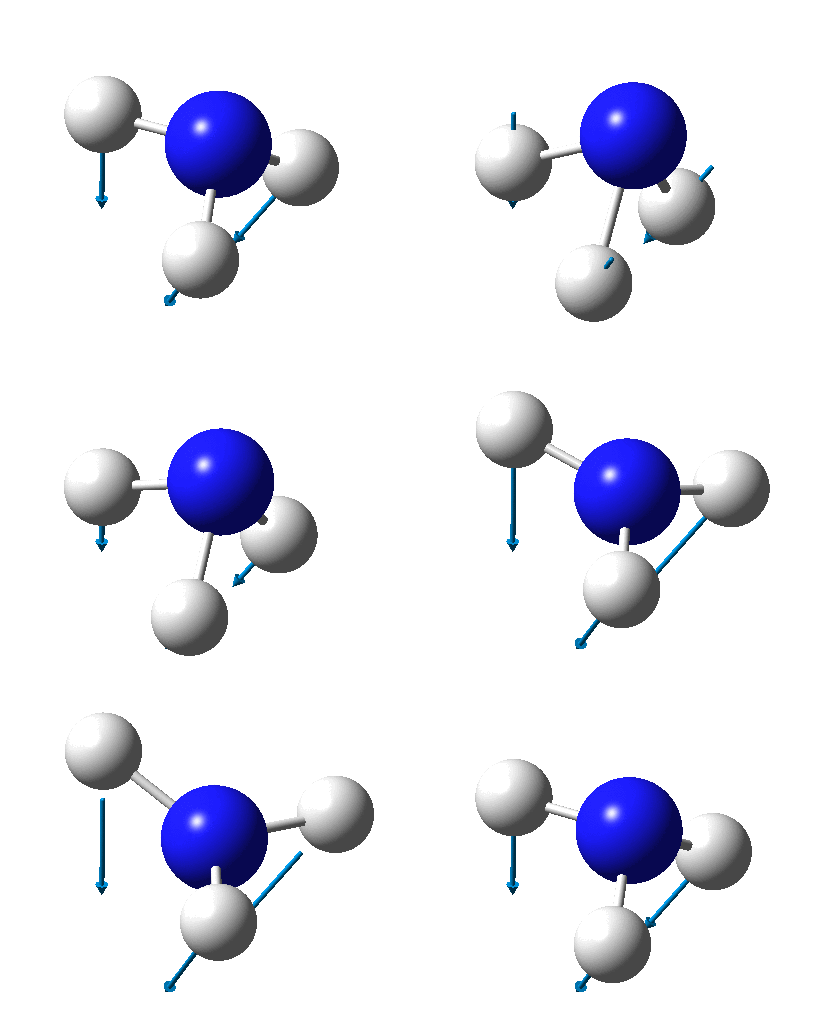
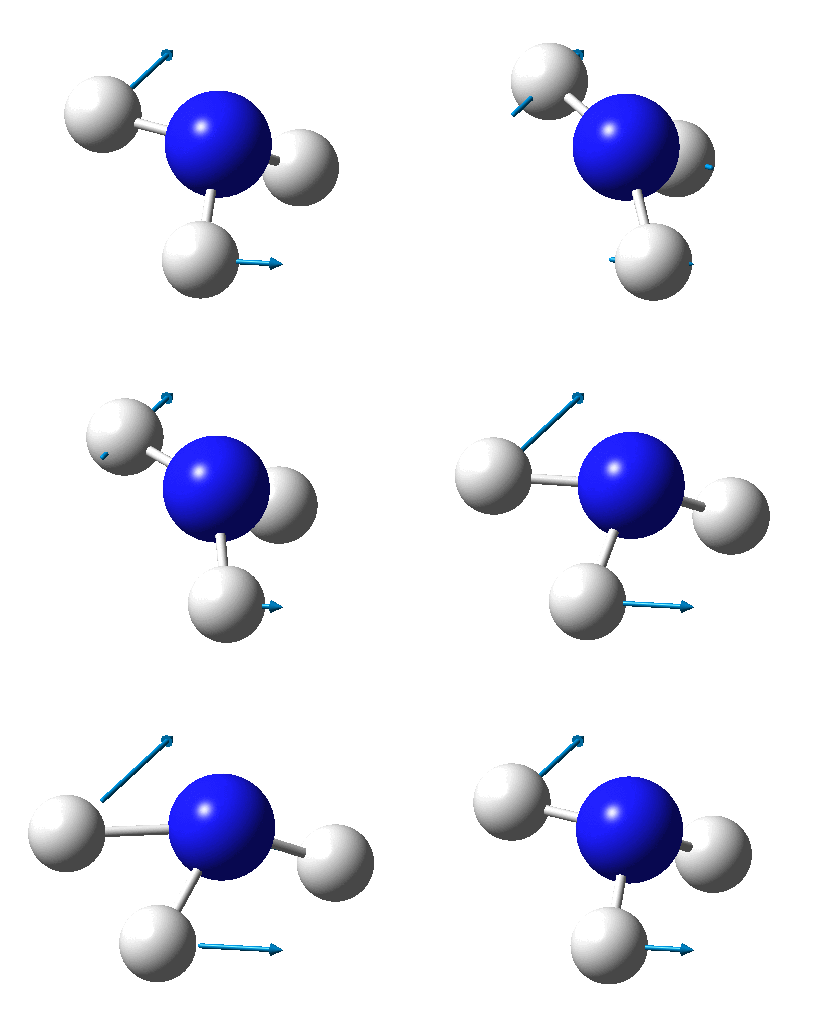
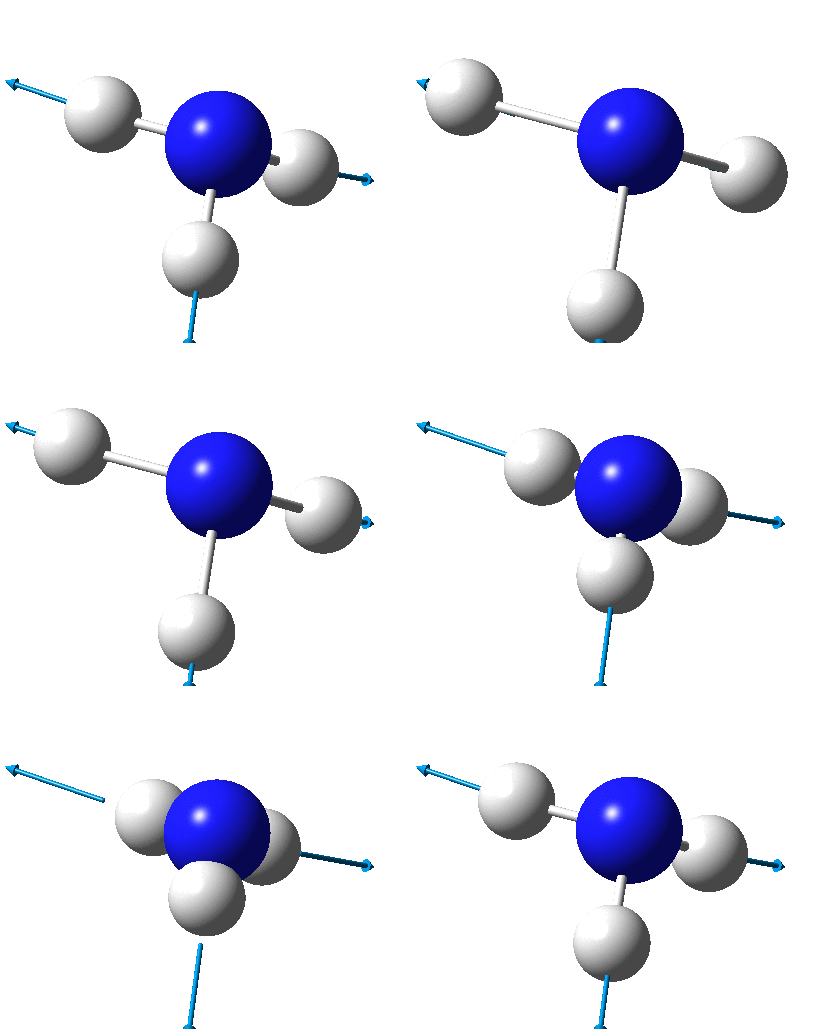
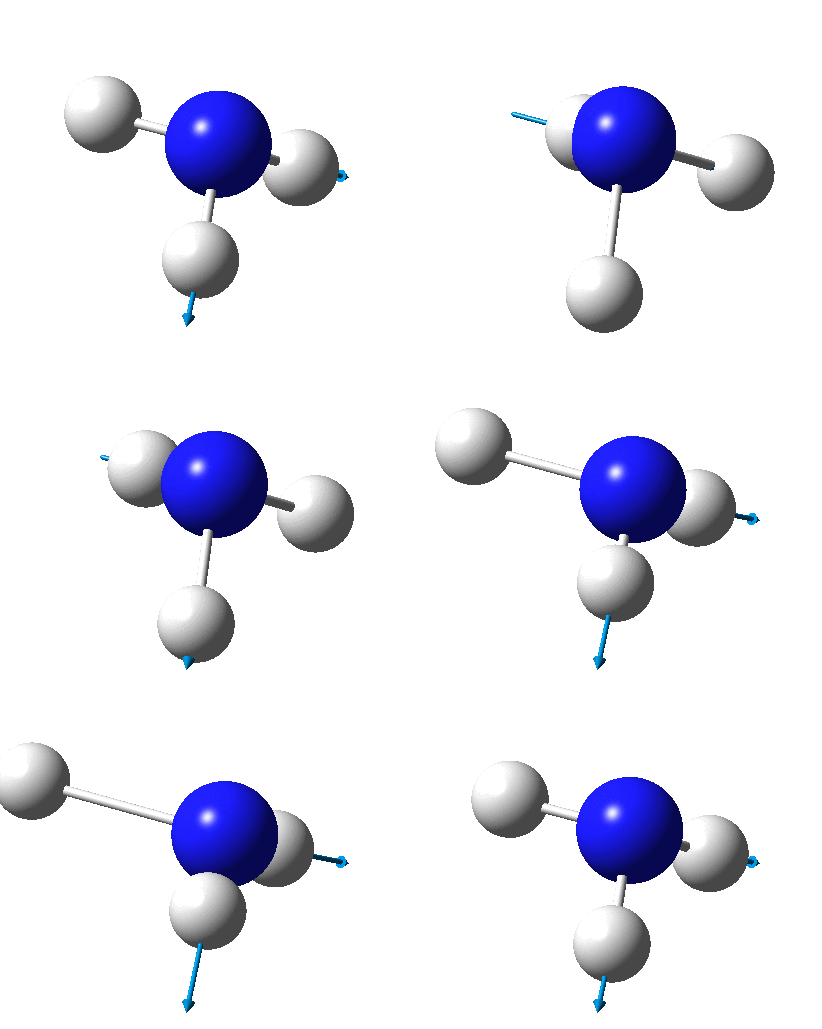
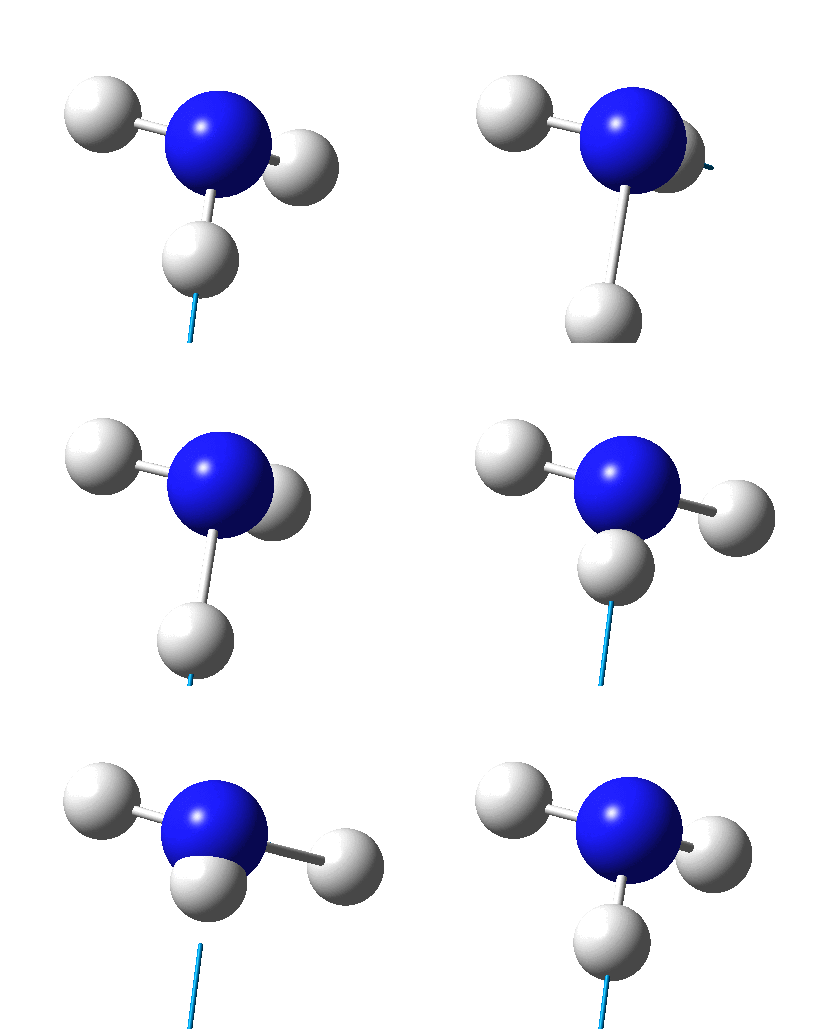
Animations of NH3 Vibrations
The table below shows the results from the frequency vibrations calculations of NH3:
The computed IR spectrum of NH3 is shown below:
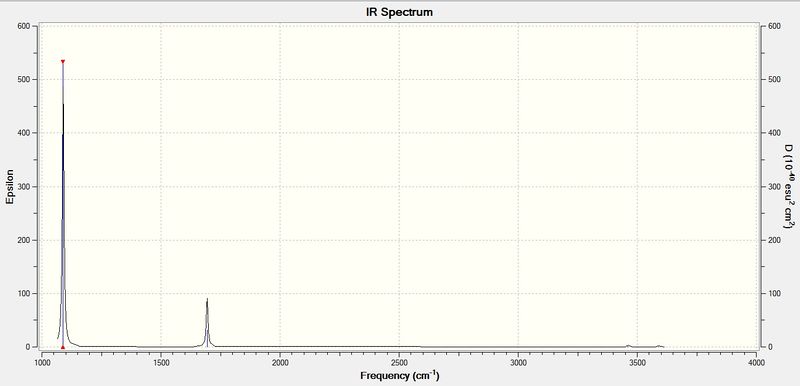
Every molecule has 3N vibrational frequencies where N is the number of atoms present and the number 3 represents that the molecule is in three-dimensional space. However, the actual vibrational frequencies of a molecule is 3N-6 where the term '-6' represents the possible motions of the center of mass of the molecule which need to be eliminated. From the formula 3N-6, the number of vibrational peaks of NH3 is 6 but there are only three peaks observed in the predicted spectrum. This is due to the fact that IR spectroscopy only records vibrations which show a change in dipole. Hence, vibration numbers 5 and 6 (v=3590 cm-1) in the table above is not recorded because there is no change in dipole moment. Peak numbers 2 and 3 (v=1694 cm-1) are degenerate as the vibration frequency is the same which shows up as a tall peak in the spectrum. A total of three peaks are recorded in the predicted spectrum of the molecule. Note that the peak at 3461 cm-1 is hardly observed due to its very low intensity.
NBO Results and Discussion
Calculations for the population analysis of NH3 can be found in the following link: DOI:10042/27645
The image below shows the charge distribution of ammonia represented by red and green colours:
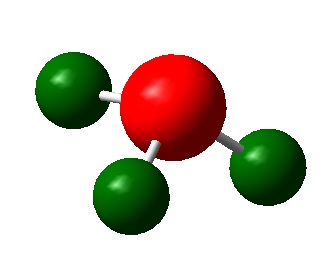 |
A bright green colour of an atom indicates a highly positive charge is deposited on it. A bright red colour of an atom indicates a highly negative charge is deposited on it. Hence, from the figure above, the nitrogen atom which is electronegative has a red colour. The nitrogen atom has a lone pair of electrons and has a tendency to pull electron density from hydrogen atoms towards itself. This results in a highly negative charge is deposited on it. Hydrogen atoms which is electropositive has a green colour. Note that the charge range is between -1.000 to 1.000.
The image below shows the numerical charge distribution of ammonia:
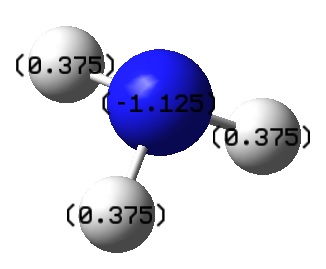 |
From the image above, the specific NBO charges for the nitrogen and hydrogen atoms are -1.125 and 0.375 respectively. Note that the NBO charge for the nitrogen atom exceeds the charge range.
Reaction Energies of Ammonia-Borane
Optimisation of Molecule
A molecule of NH3BH3 was created and optimised using DFT B3LYP method with 6-31G(d,p) basis set with additional keywords of 'int=ultrafine CPHF=fine'. The additional keywords reflect a very tight convergence criteria which leads to better optimisation of the molecule. The calculations for the optimisation of NH3BH3 using the method mentioned earlier are shown here.
The table below shows the information of NH3BH3 optimisation using the method mentioned earlier:
| File Type | .log |
| Calculation Type | FOPT |
| Calculation Method | RB3LYP |
| Basis Set | 6-31G(d,p) |
| Charge | 0 |
| Spin | Singlet |
| Total Energy / atomic units | -83.22468907 |
| RMS Gradient Norm | 0.00000122 |
| Imaginary Freq | n/a |
| Dipole Moment / Debye | 5.56 |
| Point Group | C1 |
| Calculation Duration / seconds | 82.0 |
The information shown below indicates that both the forces and displacements for molecule optimisation were converged. This means that the job of optimisation of NH3BH3 was done.
         Item               Value     Threshold  Converged?
 Maximum Force            0.000002     0.000015     YES
 RMS     Force            0.000001     0.000010     YES
 Maximum Displacement     0.000027     0.000060     YES
 RMS     Displacement     0.000009     0.000040     YES
 Predicted change in Energy=-9.031911D-11
 Optimization completed.
    -- Stationary point found.
The figure below shows a molecule of NH3BH3 (with labeled atoms):
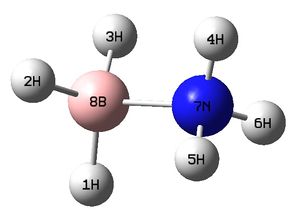
The bond distance B-H was found to be 1.21 Å and H-B-H bond angle to be 113.9° from calculations. In addition, the N-H bond distance is 1.02 Å and H-N-H bond angle is 107.9°. The B-N bond length in this molecule is 1.67 Å. According to literature, the B-N bond distance is 1.592 Å whereas the predicted value is 1.67 Å. There is a slight difference between these two values. The literature values for N-H and B-H bond lengths are 1.030 Å and 1.222 Å respectively. This is comparable with calculated values (1.02 Å for N-H and 1.21 Å for B-H). [9]
Frequency Calculations of Molecule
The frequency calculation of NH3BH3 was based on the previous optimised molecule. The calculations for the frequency of NH3BH3 are shown here.
The table below shows the information of NH3BH3 calculations:
| File Type | .log |
| Calculation Type | FREQ |
| Calculation Method | RB3LYP |
| Basis Set | 6-31G(d,p) |
| Charge | 0 |
| Spin | Singlet |
| Total Energy / atomic units | -83.22468907 |
| RMS Gradient Norm | 0.00000134 |
| Imaginary Freq | 0 |
| Dipole Moment / Debye | 5.56 |
| Point Group | C1 |
| Calculation Duration / seconds | 99.0 |
The information shown below indicates that both the forces and displacements for molecule calculations were converged. This means that the job of calculations for NH3BH3 was done.
         Item               Value     Threshold  Converged?
 Maximum Force            0.000005     0.000450     YES
 RMS     Force            0.000001     0.000300     YES
 Maximum Displacement     0.000029     0.001800     YES
 RMS     Displacement     0.000011     0.001200     YES
 Predicted change in Energy=-1.204783D-10
 Optimization completed.
    -- Stationary point found.
Two lines of low frequencies from the log file are presented below:
Low frequencies ---   -6   0    0    0    3    4
Low frequencies ---  263  633  638
The first line of 'low frequencies' values are within ± 15 cm-1 and absence of negative frequencies observed in the second line of 'low frequencies' indicate that the molecule is fully optimised.
Association Energy Calculations of Molecule
The equation below shows the reaction between NH3 and BH3:
We can calculate the association energy for the reaction as the total energy of the reactants and product have been calculated. From previous calculations, the total energy of following molecules are shown below:
E(NH3)= -56.55776872 a.u.
E(BH3)= -26.61532360 a.u.
E(NH3BH3)= -83.22468907 a.u.
The energy difference, ΔE is the association/dissociation energy for this reaction and the calculations are shown below:
ΔE=E(NH3BH3)-[E(NH3)+E(BH3)]
ΔE= -83.22468907 a.u. + 56.55776872 a.u. + 26.61532360 a.u. = -0.05159675 a.u.
Therefore the association energy is equal to -0.05159675 a.u. (-135.5 kJ mol-1)
The calculated dissociation energy of B-N bond in NH3BH3 (135.5 kJ mol-1) matches well with the literature value ((31.1 ± 1.0) kcal mol-1 or (130.1 ± 4.2) kJ mol-1). [10] The energy difference between the predicted and experimental values may be due to some interactions that have been taken into account by calculation approximations.
Part 2: Mini Project
Introduction to Ionic Liquids
Ionic liquids are composed entirely of ions and can stay in liquid state at temperatures as low as -96 °C. Molten sodium chloride is an example of ionic liquid. Volatile organic compounds (VOCs) are normally used as solvent systems in synthesis processes at industrial scale. Unfortunately, usage of VOCs in large amount as solvent is a major source of environmental pollution. Room-temperature ionic liquid is a very good replacement for VOCs as they have no detectable vapour pressure, which means they are hard to escape to the atmosphere. Other than this 'green' properties, ionic liquids can be designed and tuned for a particular reaction, whether the aim is to optimise the yield, selectivity, reactants solubility and more. Hence, ionic liquids can be used as solvents in many solvent-requiring processes. [11]
Some of the physical properties of ionic liquids are as followed: [12]
(i) good solubility for wide range of organic and inorganic compounds which makes it good to bring them to react in the same phase.
(ii) composed of poorly coordinating ions which makes it good highly polar but non-coordinating solvent
(iii) provide a non-aqueous, polar environment for two-phase systems where immiscible organic solvents are present
Few of the reactions where ionic liquids can be used as solvents include hydroformylation, hydrogenation reactions, Diels-Alder reactions and more. [12] In designing an ionic liquid, the cation and anion combination are engineered to give an ionic liquid with the desired properties for a specified purpose. Computational chemistry is important in predicting the properties of ionic liquids before synthesise them as it is impossible to synthesise a wide range of certain ionic liquids derivatives and investigate their physical and chemical properties. In this part, a number of selected cations are chosen to investigate their properties via computational calculations by Gaussian.
Part 1: Comparison of Selected 'Onium' Cations
Optimisation and Frequency Analysis of Molecules
[N(CH3)4]+
Optimisation
A molecule of [N(CH3)4]+ was created in GaussView and optimised using DFT B3LYP method with 6-31G(d,p) as basis set. Additional keywords 'int=ultrafine CPHF=fine' and tight optimisation were used in the calculations to introduce a very tight convergence criteria. The calculations for the optimisation of the molecule using the method mentioned earlier can be found here: DOI:10042/27689
The table below shows the information of [N(CH3)4]+ optimisation using the method mentioned earlier:
| File Type | .log |
| Calculation Type | FOPT |
| Calculation Method | RB3LYP |
| Basis Set | 6-31G(d,p) |
| Charge | 1 |
| Spin | Singlet |
| Total Energy / atomic units | -214.18127423 |
| RMS Gradient Norm | 0.00000539 |
| Imaginary Freq | n/a |
| Dipole Moment / Debye | 0.00 |
| Point Group | C1 |
| Calculation Duration | 1 hour 31 minutes 28.8 seconds |
The information shown below indicates that both the forces and displacements for molecule optimisation were converged. This means that the job of optimisation of [N(CH3)4]+ was done.
         Item               Value     Threshold  Converged?
 Maximum Force            0.000013     0.000015     YES
 RMS     Force            0.000003     0.000010     YES
 Maximum Displacement     0.000047     0.000060     YES
 RMS     Displacement     0.000016     0.000040     YES
 Predicted change in Energy=-3.777650D-10
 Optimization completed.
    -- Stationary point found.
The figure below shows a molecule of [N(CH3)4]+:
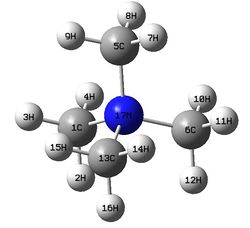
The molecule has following bond lengths and angles from calculations:
C-N bond length and C-N-C bond angle: 1.51 Å, 109.5°
C-H bond length and H-C-H bond angle: 1.09 Å, 110.0°
N-C-H bond angle: 108.9°
Calculated C-N bond length and C-N-C bond angle are compared with literature values (1.46 Å for average C-N distance and 109.4° for average C-N-C bond angle). From the comparison, the calculated C-N bond length is slightly longer than the literature value (1.46 Å) and accepted single C-N bond distance (1.47 Å). There is a good agreement between the calculated and literature bond angles. Note that the compound in the literature source used for comparison is [N(CH3)4][MnCl3]. [13] There may be slight differences of bond lengths and angles in the cation species between different compounds composed of same cation but different anion species due to interactions between them. Higher level basis set should be used to improve the accuracy of the results regarding the bond lengths in the molecule.
Frequency Calculations
The frequency calculation of [N(CH3)4]+ was based on the previous optimised molecule. The calculations for the frequency of [N(CH3)4]+ can be found here: DOI:10042/27690
The table below shows the information of [N(CH3)4]+ calculations:
| File Type | .log |
| Calculation Type | FREQ |
| Calculation Method | RB3LYP |
| Basis Set | 6-31G(d,p) |
| Charge | 1 |
| Spin | Singlet |
| Total Energy / atomic units | -214.18127396 |
| RMS Gradient Norm | 0.00000541 |
| Imaginary Freq | 0 |
| Dipole Moment / Debye | 0.00 |
| Point Group | C1 |
| Calculation Duration | 27 minutes 19.1 seconds |
The information shown below indicates that both the forces and displacements for molecule calculations were converged. This means that the job of calculations for [N(CH3)4]+ was done.
         Item               Value     Threshold  Converged?
 Maximum Force            0.000025     0.000450     YES
 RMS     Force            0.000005     0.000300     YES
 Maximum Displacement     0.000191     0.001800     YES
 RMS     Displacement     0.000067     0.001200     YES
 Predicted change in Energy=-2.141776D-09
 Optimization completed.
    -- Stationary point found.
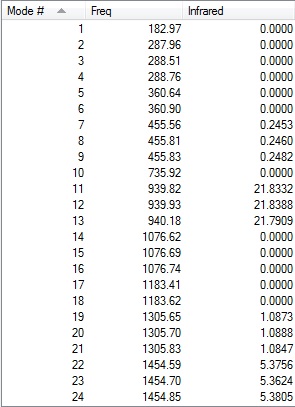
Two lines of low frequencies from the log file are presented below:
Low frequencies ---   -5   0    0    0    2   10
Low frequencies ---  183  288  289
The figures below shows the vibrational frequencies with intensities of [N(CH3)4]+:
 |
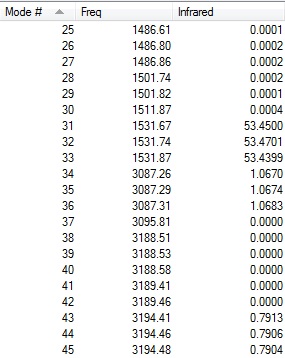 |
The first line of 'low frequencies' values are within ± 15 cm-1 and absence of negative frequencies observed in figures above indicate that the molecule is fully optimised.
[P(CH3)4]+
Optimisation
A molecule of [P(CH3)4]+ was created in GaussView and optimised using DFT B3LYP method with 6-31G(d,p) as basis set. Additional keyword 'int=ultrafine' and tight optimisation were used in the calculations to introduce a very tight convergence criteria. The calculations for the optimisation of the molecule using the method mentioned earlier can be found here: DOI:10042/27691
The table below shows the information of [P(CH3)4]+ calculations:
| File Type | .log |
| Calculation Type | FOPT |
| Calculation Method | RB3LYP |
| Basis Set | 6-31G(d,p) |
| Charge | 1 |
| Spin | Singlet |
| Total Energy / atomic units | -500.82700888 |
| RMS Gradient Norm | 0.00000522 |
| Imaginary Freq | n/a |
| Dipole Moment / Debye | 0.00 |
| Point Group | C1 |
| Calculation Duration | 35 minutes 18.6 seconds |
The information shown below indicates that both the forces and displacements for molecule optimisation were converged. This means that the job of optimisation of [P(CH3)4]+ was done.
         Item               Value     Threshold  Converged?
 Maximum Force            0.000011     0.000015     YES
 RMS     Force            0.000003     0.000010     YES
 Maximum Displacement     0.000058     0.000060     YES
 RMS     Displacement     0.000018     0.000040     YES
 Predicted change in Energy=-1.876010D-09
 Optimization completed.
    -- Stationary point found.
The figure below shows a molecule of [P(CH3)4]+:
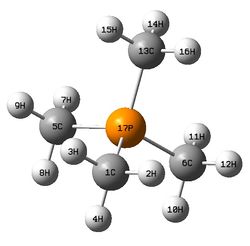
The molecule has following bond lengths and angles from calculations:
C-P bond length and C-P-C bond angle: 1.82 Å, 109.5°
C-H bond length and H-C-H bond angle: 1.09 Å, 109.0°
P-C-H bond angle: 110.0°
Calculated C-P bond length and C-P-C bond angle is compared with literature values (1.80 Å for average C-P distance and 108.6° for average C-P-C bond angle). From the comparison, the calculated C-P bond length agrees well the literature value (1.80 Å). The calculated C-P-C bond angle is slightly greater than the literature value obtained (108.6°). Note that the compound in the literature source used for comparison is [P(CH3)4]2[CuBr4]. [14] There may be slight differences of bond lengths and angles in the cation species between different compounds composed of same cation but different anion species due to interactions between them. Higher level basis set should be used to improve the accuracy of the results regarding the bond angles in the molecule.
Frequency Calculations
The frequency calculation of [P(CH3)4]+ was based on the previous optimised molecule. The calculations for the frequency of [P(CH3)4]+ can be found here: DOI:10042/27692
The table below shows the information of [P(CH3)4]+ calculations:
| File Type | .log |
| Calculation Type | FREQ |
| Calculation Method | RB3LYP |
| Basis Set | 6-31G(d,p) |
| Charge | 1 |
| Spin | Singlet |
| Total Energy / atomic units | -500.82700995 |
| RMS Gradient Norm | 0.00000643 |
| Imaginary Freq | 0 |
| Dipole Moment / Debye | 0.00 |
| Point Group | C1 |
| Calculation Duration | 20 minutes 15.7 seconds |
The information shown below indicates that both the forces and displacements for molecule calculations were converged. This means that the job of calculations for [P(CH3)4]+ was done.
         Item               Value     Threshold  Converged?
 Maximum Force            0.000036     0.000450     YES
 RMS     Force            0.000006     0.000300     YES
 Maximum Displacement     0.000888     0.001800     YES
 RMS     Displacement     0.000397     0.001200     YES
 Predicted change in Energy=-1.282480D-08
 Optimization completed.
    -- Stationary point found.
Two lines of low frequencies from the log file are presented below:
Low frequencies ---  -10   0   0   0    1    5
Low frequencies ---  156  192  192
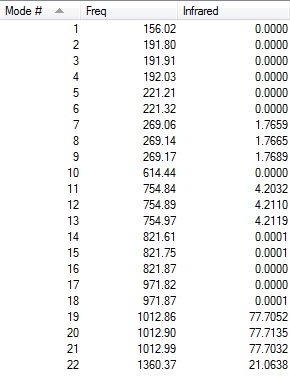
The figures below shows the vibrational frequencies with intensities of [P(CH3)4]+:
 |
 |
The first line of 'low frequencies' values are within ± 15 cm-1 and absence of negative frequencies observed in figures above indicate that the molecule is fully optimised.
[S(CH3)3]+
Optimisation
A molecule of [S(CH3)3]+ was created in GaussView and optimised using DFT B3LYP method with 6-31G(d,p) as basis set. The symmetry of the molecule was restricted to C3v with very tight tolerance limit (0.0001). Additional keyword 'int=ultrafine and CPHF=fine' and tight optimisation were used in the calculations to introduce a very tight convergence criteria. The calculations for the optimisation of the molecule using the method mentioned earlier can be found here: DOI:10042/27694
The table below shows the information of [S(CH3)3]+ calculations:
| File Type | .log |
| Calculation Type | FOPT |
| Calculation Method | RB3LYP |
| Basis Set | 6-31G(d,p) |
| Charge | 1 |
| Spin | Singlet |
| Total Energy / atomic units | -517.68327302 |
| RMS Gradient Norm | 0.00000071 |
| Imaginary Freq | n/a |
| Dipole Moment / Debye | 0.97 |
| Point Group | C3v |
| Calculation Duration | 3 minutes 29.5 seconds |
The information shown below indicates that both the forces and displacements for molecule optimisation were converged. This means that the job of optimisation of [S(CH3)3]+ was done.
         Item               Value     Threshold  Converged?
 Maximum Force            0.000001     0.000015     YES
 RMS     Force            0.000001     0.000010     YES
 Maximum Displacement     0.000049     0.000060     YES
 RMS     Displacement     0.000016     0.000040     YES
 Predicted change in Energy=-1.211309D-10
 Optimization completed.
    -- Stationary point found.
The figure below shows a molecule of [S(CH3)3]+:
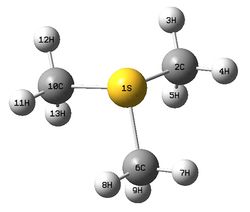
The molecule has following key bond lengths and angles from calculations:
C-S bond length and C-S-C bond angle: 1.82 Å, 102.7°
C-H bond length: 1.09 Å
Calculated C-S bond length and C-S-C bond angle are compared with literature values (1.80 Å for average C-S distance and 101.4° for average C-N-C bond angle). From the comparison, the calculated C-S bond length agrees well the literature value (1.80 Å). The calculated C-S-C bond is slightly greater than literature value (101.4°). Note that the compound in the literature source used for comparison is (CH3)3SI. [15] There may be slight differences of bond lengths and angles in the cation species between different compounds composed of same cation but different anion species due to interactions between them. Higher level basis set should be used to improve the accuracy of the results regarding the bond angles in the molecule.
Frequency Calculations
The frequency calculation of [S(CH3)3]+ was based on the previous optimised molecule. The calculations for the frequency of [S(CH3)3]+ can be found here: DOI:10042/27695
| File Type | .log |
| Calculation Type | FREQ |
| Calculation Method | RB3LYP |
| Basis Set | 6-31G(d,p) |
| Charge | 1 |
| Spin | Singlet |
| Total Energy / atomic units | -517.68327302 |
| RMS Gradient Norm | 0.00000090 |
| Imaginary Freq | 0 |
| Dipole Moment / Debye | 0.97 |
| Point Group | C3v |
| Calculation Duration | 4 minutes 52.9 seconds |
The information shown below indicates that both the forces and displacements for molecule calculations were converged. This means that the job of calculations for [S(CH3)3]+ was done.
         Item               Value     Threshold  Converged?
 Maximum Force            0.000002     0.000450     YES
 RMS     Force            0.000001     0.000300     YES
 Maximum Displacement     0.000053     0.001800     YES
 RMS     Displacement     0.000020     0.001200     YES
 Predicted change in Energy=-1.355985D-10
 Optimization completed.
    -- Stationary point found.
Two lines of low frequencies from the log file are presented below:
Low frequencies ---   -8   -8   -8    0   0    0
Low frequencies ---  162  200  200
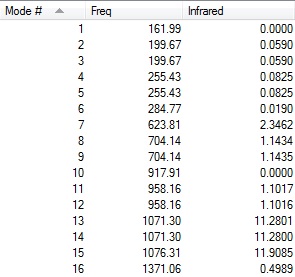
The figures below shows the vibrational frequencies with intensities of [S(CH3)3]+:
 |
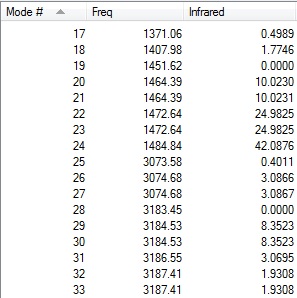 |
The first line of 'low frequencies' values are within ± 15 cm-1 and absence of negative frequencies observed in figures above indicate that the molecule is fully optimised.
Structure Comparison Between [N(CH3)4]+, [P(CH3)4]+ and [S(CH3)3]+
The table below shows the key calculated bond lengths and bond angles in the molecules. Note that the term 'X' in C-X bond distance and C-X-C bond angle indicates the type of central atom (either N, P or S atom) present in the molecule.
| Compound | C-X bond distance / Å | C-X-C bond angle / ° | C-H bond distance / Å |
| [N(CH3)4]+ | 1.51 | 109.5 | 1.09 |
| [P(CH3)4]+ | 1.82 | 109.5 | 1.09 |
| [S(CH3)3]+ | 1.82 | 102.7 | 1.09 |
The C-H bond length of methyl groups present in all molecules is the same (1.09 Å) which indicates that the central atoms have little effect on bonding of C-H in the methyl groups. Comparisons of C-X bond length and C-X-C bond angle are made between these three molecules and the results will be rationalized by the sizes of the central atoms. C-P and C-S bond lengths in [P(CH3)4]+ and [S(CH3)3]+ are the same (1.82 Å). Phosphorus and sulfur atoms have the same covalent radii (empirically measured covalent radii of 1.00 Å) [5] and it is expected to observe atoms which have same radii will form bond with another atom of same type have the same bond length. This is indeed what is observed in the calculations even though one electron is removed from the system in both molecules. The C-N bond length in [N(CH3)4]+ is shorter than the C-P and C-S bond lengths in [P(CH3)4]+ and [S(CH3)3]+ respectively. Nitrogen has a smaller covalent radius (0.65 Å) [5] than both phosphorus and sulfur atoms. This is because the radius of a atom increases down a group as orbitals of quantum number n increase down the group in the periodic table. Reduced bond length will be observed when a smaller atom such as nitrogen (compared to phosphorus and sulfur) atom is involved in the bond formation.
In a ideal tetrahedral structure, the angle between the ligand and central atoms is 109.5°. [16] [N(CH3)4]+ and [P(CH3)4]+ have the same structure, i.e. tetrahedral molecular geometry, which is reflected by the same C-X-C bond angle as ideal tetrahedral angle. [S(CH3)3]+ adopts a trigonal pyramidal molecular geometry in which the C-S-C bond angle is 102.7°, similar to the one in trigonal pyramidal NF3 (102.1°). The reason for [S(CH3)3]+ adopts a different molecular geometry than [P(CH3)4]+ and [N(CH3)4]+ can be explained by VSEPR theory. The sulfur atom has a lone pair of electrons in the molecule and it occupies more space on the surface of the atom than a bonding pair (S-C) and hence the C-S-C bond angle is smaller than C-P-C bond angle in [P(CH3)4]+. [17]
Population Analysis of Molecules
Calculations for the molecular orbitals (MOs)and natural bond orbitals (NBO) of the molecules were based on the previous optimised molecules. The results of calculations for the molecules can be found in the links below:
[N(CH3)4]+: DOI:10042/27696
[P(CH3)4]+: DOI:10042/27697
[S(CH3)3]+: DOI:10042/27698
Note that .log files from the links are used for the NBO analysis and .fchk files are used for MO analysis of the molecules.
MO of [N(CH3)4]+
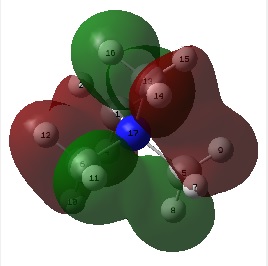
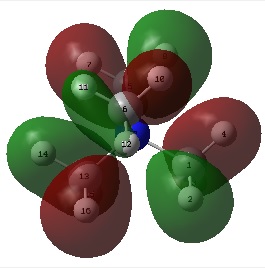
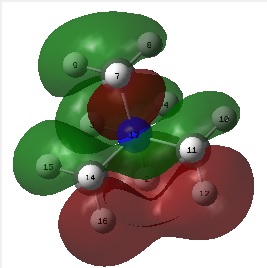
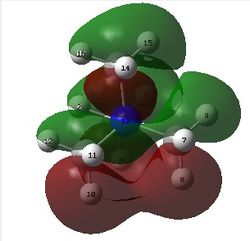
The table below shows five selected, occupied non-core MOs of [N(CH3)4]+ ranging from highly bonding to highly antibonding character and interactions occur within the MOs.
NBO Charge Analysis of Molecules
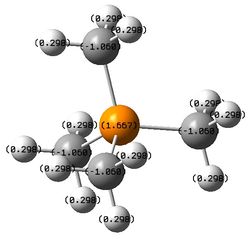
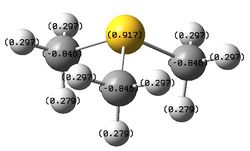
The figures below show the colour-indicated and numerical charge distribution across [N(CH3)4]+, [P(CH3)4]+ and [S(CH3)3]+. Colour range is included alongside the figures as reference. A bright green colour of an atom indicates a highly positive charge is deposited on it. A bright red colour of an atom indicates a highly negative charge is deposited on it. Note that the charge range is between -1.667 to 1.667.
| [N(CH3)4]+ | [P(CH3)4]+ | [S(CH3)3]+ |
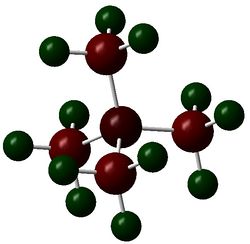 |
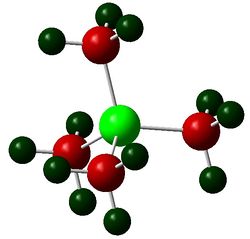 |
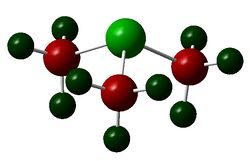
|
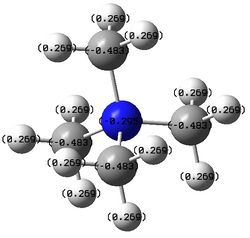 |
 |
|
The table below shows the numerical charges of atoms in each molecule:
| Charge | |||
| Molecule | N/P/S | C | H |
| [N(CH3)4]+ | -0.295 | -0.483 | 0.269 |
| [P(CH3)4]+ | 1.667 | -1.060 | 0.298 |
| [S(CH3)3]+ | 0.917 | -0.846 | 0.279, 0.297 |
Electronegativity of following elements are found from literature source: C (2.55), S (2.58) [18], P (2.19) and N (3.04) [19]
The carbon atoms of methyl groups in each chemical species have different charge values. This is because the carbon atoms are bonded to central atoms which have different electronegativity with nitrogen being the most electronegative among the three central atoms. Nitrogen atom withdraws electron density from methyl groups and hence less negative charges are deposited on the carbon atoms. In other words, carbon atoms attached to central nitrogen atoms have highest positive charge, followed by attachment to sulfur and phosphorus atoms as sulfur is less electronegative than nitrogen and phosphorus being the least electronegative atom.
The hydrogen atoms bonded to the carbon atoms in the methyl groups also have different charge values. Carbon atoms which have highest negative charges (attached to central phosphosrus atom) will have highest positive charges deposited on the hydrogen atoms attached to them. The degree of positive charges deposited on the hydrogen atoms decreases from molecules where the central atom is phosphorus followed by sulfur and nitrogen.
According to traditional description, the nitrogen atom in [N(CH3)4]+ bears a formal positive charge. A positive charge on the nitrogen atom indicates that it is not electron-deficient as the positive charge is locally delocalised on the central atom itself. Before bonding, nitrogen atom has five valence electrons. In bonding with four carbons of methyl groups, a electron must be removed from the system so that eight electrons octet structure can be achieved via sharing of valence electrons between nitrogen and four carbon atoms. From the table above, it is clear that the positive charge does not deposit on the nitrogen atom as the positive charges are mostly deposited on the hydrogen atoms in the molecule.
Comparison Between Nature of C-N/P/S Bond in Molecules
The table below shows the relative contribution of C and either N, P or S atoms in the formation of C-N/P/S bond, electronegativity difference between the two types of atoms and the resulting nature of C-N/P/S bond.
| Molecule | Relative contribution of atoms to C-N/P/S bond /% | Electronegativity difference between atoms | Nature of covalent bond | |
|---|---|---|---|---|
| C | N/P/S | |||
| [N(CH3)4]+ | 33.65 | 66.35 | 0.49 | High ionic character |
| [P(CH3)4]+ | 59.57 | 40.43 | 0.36 | Some ionic character |
| [S(CH3)3]+ | 48.67 | 51.33 | 0.03 | Pure covalent bond |
An atom which is more electronegative than another bonding atom tends to contribute more in the formation of the bond. In [N(CH3)4]+, nitrogen atom contributes more than than the carbon atom in formation of C-N bond by pulling electron density towards itself due to its electronegativity. Sulfur is slightly more electronegative than phosphorus and thus sulfur contributes slightly more in the formation of C-S bond than in C-P bond. The covalent C-N bond formed has a high ionic character as demonstrated in the table above where negative charges are deposited on nitrogen and carbon atoms even though nitrogen is more electronegative than carbon.
The electronegativity difference between carbon and nitrogen is the greatest compared to C-P and C-S and this should predict that large positive charge and large negative charge deposited on carbon and nitrogen respectively. However this is not observed in the calculations but greater negative charge is deposited on carbon than on nitrogen. One valance electron has been removed from nitrogen in [N(CH3)4]+ to produce a +1 overall charge on the structure. As a result, nitrogen has a smaller negative charge than expected due to removal of one valence electron. The positive charge does not deposit on the nitrogen atom which is being intrinsically electronegative as the positive charges are mostly deposited on the hydrogen atoms in the molecule. Nitrogen and carbon is in the same period of periodic table and hence the orbitals overlap between the two atoms are relatively better compared to carbon and sulfur. Better orbitals overlap between the two atoms allow the negative charge to be shared between them.
The electronegativity difference between carbon and phosphorus is lower then carbon and nitrogen but much greater than carbon and sulfur. As one valence electron is removed from phosphorus to form overall +1 charge on the structure, the positive charge is more delocalised on the phosphorus atom itself (positive charge 1.667) rather than on carbon and hydrogen atoms. This is because phosphorus is much less electronegative than carbon and thus is able to accommodate the positive charge.
The electronegativity difference between carbon and sulfur is the lowest among three types of interactions. Hence the covalent C-S bond has no or very little ionic character. The positive charge from removal of a valence electron from the sulfur atom is deposited on the atom itself (positive charge of 0.917). The carbon atoms accommodate negative charges to achieve overall +1 charge on the structure even though the electronegativity of carbon and sulfur is almost similar.
Part 2: Influence of Functional Groups
One methyl group in the molecule of [N(CH3)4]+ is replaced by -CH2OH group for analysis in terms of MO and NBO. The same analysis is carried out with another structure where one methyl group in [N(CH3)4]+ is replaced by -CH2CN group. The results obtained for both structures is compared alongside with [N(CH3)4]+.
Optimisation and Frequency Analysis of Molecules
[N(CH3)3(CH2OH)]+
Optimisation
A molecule of [N(CH3)3(CH2OH)]+ was created in GaussView and optimised using DFT B3LYP method with 6-31G(d,p) as basis set. Additional keywords 'int=ultrafine CPHF=fine' and tight optimisation were used in the calculations to introduce a very tight convergence criteria. The calculations for the optimisation of the molecule using the method mentioned earlier can be found here: DOI:10042/27749
The table below shows the information of [N(CH3)3(CH2OH)]+ optimisation using the method mentioned earlier:
| File Type | .log |
| Calculation Type | FOPT |
| Calculation Method | RB3LYP |
| Basis Set | 6-31G(d,p) |
| Charge | 1 |
| Spin | Singlet |
| Total Energy / atomic units | -289.39470724 |
| RMS Gradient Norm | 0.00000060 |
| Imaginary Freq | n/a |
| Dipole Moment / Debye | 2.14 |
| Point Group | C1 |
| Calculation Duration | 29 minutes 22.3 seconds |
The information shown below indicates that both the forces and displacements for molecule optimisation were converged. This means that the job of optimisation of [N(CH3)3(CH2OH)]+ was done.
         Item               Value     Threshold  Converged?
 Maximum Force            0.000002     0.000015     YES
 RMS     Force            0.000000     0.000010     YES
 Maximum Displacement     0.000016     0.000060     YES
 RMS     Displacement     0.000005     0.000040     YES
 Predicted change in Energy=-2.302491D-11
 Optimization completed.
    -- Stationary point found.
Frequency Calculations
The frequency calculation of [N(CH3)3(CH2OH)]+ was based on the previous optimised molecule. The calculations for the frequency of [N(CH3)3(CH2OH)]+ can be found here: DOI:10042/27750
The table below shows the information of [N(CH3)3(CH2OH)]+ calculations:
| File Type | .log |
| Calculation Type | FREQ |
| Calculation Method | RB3LYP |
| Basis Set | 6-31G(d,p) |
| Charge | 1 |
| Spin | Singlet |
| Total Energy / atomic units | -289.39470724 |
| RMS Gradient Norm | 0.00000066 |
| Imaginary Freq | 0 |
| Dipole Moment / Debye | 2.14 |
| Point Group | C1 |
| Calculation Duration | 34 minutes 3.2 seconds |
The information shown below indicates that both the forces and displacements for molecule calculations were converged. This means that the job of calculations for [N(CH3)3(CH2OH)]+ was done.
         Item               Value     Threshold  Converged?
 Maximum Force            0.000002     0.000450     YES
 RMS     Force            0.000001     0.000300     YES
 Maximum Displacement     0.000076     0.001800     YES
 RMS     Displacement     0.000020     0.001200     YES
 Predicted change in Energy=-5.031891D-12
 Optimization completed.
    -- Stationary point found.
Two lines of low frequencies from the log file are presented below:
Low frequencies ---   -8  -5   -1   0    0    0
Low frequencies ---  131  213  256
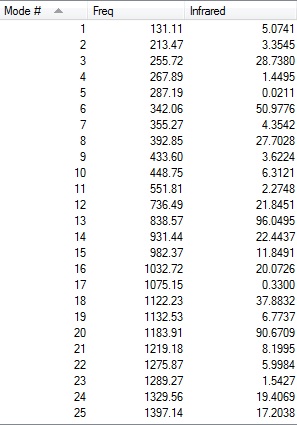
The figures below shows the vibrational frequencies with intensities of [N(CH3)3(CH2OH)]+:
 |
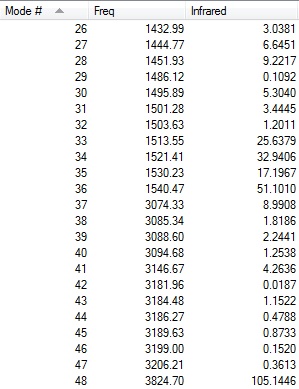 |
The first line of 'low frequencies' values are within ± 15 cm-1 and absence of negative frequencies observed in figures above indicate that the molecule is fully optimised.
[N(CH3)3(CH2CN)]+
Optimisation
A molecule of [N(CH3)3(CH2CN)]+ was created in GaussView and optimised using DFT B3LYP method with 6-31G(d,p) as basis set. Additional keywords 'int=ultrafine CPHF=fine' and tight optimisation were used in the calculations to introduce a very tight convergence criteria. The calculations for the optimisation of the molecule using the method mentioned earlier can be found here: DOI:10042/27754
The table below shows the information of [N(CH3)3(CH2CN)]+ optimisation using the method mentioned earlier:
| File Type | .log |
| Calculation Type | FOPT |
| Calculation Method | RB3LYP |
| Basis Set | 6-31G(d,p) |
| Charge | 1 |
| Spin | Singlet |
| Total Energy / atomic units | -306.39376383 |
| RMS Gradient Norm | 0.00000054 |
| Imaginary Freq | n/a |
| Dipole Moment / Debye | 5.76 |
| Point Group | C1 |
| Calculation Duration | 20 minutes 33.2 seconds |
The information shown below indicates that both the forces and displacements for molecule optimisation were converged. This means that the job of optimisation of [N(CH3)3(CH2CN)]+ was done.
         Item               Value     Threshold  Converged?
 Maximum Force            0.000002     0.000015     YES
 RMS     Force            0.000000     0.000010     YES
 Maximum Displacement     0.000037     0.000060     YES
 RMS     Displacement     0.000011     0.000040     YES
 Predicted change in Energy=-4.036381D-11
 Optimization completed.
    -- Stationary point found.
Frequency Calculations
The frequency calculation of [N(CH3)3(CH2CN)]+ was based on the previous optimised molecule. The calculations for the frequency of [N(CH3)3(CH2CN)]+ can be found here: DOI:10042/27756
The table below shows the information of [N(CH3)3(CH2CN)]+ calculations:
| File Type | .log |
| Calculation Type | FREQ |
| Calculation Method | RB3LYP |
| Basis Set | 6-31G(d,p) |
| Charge | 1 |
| Spin | Singlet |
| Total Energy / atomic units | -306.39376383 |
| RMS Gradient Norm | 0.00000062 |
| Imaginary Freq | 0 |
| Dipole Moment / Debye | 5.76 |
| Point Group | C1 |
| Calculation Duration | 38 minutes 20.8 seconds |
The information shown below indicates that both the forces and displacements for molecule calculations were converged. This means that the job of calculations for [N(CH3)3(CH2CN)]+ was done.
         Item               Value     Threshold  Converged?
 Maximum Force            0.000002     0.000450     YES
 RMS     Force            0.000001     0.000300     YES
 Maximum Displacement     0.000079     0.001800     YES
 RMS     Displacement     0.000018     0.001200     YES
 Predicted change in Energy=-1.114795D-11
 Optimization completed.
    -- Stationary point found.
Two lines of low frequencies from the log file are presented below:
Low frequencies ---   -2  0   0    0    7    10
Low frequencies ---   92  154  211
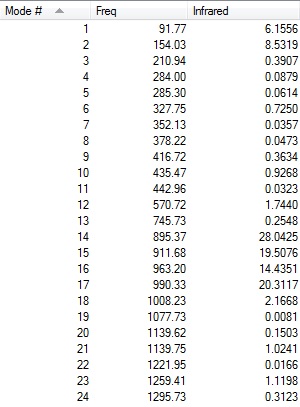
The figures below shows the vibrational frequencies with intensities of [N(CH3)3(CH2CN)]+:
 |
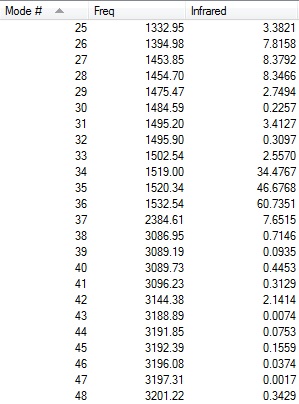 |
The first line of 'low frequencies' values are within ± 15 cm-1 and absence of negative frequencies observed in figures above indicate that the molecule is fully optimised.
Population Analysis of Molecules
Calculations for the molecular orbitals (MOs)and natural bond orbitals (NBO) of the molecules were based on the previous optimised molecules. The results of calculations for the molecules can be found in the links below:
[[N(CH3)3(CH2OH)]+: DOI:10042/27757
[[N(CH3)3(CH2CN)]+: DOI:10042/27758
Note that .log files from the links are used for the NBO analysis and .fchk files are used for MO analysis of the molecules.
NBO Charge Analysis of Molecules
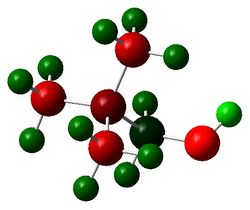
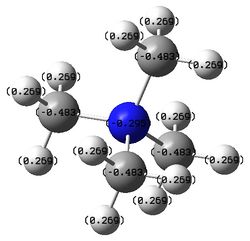
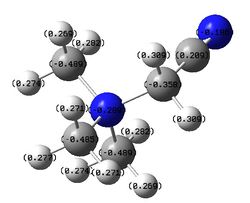
The figures below show the colour-indicated and numerical charge distribution across [N(CH3)4]+, [[N(CH3)3(CH2OH)]+ and [[N(CH3)3(CH2CN)]+. Colour range is included alongside the figures as reference. Note that the charge range is between -0.725 to 0.725.
| [N(CH3)4]+ | [[N(CH3)3(CH2OH)]+ | [[N(CH3)3(CH2CN)]+ |
 |
 |

|
 |
 |
|
The table below shows the numerical charges of atoms in each molecule:
| Charge | |||||
| Molecule | N | C (in -CH2- group) | H (in -CH2- group) | C | H |
| [N(CH3)4]+ | -0.295 | n/a | n/a | -0.483 | 0.269 |
| [[N(CH3)3(CH2OH)]+ | -0.322 | 0.088 | 0.237, 0.249 | -0.491, -0.492, -0.494 | 0.262 to 0.282, 0.521 (in -OH group) |
| [[N(CH3)3(CH2CN)]+ | -0.289 | -0.358 | 0.309 | -0.485, -0.489, 0.209 (in -CN group) | 0.269 to 0.282 |
In [[N(CH3)3(CH2OH)]+, the nitrogen atom has the greatest negative charge (-0.322) than ones in [N(CH3)4]+ (-0.295) and [[N(CH3)3(CH2CN)]+ (-0.289). This is because in [[N(CH3)3(CH2OH)]+, the -OH group which is an electron donating group donates electron density through the -CH2- framework to the nitrogen atom. The carbon atom which is adjacent to electronegative nitrogen and electronegative oxygen will have its electron density being withdrawn away by the two heteroatoms. This is reflected in the carbon atom in -CH2OH group which has a positive charge (0.088) compared to carbon in methyl groups of the molecule (-0.491, -0.492, -0.494). Hydrogen atoms of -CH2 group have fairly less positive charge (0.237, 0.249) on them compared to ones in [[N(CH3)3(CH2CN)]+ (0.309). This is because again the -OH group donates electron density through the -CH2- framework to the nitrogen atom which effectively which reduces positive charges deposited on them.
In [[N(CH3)3(CH2CN)]+, the nitrogen atom has the least negative charge (-0.289) than ones in [N(CH3)4]+ (-0.295) and [[N(CH3)3(CH2OH)]+ (-0.322). This is because in [[N(CH3)3(CH2CN)]+, the -CN group which is an electron withdrawing group withdraws electron density from the nitrogen atom through the -CH2- framework. The carbon atom which is adjacent to nitrogen and -CN group has more negative charge (-0.358) than one in [[N(CH3)3(CH2OH)]+ (0.088). This is because again when the nitrogen in -CN group withdraws electron density from the -CH2, the carbon atom experiences more negative charge. The hydrogen atoms in -CH2-has more positive charges deposited than ones in [[N(CH3)3(CH2OH)]+ (0.237, 0.249) and in methyl groups of [N(CH3)4]+ (0.269) due to the electron withdrawing effect of -CN group in the molecule.
The other carbon and hydrogen atoms that are far away from either the -OH or -CN group in [[N(CH3)3(CH2OH)]+ and [[N(CH3)3(CH2CN)]+ do not experience much electron donating or withdrawing effect from either -OH or -CN group respectively. Hence their charges values are similar to the ones in [N(CH3)4]+.
HOMO and LUMO of Molecules
The table shows the highest occupied molecular orbital (HOMO) and lowest unoccupied molecular orbital (LUMO) of [N(CH3)4]+, [[N(CH3)3(CH2OH)]+ and [[N(CH3)3(CH2CN)]+ for comparison.
Shape of Orbitals
The shapes of HOMOs of the molecules varies from each other to a large extent.
In the HOMO of [N(CH3)4]+, all atoms except H7, H11 and H14 are involved in bonding and antibonding interactions. A higher number of hydrogen atoms (H3, H4, H7, H8, H10, H11 and H14) do not involve in neither bonding nor antibonding interactions in the HOMO of [[N(CH3)3(CH2OH)]+. Compared to [N(CH3)4]+, primary bonding and antibonding interactions are observed in the -CH2OH group as opposed to primary interactions which come from methyl groups in [N(CH3)4]+. This is because the electron density is mainly delocalised around that area due to presence of oxygen atom which is electronegative. Strong through bonding interactions between the methyl groups in [[N(CH3)3(CH2OH)]+ have lost due to previous reason.
The presence of an electron withdrawing group like -CN has a profound effect on the HOMO of [[N(CH3)3(CH2CN)]+. Even more atoms (one methyl group, nitrogen, H6, H8, H11 and H12) are not involved in either bonding nor antibonding interactions within the molecule. Even greater electron density is delocalised around -CH2CN group in the molecule rather than the central nitrogen atom in [N(CH3)4]+ and [[N(CH3)3(CH2OH)]+.
The shapes of LUMOs of the molecules are roughly similar to each other.
In the LUMO of [N(CH3)4]+, large antibonding interaction between s AO of nitrogen and p AOs of carbon atoms is observed (indicated by red part in the centre of molecule being surrounded by large green part). Strong through space bonding interactions are observed between the methyl groups (indicated by green part) which may be the p AOs of carbon atoms that contribute to the interactions.
In the LUMO of [[N(CH3)3(CH2OH)]+, a bonding interaction between s AO of nitrogen, p AO of carbon in -CH2OH group and p AO of oxygen is observed in the molecule. This interaction is fairly stronger than nitrogen in [N(CH3)4]+ due to the presence of -OH as an electron donating group. This interaction is in opposite phase to the strong through space interactions between the methyl groups.
In the LUMO of [[N(CH3)3(CH2CN)]+, large antibonding interaction between s AO of nitrogen and p AOs of carbon atoms is observed (indicated by red part in the centre of molecule being surrounded by large green part). This interaction is similar to the one in [N(CH3)4]+. The antibonding interactions are more enhanced in this molecule due to the presence of -CN group as an electron withdrawing group. This can be seen by large part of opposite interactions occur between the -CH2CN framework (red parts) and strong through space bonding interactions between the methyl groups (indicated by green part).
Energy Levels of Orbitals
The energy levels of HOMO of [[N(CH3)3(CH2OH)]+ and [[N(CH3)3(CH2CN)]+ have changed with respect to the one of [N(CH3)4]+. The energy levels of HOMO of [[N(CH3)3(CH2OH)]+ and [[N(CH3)3(CH2CN)]+ have raised compared to one of [N(CH3)4]+ due to smaller bonding interactions (loss of through space interactions between the methyl groups) and relative increased antibonding interactions in the functional groups.
The energy level of LUMO of [[N(CH3)3(CH2OH)]+ has not changed much with respect to the one of [N(CH3)4]+. This may be because that similar bonding interactions (through space interactions between the methyl groups) are observed in both structures. The energy level of LUMO of [[N(CH3)3(CH2OH)]+ is slightly higher than that of [N(CH3)4]+ because there is additional antibonding interactions between the methyl groups and the nitrogen, carbon and oxygen in -CH2OH framework.
The energy level of LUMO of [[N(CH3)3(CH2CN)]+ is much lower than ones of [[N(CH3)3(CH2OH)]+ and [N(CH3)4]+. This may due to much of the electron density are delocalised around the -CH2CN framework which means less antibonding interactions are to be encountered.
The HOMO-LUMO energy gap decreases from [N(CH3)4]+, [[N(CH3)3(CH2OH)]+ followed by [[N(CH3)3(CH2CN)]+. A chemical species which has small HOMO-LUMO energy gap tends to be more reactive than one that has large HOMO-LUMO energy gap as it is more readily to accept or donate electrons. Hence,the reactivity decreases from [[N(CH3)3(CH2CN)]+, [[N(CH3)3(CH2OH)]+ followed by[N(CH3)4]+ which is opposite to the trend of increasing HOMO-LUMO energy gaps. As these molecules are considered as Lewis acid, [[N(CH3)3(CH2CN)]+ and [[N(CH3)3(CH2OH)]+ accepts an electron pair from a Lewis base easier than [N(CH3)4]+.
Summary
In part 1 of this experiment, structures of BH3, BBr3 and GaBr3 were investigated and compared in terms of their bond length. The calculated bond lengths are consistent with the literature values. Large atoms such as GaBr3 will have longer bond lengths in the compounds compared to small atoms like BH3. Large electronegativity difference between atoms involved in bonding will result in formation of a polar bond and vice versa. IR spectra of BH3 and GaBr3 were predicted and compared in terms of their frequencies and number of observed peaks. This was followed by prediction of MO of BH3 where the predicted MOs agreed well with MOs obtained by qualitative MO theory.
IR spectrum of ammonia was then computed followed by NBO analysis. The NBO analysis confirmed the idea of negative charge is deposited on the nitrogen atom and positive charges on the hydrogen atoms in ammonia. In the last part, association energy of ammonia-borane was calculated from the calculated energies for reactants (NH3 and BH3) and the product. The calculated dissociation energy of B-N bond in ammonia-borane adduct agreed well with the literature value.
In part 2 of this experiment, three 'onium' cations ([N(CH3)4]+, [P(CH3)4]+ and [S(CH3)3]+) were investigated and compared in terms of their bond distances and bond angles. The differences between their bond lengths and angles are explained by size of the central atom and VSEPR theory. MO of [N(CH3)4]+ was calculated and analysed. This was followed by NBO charge analysis of these three molecules and electronegativity values of central atoms were the explanations for the observations. The relative contribution of C and either N, P or S atoms in the formation of C-N/P/S bond in the molecules were shown and rationalised using the same explanation.
After that, one methyl group in the molecule of N(CH3)4]+ is replaced by -CH2OH group for analysis in terms of MO and NBO. The same analysis is carried out with another structure where one methyl group in [N(CH3)4]+ is replaced by -CH2CN group. The results obtained for both structures is compared alongside with N(CH3)4]+ in terms of NBO analysis and HUMO-LUMO MOs. It was found that the reactivity decreases from [[N(CH3)3(CH2CN)]+, [[N(CH3)3(CH2OH)]+ followed by[N(CH3)4]+ which is opposite the increasing HOMO-LUMO energy gaps.
In general, higher basis level should be used to obtain more accurate results. More molecules can be included and their calculated vibrational frequencies data to confirm the trends observed in both part 1 and 2 of this experiment.
References
- ↑ 1.0 1.1 1.2 1.3 1.4 1.5 1.6 D. R. Lide, CRC Handbook of Chemistry and Physics, 85th ed., CRC Press , 2004.
- ↑ 2.0 2.1 2.2 A. Md. Asaduzzaman and G. Schreckenbach, "Computational studies on the interactions among redox couples, additives and TiO2: implications for dye-sensitized solar cells", Phys. Chem. Chem. Phys., 2010, 12, 14609-14618. DOI:10.1039/C0CP01304H
- ↑ 3.0 3.1 W. Guschlbauer and K. Jankowski, "Nucleoside conformation is determined by the electronegativity of the sugar substituent", Nucleic Acids Res., 1980, 8, 1421–1433.
- ↑ 4.0 4.1 V. C. Gibson, S. Mastroianni, A. J. P. White, and D. J. Williams, "Formation and Unexpected Catalytic Reactivity of Organoaluminum Boryloxides", Inorg. Chem., 2001, 40, 826-827. DOI:10.1021/IC000895G
- ↑ 5.0 5.1 5.2 5.3 J. C. Slater, "Atomic Radii in Crystals", J. Chem. Phys., 1964, 41, 3199-3204. DOI:10.1063/1.1725697
- ↑ D. R. T. Zahn, T. U. Kampen, S. Hohenecker, and W. Braun, "GaAs surface passivation by ultra-high vacuum deposition of chalcogen atoms", Vacuum, 2000, 57, 139-144. DOI:10.1016/S0042-207X(00)00122-6
- ↑ L. Pauling, The Nature of the Chemical Bond and the Structure of Molecules and Crystals: An Introduction to Modern Structural Chemistry, 3th ed., Cornell University Press , 1960.
- ↑ P. Atkins and J. de Paula, Atkins' Physical Chemistry, 9th ed., Oxford University Press , 2009.
- ↑ H. Wu, W. Zhou, F. E. Pinkerton, M. S. Meyer, G. Srinivas, T. Yildirim, T. J. Udovic, and J. J. Rush, "A new family of metal borohydride ammonia borane complexes: Synthesis, structures, and hydrogen storage properties", J. Mater. Chem., 2010, 20, 6550-6556. DOI:10.1039/C0JM01542C
- ↑ A. Haaland, "Covalent versus Dative Bonds to Main Group Metals, a Useful Distinction", Angew. Chem. Inf. Ed. Engl., 1989, 28, 992-1007. DOI:10.1002/ANIE.198909921
- ↑ R. D. Rogers and K. R. Seddon, "Ionic Liquids--Solvents of the Future?", Science, 2003, 302, 792-793. DOI:10.1126/SCIENCE.1090313
- ↑ 12.0 12.1 T. Welton, "Room-Temperature Ionic Liquids. Solvents for Synthesis and Catalysis", Chem. Rev., 1999, 99, 2071-2083. DOI:10.1021/CR980032T
- ↑ B. Morosin and E. J. Graeber, "Crystal Structure of Tetramethylammonium Manganese(II) Chloride", Acta Cryst., 1967, 23, 766-770. DOI:10.1107/S0365110X67003688
- ↑ G. Madariaga, M. M. Alberdi, and F. J. Zúñiga, "Structure of [P(CH3)4]2CuBr4 at 293 K", Acta Cryst., 1990, C46, 2363-2366. DOI:10.1107/S010827019000470X
- ↑ M. Jannin, R. Puget, C. de Brauer and R. Perret, "Structures of trimethylsulfonium salts. I. Refinement of the structure of the iodide (CH3)3SI", Acta Cryst., 1991, C47, 982-984. DOI:10.1107/S0108270190008095
- ↑ J. C. Baber and E. E. Hodgkin, "Automatic assignment of chemical connectivity to organic molecules in the Cambridge Structural Database", J. Chem. Inf. Comput. Sci., 1992, 32, 401-406. DOI:10.1021/CI00009A001
- ↑ R. J. Gillespie, "The electron-pair repulsion model for molecular geometry", J. Chem. Educ., 1970, 47, 18-23. DOI:10.1021/ED047P18
- ↑ T. Lin, Y. Tang, Y. Wang, H. Bi, Z. Liu, F. Huang, X. Xie, and M. Jiang, "Scotch-tape-like exfoliation of graphite assisted with elemental sulfur and graphene–sulfur composites for high-performance lithium-sulfur batteries", Energy Environ. Sci., 2013, 6, 1283-1290. DOI:10.1039/C3EE24324A
- ↑ J. Lu, Y. Zhou, Y. Luo, Y. Huang, X. Zhang, and X. Zhao, "Structural and electronic properties of heterofullerene C59P", Molecular Physics, 2001, 99, 1203-1207. DOI:10.1080/00268970110048879

