
Rep:Mod:fjm19882
BH3 Molecule
Small molecules
I optimized a BH3 molecule then found out the following information:
B-H bond distance= 1.194
H-B-H bond angle= 120°
File type= .log
Calculation type= FOPT
Calculation method= RB3LYP
Basis set= 3-21G
Final energy= -26.46au
Dipole moment= 0 Debye
Point group= D3H
Calculation took 1 minute 10 seconds
I then optimized a BCl3 molecule and found out the following information:
B-Cl bond distance= 1.866
Cl-B-Cl bond angle= 120°
File type= .log
Calculation type= FOPT
Calculation method= RB3LYP
Basis set= LANL2MB
Final energy= -69.44
Dipole moment= 0.0 Debye
Point group= D3H
Calculation took 33 seconds
I chose another simple molecule, CH4, and optimized it using the same method as for the BCl3. The results were as follows:
C-H bond distance= 1.097
H-C-H bond angle= 109.5°
File type= .log
Calculation type= FOPT
Calculation method= RB3LYP
Basis set= LANL2MB
Final energy= -40.04
Dipole moment= 0.0 Debye
Point group= TD
Calculation took 43 seconds
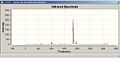
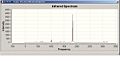
After carrying out a frequency calculation on the BH3 molecule the following vibrations were calculated. The vibrations for each peak can be seen in the picture and the frequencies and symmetry point group are summarized below.
| No. | Frequency | Intensity | Symmetry D3H point group |
| 1 | 1145.71 | 92.7 | A2’’ |
| 2 | 1204.66 | 12.4 | E |
| 3 | 1204.66 | 12.4 | E |
| 4 | 2592.79 | 0 | A’ |
| 5 | 2731.31 | 103.9 | E |
| 6 | 2731.31 | 10.4 | E |
This shows that there are 6 different vibrations. However there are only 3 peaks because the peak with 0 intensity is totally symmetric so will not produce a dipole when vibrating. Peak 2 and 3 are at the same frequency as they have the same overall dipole as do frequency 5 and 6.
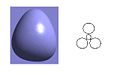
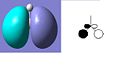
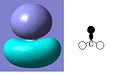
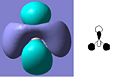
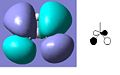
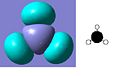
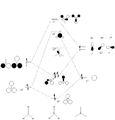
The MO diagram of BH3 is shown below. The calculated orbitals can be seen to be very similar to the predicted orbitals from the MO diagram. The only difference is in the energy of the LUMO+1 orbitals. In the MO diagram the a1' orbital is lower in energy, however when calculated on the computer the e' degenerate energies are lower in energy. This shows that drawing MO diagrams is useful and they are very accurate, however the energies may be slightly different than expected.
-
 HOMO -2
 -
 HOMO -1
 -
 HOMO
HOMO -
 LUMO
LUMO -
 LUMO +1
 -
 LUMO +2
 -
 LUMO +3
 -
 MO diagram


Transition Metal Compounds
Firstly I optimized the cis and trans Mo(CO)4(PMe3)2 isomers using firstly the B3LYP method with LANL2MB pseudo-potential. This gave a rougher optimization. I then optimised the molecules more precisely using the LANL2DZ pseudo-potential. The summaries from the two different method for both isomers are shown below, and show that the energy is lower using the LANL2DZ method than the LANL2MB method providing the optimization has worked better.
The cis and trans molecules are shown below respectively.
Pentahelicene |
Pentahelicene |
-
 Summary for cis molecule
 -
 Summary for trans molecule


From the final optimised molecules the following data could be obtained:
Trans conformer geometric parameters:
Mo-P bond length= 2.572
P-Mo-P angle =179.965°
P-Mo-C angle=88.923°
Mo-C bond length= 2.0286
Cis conformer geometric parameters:
Mo-P bond length= 2.647
Literature Mo-P= 2.577[1]
P-Mo-P angle= 90.934°
Literature P-Mo-P=104.62°
P-Mo-C= 91.360°
Literature P-Mo-C=84.4-94.0°
Mo-C bond length= 1.9820
Literature Mo-C= 1.972
Comparing the literature geometric parameters to the calculated values it can be seen that the calculated cis and trans bond length and angles are within the rough range that the bond length would be expected to be. Therefore the calculation has been successful for both of the isomers. The literature values of the cis conformer and very close to the calculated values so this shows that the LANL2DZ pseudo-potential and basis sets are accurate enough to give close bond and angle values.
Comparing the trans and cis conformers it can be seen by looking at the P-Mo-P values that both the structures adopt the an octahedral geometry and have values very close to the 180° and 90° expected. The trans conformer is closer to the expected value than the cis conformer so is probably closer to its optimized geometry.
Both the P-Mo-C angles are within the expected range with the trans isomer having a slightly lower angle than the cis isomer.
The Mo-C bond length longer for the trans isomer than cis isomer. This is because the bulky PMe3 groups will try to get as far away as possible extending the Mo-C bond length.
-
 IR of cis molecule
 -
 IR of trans molecule


Trans Isomer IR Values
| Frequency | Infrared |
| 319.178 | 32.178 |
| 427.774 | 43.5547 |
| 589.203 | 58.403 |
| 657.541 | 142.434 |
| 1017.48 | 393.441 |
| 1366.6 | 60.4626 |
| 1498.24 | 41.9496 |
| 1838.59 | 1999.65 |
| 1838.8 | 2007.49 |
| 3055.45 | 81.9336 |
| 3161.46 | 100.905 |
Cis Isomer IR Values
| Frequency | Infrared | Literature Values[2]
|
| 421.327 | 43.4295 | |
| 606.57 | 58.9613 | |
| 634.884 | 60.3663 | |
| 1017.64 | 199.042 | |
| 1367.76 | 43.1259 | |
| 1498.03 | 39.7924 | |
| 1849.71 | 1094.85 | 1897 |
| 1850.79 | 1974.6 | 1908 |
| 1870.33 | 652.8 | 1927 |
| 1960.63 | 336.954 | 2023 |
| 3057.72 | 44.4992 | |
| 3162.74 | 38.7801 |
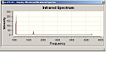
Looking at the shape of the IRs it can be seen that there are a number of smaller peaks in the 320-1500 range and 3000-3200 range. The larger peaks are in the 1830-1960 range and are due to the C=O bonds. These are the peaks that will be compared with the literature. Comparison shows that the computed values are lower than the literature values but still within the right region. In the trans isomer IR there are only 2 peaks in the C=O vibration region of the spectra rather than the 4 peaks for the cis isomer. This is because the trans isomer is more symmetric than the cis isomer leading to more peaks.
trans Mo(CO)4(PMe3)2= -773.3572 hartree
trans-Mo(CO)4(PPh3)2= -1923.0303
cis Mo(CO)4(PMe3)2= -773.3601 hartree
cis-Mo(CO)4(PPh3)2=-1923.0581
ΔE (cis-trans)= -0.002846 hartree
ΔE (cis-trans)= -0.027797hartree
ΔE (cis-trans)= -7.474 kJ/mol
ΔE (cis-trans)=-72.98kJ/mol
It can be seen from compairing the obtained values with literature values of Mo(CO)4(PPh3)2 that the energy values are not very close. This will because of the Ph3 groups being in place of the Me3 groups. As the Ph3 groups are much larger than Me3 groups the total energy of the literature molecule is much larger due to steric interaction between the larger groups. The energy difference between the cis and trans isomers of the calculated molecule is 10 times lower than the experimental value of the Mo(CO)4(PPh3)2. This may be because of the difference in L ligand, or could be due to the inaccuracy of the computational optimization values.
Ammonia
I optimised a molecule of ammonia, ammonia with one bond length of 1.01, and a high symmetry version. I used the B3LYP method and 6-31G basis set. The optimisation summaries are as follows:
-
 Ammonia Optimisation summary
 -
 Ammonia (1.01) Optimisation summary
 -
 Ammonia High symmetry Optimisation summary


· The difference that the symmetry has made to the final structure obtained is that the normal and 1.01 ammonia molecules are not planar, however the high symmetry molecule is completely planar.
· The symmetry has changed the time of optimisation by a large amount between the normal ammonia and the high symmetry ammonia. It took about a sixth of the time for the high symmetry calculation to run than the standard ammonia.
· The higher the symmetry to start with the less time the optimisation calculation took.
· The lowest energy conformation is the ammonia with one 1.01angstrum N-H bond.
· The difference between the lowest energy conformation (0.1484x10⁶kj/mol) and the highest energy conformation (0.1485x10⁶kj/mol) is roughly 100kj/mol.
· This energy difference is not significant as is only about 0.06% of the energy of the molecule so is a very small amount proportionally.
I then ran the optimisation using the MP2 optimisation method. The following results were given:
-
 Ammonia MP2 Optimisation summary
 -
 Ammonia (1.01) MP2 Optimisation summary
 -
 Ammonia High Symmetry MP2 Optimisation summary


· These MP2 calculations take over half the time that the previous calculations took. However comparing the final energies of these molecules compaired to using the previous method, it shows that the molecules are of higher energy for the MP2 method.
· The barrier height to inversion, using the values obtained from the MP2 optimisation method is: -1.48148x10⁵-(-)1.48168x105= 20kj/mol
For the B3LYP method the height to inversion is: -1.48423x10⁵ – -1.48424x105= 1kj/mol
The MP2 method gives a very close answer to the experimental value of 24.3kj/mol. However the B3LYP value is not close at all. This shows the MP2 method may give energy with higher energies than the B3LYP method, but it gives answers closer to literature values.
I then carried out frequency calculations so that the IRs of the C3V and D3H structures could be analysed.
-
 IR of C3V structure
 -
 IR of D3H structure


C3V IR
| Frequency | Infrared |
| 1060.24 | 213.201 |
| 1662.86 | 22.976 |
| 1662.86 | 22.976 |
| 3534.09 | 2.1942 |
| 3685.99 | 6.416 |
| 3685.99 | 6.416 |
C3V experimental values
| Frequency | Relative Infrared | |
| 979 | 1 | |
| 1627 | 0.262 | |
| 3401 | 0.031 | |
| 3532 | 0.124 | |
D3H IR
| Frequency | Infrared |
| -840.58 | 487.811 |
| 1587.95 | 43.6005 |
| 1587.95 | 43.6005 |
| 3676.66 | 0 |
| 3894.23 | 60.0321 |
| 3894.23 | 60.0321 |
· There are 6 positive frequencies in the C3v ammonia IR, leading two 4 peaks. There are 5 positive frequencies in the D3H ammonia IR and one negative value, leading to 4 peaks.
· The vibrational modes can be seen below. All of the vibrational modes have the same character of motion for both the C3v and D3H structures. However the difference in IR values are because of the differences in structures, as the C3v structure is completely symmetric, but the D3H is not symmetric.
· It can be seen by comparing the experimental and calculated IR values for the C3v structure that they are very close. The difference in the two values will be due to not using the most accurate optimization, there will still be optimization errors using the MP2 method.
· The value of the negative frequency of the D3H structure can be seen in the table above, as -840.58.
· Vibration 1 from both structures follows the inversion path. This is because it is the vibration that has the actual structure of both C3v and D3H in it.
Mini Project
I constructed diagrams of the staggered and eclipsed versions and then optimised them using firstly the B3LYP method with basis set 6-31G. I then used the MP2 method with basis set 6-311G(d,p). Looking at the energies given the B3LYP gave lower energies than the MP2 method, however the last exercise showed that the MP2 method gave energies closer to the literature, so this is the method that I will use.
-
 Summary for staggered ammonia-borane
 -
 Summary for eclipsed ammonia-borane


Pentahelicene |
Pentahelicene |
The MP2 method of optimisation gave a final energy of -82.95977137 hartrees for the staggered molecule. For the eclipsed ammonia-borane the final energy was -82.8947822 hartrees. This means that the staggered ammonia-borane is 107.63kJ/mol more stable than the eclipsed molecule.
The geometries of the staggered ammonia-borane can be compaired to literature values to see how accurate the optimisation method was.
N-B bond length= 1.65Å
Literature N-B= 1.58Å[3]
B-H bond length= 1.21Å
Literature B-H=1.17Å
N-H bond length= 1.02Å
Literature N-H=1.03Å
These values show that the optimisation has worked well. The literature values are very close, in the case of the N-H bond only 1 decimal place different.
I then completed an optimisation of the staggered and eclipsed versions of the ethane to compare with ammonia-borane. This gave and energy of -79.56821070 hartrees for the staggered ethane and -79.56265834 hartrees for the eclipsed. Therefore the staggered ethane is the more stable conformer by 16.24kJ/mol. This is a much lower stabilisation energy between the two conformers than in the case of ammonia-borane.
-
 Summary for staggered and eclipsed ethane

The main difference in the ammonia-borane and ethane is due to the polar nature of the ammonia-borane molecule. The reason for the polarity is due to the difference is electronegativity in the nitrogen and boron atoms. Nitrogen has a value of 3.0 and boron 2.0. Literature values show that the polarity is 5.2D [4] The bonding in the ammonia-borane molecule is different as the N-B bond is dative. The nitrogen donates two electrons to the B to form a single dative bond. In ethane both of the carbons donate one electron each to the single bond. This dative bond also means that the bond is so strong that it is more energetically favourable for hydrogen loss than dissociation of the N-B bond which makes this molecule a good hydrogen storage molecule. [5]
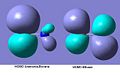
The MOs shown below can help to show the polarity of the ammonia-borane compared to the ethane. In ethane both of the HOMO orbitals around the either carbon are the same size showing that the electronegativity of the atoms is the same. The HOMO of the ammonia-borane can be seen to have much smaller orbitals around the nitrogen, this is due to it being more electronegative as the electrons are held closer to the atom. The boron orbital is much larger, as it doesn’t hold the electrons as close to being less electronegative.
-
 HOMO comparison

I completed a MP2 optimisation of the starting materials to compare the energy of them to NH4BH4. I didn’t include the Cl- and Na+ atoms in the optimisation just the NH4+ and BH4- and proved in the organic module Guassview cannot optimised with the ions included. This gave the following results:
-
 Starting materials summary

This shows that both of the starting materials are much higher in energy than ammonia-borane. NH4+ has an energy of roughly 32% more than ammonia-borane and BH4- is roughly 70% more than ammonia-borane. This shows that it is thermodynamically favourable to form the ammonia-borane. NH4BH4 is so unstable that it will almost immediately liberate H2. When trying to optimise NH4BH4 Guassian will automatically remove the H2 so the actually energy cannot be calculated computationally.
Although ammonia-borane is isoelectronic with ethane it has a much higher melting point. This can be explained due to bonds called dihydrogen bonds. Due to the high electronegativity of the nitrogen the B-H bonds are hydridic and the N-H bonds are protic. This can lead to interactions betweent the B-H hydrogens and the N-H hydrogens these interactions are known as dihydrogen bonds. This can be proved by looking at the bond distances B-H…H-N on adjacent molecules. This is shown to be roughly 2.02Å which is smaller than the Van der Waals distance of 2.4Å, proving that there must be other interactions. Literature values show that dihyrogen bonds should stabilise molecules by about 90.5kJ/mol [6], this is enough to mean that the ammonia-borane to be solid at room temperature.
This could be computationally modelled to prove the presence of dihyrogen bonds by carrying out a 3D charge density calculation. This should show the positively charge N-H hydrogens and negatively charged B-H hydrogens. It will also be seen that the hydrogens will be closer together than expected if only Van der Waal interactions we present.
References
- "Steric contributions to the solid-state structures of bis(phosphine) derivatives of molybdenum carbonyl. X-ray structural studies of cis-Mo(CO)4[PPh3-nMen]2 (n = 0, 1, 2)", F. Albert Cotton, Donald J. Darensbourg, Simonetta Klein, and Brian W. S. Kolthammer, Inorg. Chem., 21, (1982), p294-299
- Frances H. Stephens, Vincent Pons, R. Tom Baker "Ammonia–borane: the hydrogen source par excellence?" Dalton Transactions, 2007, pp. 2613-2626
- Klooster, W.T. (1999), "Study of the N-H...H-B Dihydrogen Bond Including the Crystal Structure of BH3NH3 by Neutron Diffraction", Journal of the American Chemical Society 121: pp. 6337–6343
- A Convenient Synthesis of cis-Mo(CO),L, Derivatives (L= Group 5A Ligand) and a Qualitative Study of Their
Thermal Reactivity toward Ligand Dissociation, Donald J. Darensbourg* and Robin L. Kump, 2680 Inorganic Chemistry, Vol. 17, No. 9, 1978
- ↑ "Steric contributions to the solid-state structures of bis(phosphine) derivatives of molybdenum carbonyl. X-ray structural studies of cis-Mo(CO)4[PPh3-nMen]2 (n = 0, 1, 2)", F. Albert Cotton, Donald J. Darensbourg, Simonetta Klein, and Brian W. S. Kolthammer, Inorg. Chem., 21, (1982), p294-299
- ↑ A Convenient Synthesis of cis-Mo(CO),L, Derivatives (L = Group 5A Ligand) and a Qualitative Study of Their Thermal Reactivity toward Ligand Dissociation, Donald J. Darensbourg* and Robin L. Kump, 2680 Inorganic Chemistry, Vol. 17, No. 9, 1978
- ↑ Frances H. Stephens, Vincent Pons, R. Tom Baker "Ammonia–borane: the hydrogen source par excellence?" Dalton Transactions, 2007, pp. 2613-2626
- ↑ Klooster, W.T. (1999), "Study of the N-H...H-B Dihydrogen Bond Including the Crystal Structure of BH3NH3 by Neutron Diffraction", Journal of the American Chemical Society 121: pp. 6337–6343
- ↑ Frances H. Stephens, Vincent Pons, R. Tom Baker "Ammonia–borane: the hydrogen source par excellence?" Dalton Transactions, 2007, pp. 2613-2626
- ↑ Frances H. Stephens, Vincent Pons, R. Tom Baker "Ammonia–borane: the hydrogen source par excellence?" Dalton Transactions, 2007, pp. 2613-2626