Rep:Mod:fjm1988
Module 1
The Hydrogenation of Cyclopentadiene Dimer
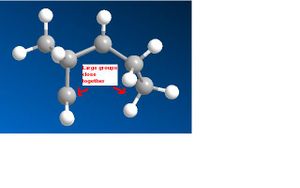
The MM2 minimisation gave the following results.
Pentahelicene |
Pentahelicene |
| Molecule 1 | Molecule 2 | |
| Torsion | 7.6846 | 9.5104 |
| Total energy | 31.8970 | 34.0198 |
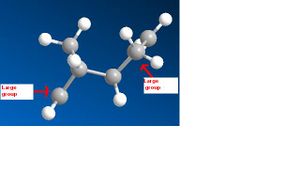
|} It could been seen that there was a significant difference in energy between the two molecules, and that the main factor contributing to the energy difference was torsion. The reasons for this can been seen in the pictures above on the right. Molecule 1 has lower torsion as the larger groups in the molecule are much further away from each other than in molecule 2 where they are close together. However this lower energy is not the most favourable. The dimerisation of cyclopentane is kinetically controlled so molecule 2 will actually form. This because of the endo product will have favourable overlap of orbitals whereas if the exo product were to form it would have unfavourable overlap of orbitals so is much less kinetically likely to happen
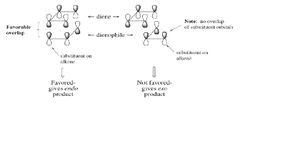
The following diagrams show the orientation of each of the two molecules. They both have
Pentahelicene |
Pentahelicene |
The two possible products of hydrogenation of the cyclopentadiene can be seen above. The minimisation values are also shown. The lowest energy of the two possible products is molecule 4 with the double bond in the 5-membered ring rather than the 6-memembered.
Stereochemistry of Nucleophilic additions to a pyridinium ring (NAD+ analogue)
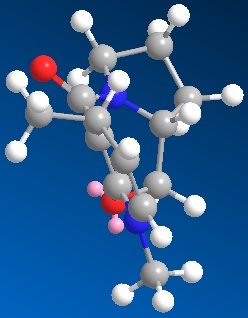
I optimised the prolinol molecule firstly with the carbonyl group as shown below.
Pentahelicene |
The minimum relative energy came out as 28.86 kcal/mol with a dihedral angle of -25.84°.
I then moved the carbonyl group to have a dihedral angle of -88.1° and reminimised the molecule.
The dihedral angle of the molecule came out as -27.5° and energy of 26.5 kcal/mol.
I then moved the carbonyl group to have a dihedral angle of 37.9° and reminised which gave a new dihedral angle of 23.8° and energy of 26.3 kcal/mol.
This shows that the lowest energy conformation of the molecule is definiately with a dihedral angle of around 24°.
The product from the reduction with MeMgI could either be kinetically or thermodynamically controlled. I drew the molecule as shown in the picture, with the Me group pointing upwards. I then minimised the energy and found it to have a relative energy of 28.86kcal/mol. I did the same with the Me group pointing downwards. This gave an energy of 28.2kcal/mol. As this two energies not significantly different it means that the reaction is not thermodynamically controlled. Therefore it must be kinetically controlled which can be proved by looking at the two different orientations.
This first picture shows that the carbonyl group and the Me group are close and on the same face. When the reaction starts the Mg+ will chelate to the O, and due to the proximity the Me group will attack on the same face that the carbonyl group is on. The other picture shows what it would look like if the Me group attached to the other side of the molecule. This would lead to the O being much further away so wouldn’t be able to chelate with the Mg+.
Therefore these simple modules in chemdraw could be improved by making it possible to include the MeMgI as chelation could be taken into account.
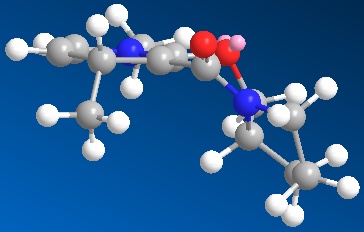
The second starting material is shown below:
Pentahelicene |
The same technique was of moving the O to above and below the ring was used on this molecule to work out the optimal position. It was worked out to be optimal to be at an angle of 43.2° from the ring.
To work out if the reaction was kinetically or thermodynamically controlled I worked out the difference in energy when the -NHPh group was above the ring as show in the lab script, or below the ring.
The energies were: Above the ring: 33.9kcal/mol Below the ring: 37.3kcal/mol
As there is a significant difference in energies between the two possible product it shows that the reaction is could be kinetically controlled with the -NHPh below the ring being the most favourable product. However it can also be seen that the -NHPh group attaches to the opposite side that the =O is on. This is because the -NHPh is a large group so will want to attack the least hindered side. This means that the reaction could also be thermodynamically controlled. The energy of the transition states will need to be looked at to find out how this reaction is controlled. This is another fault in the program as transition state energies cannot be calculated.
Stereochemistry and Reactivity of an Intermediate in the Synthesis of Taxol
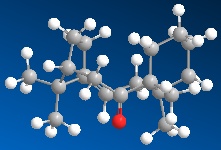

| Intermediate 10 | Intermediate 11 | |
| Stretch | 2.2483 | 7.2426 |
| Bend | 10.0033 | 77.9954 |
| Stretch-bend | 0.2872 | 0.5496 |
| Torsion | 21.3893 | 20.2401 |
| Non-1,4 VDW | -1.2533 | 1.7795 |
| 1,4 VDW | 12.5489 | 24.5335 |
| Dipole/Dipole | 0.1833 | -0.1031 |
| Total Energy | 46.4070kcal/mol | 132.2375kcal/mol
|
This shows that the first of the two intermediates is the most thermodynamically favourable as the energy is a huge amount lower. The main contribution to the difference in energy is the bend factor. The bend factor of the minimisation is the difference each of the bonds bends from the average
The reason that the alkene on this molecule is very slow to hydrogenate is because of the size of the ring. The double bond stablises this ring and helps to keep in the right formation. However if the double bond was now a single bond the ring will lose a huge amount of stability, so is not favourable to do this.
How one might induce room temperature hydrolysis of a peptide
The reactants are shown below in the following order; reactant 1 with axial N-group, reactant 1 with equatorial N-group, reactant 2 with equatorial N-group and reactant 2 with axial N-group.
Pentahelicene |
Pentahelicene |
Pentahelicene |
Pentahelicene |
When the energy was minimised for each of the molecule the following results were given:
| Reactant 1 ax | Reactant 1 eq | Reactant 2 eq | Reactant 2 ax | |
| Stretch | 1.6157 | 1.6380 | 1.4078 | 1.6745 |
| Bend | 7.6344 | 4.4070 | 4.2709 | 5.3708 |
| Stretch-bend | 0.6541 | 0.5975 | 0.5076 | 0.6054 |
| Torsion | 11.9655 | 8.5845 | 12.9660 | 8.9402 |
| Non-1,4 VDW | -4.2493 | -2.9084 | -5.9733 | -5.3240 |
| 1,4 VDW | 10.2616 | 9.2608 | 11.0091 | 9.6229 |
| Dipole/Dipole | -3.5492 | -2.1228 | -3.7744 | -6.8702 |
| Total Energy
Kcal/mol |
24.3328 | 19.4566 | 20.4138 | 14.0196 |
This shows that the thermally more stable form of reactant 1 is when the N-group is equatorial and for reactant 2 is when the N-group is axial.
The starting point for the hydrolysis of the O=C...NH2 bond is shown in the picture below.
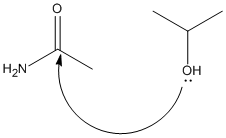
For this reaction to take place the C=O and the -OH groups must be orientated close to each other. The reason for the equatorial version of reactant 1 being the favourable version is because the -OH is orientated close to the C=O so can easily attack to form the product. This is the same for reactant 2, as the axial N-group provides better orientation for attack.
The reason that both this compounds take much less than 500 years to hydrolysis is because they are cyclic molecules. This means that the O=C and NH2 bonds are close together and doesn’t have to wait for other molecules to collide for the reaction to take place. Therefore the functional groups will be much closer so will take a lot less time to react than non cyclic molecules.
Regioselective Addition of Dichlorocarbene
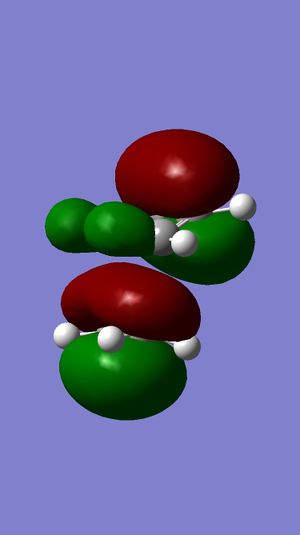

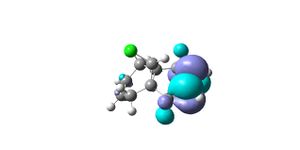


The HOMO is the MO that is most reactive towards nucleophilic attack. It can be seen in the above diagram that the orbitals of the double bond anti to the C-Cl bond are much larger therefore more likely to be reactive than the other double bond. This is why this is hydrogenated rather than the other double bond.
It can also be proved by looking at the LUMO+2 and the HOMO-1 orbitals. I can be seen in the LUMO+2 that the Cl-C σ* orbitals overlap with the exo C=C orbitals in the HOMO-1 picture. This causes stabilisation of the bond so will prevent attack on it.
This table shows the IR peaks for the dichlorocarbene.
| Frequency | Intensity | Characteristic Peak |
| 690.42 | 55.0174 | C- Cl |
| 772.634 | 25.2143 | C-Cl stretch |
| 1368.94 | 10.97 | C=C |
| 3011.78 | 103.498 | =C-H stretch |
| 3033.46 | 67.0738 | =C-H stretch |
| 3178.05 | 59.72 | =C-H stretch |
These are the IR results for the hydrogenated Chlorocarbene
| Frequency | Intensity | Characteristic Peak |
| 677.548 | 29.0385 | C-Cl |
| 775.587 | 19.8562 | C-Cl stretch |
| 3010.64 | 55.0739 | =C-H stretch |
| 3075.22 | 59.0254 | =C-H stretch |
| 3169.06 | 46.481 | =C-H stretch |
The main difference between the two IRs is the lack of the C=C peak at 1368. The non-hydrogenated version should actually have two C=C peaks and the hydrogenated version one C=C. Therefore there is a peak missing from both of the spectrum. The other differences between the two spectras are that in the second spectra there seemed to be more less intense peaks than in the 1st spectrum.
Mini Project
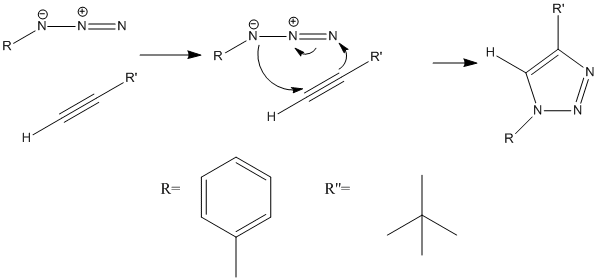
Below is the mechanism (2) for the production of the 1,4 isomer of the triazole.
This is the mechanism for the production of the 1,5 isomer.
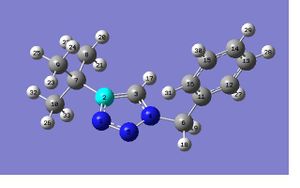
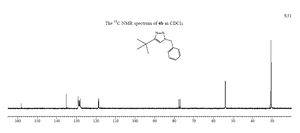
The NMR of the 1, isomer is shown below and the results are as follows:

| Carbon | Shielding (ppm) |
| 2C | 153.83 |
| 11C | 133.15 |
| 16C | 124.20 |
| 12C | 124.39 |
| 14C | 124.68 |
| 13C | 124.78 |
| 15C | 125.39 |
| 3C | 80.24 |
| 6C | 54.40 |
| 7C | 32.72 |
| 10C | 31.62 |
| 9C | 31.43 |
| 8C | 27.99 |
It can be seen that carbons 16,12,14,13 and 15 are equivalent as their shielding values are so close together. It can be seen that these are the benzene ring carbons, so this makes sense as they are all in the same environment. Carbon 11 has a slightly higher shielding value as it is attached to carbon near the nitrogen atoms (which are very electrophilic). Carbons 8, 9 and 10 are also equivalent as are all in the same environment attached to Carbon 7.
Compairing the literature NMR and the computational NMR the values are within about 5ppm of each other, but not very exact. This may be because the optimisation was not very exact. It could also be that in the reaction the lowest energy product is not formed for some reason. Therefore the NMR values would be shifted.
When optimising the geometry of the 1,5 isomer, using the mpw1pw91/6-31(d,p) method the file generated was incomplete and the optimisation was not completed in the specified 25 cycles. However looking at the graph that gives the gradient of the energy (3) of the molecule at each step of the optimisation it can be seen that at the 25th step the gradient is 0, so the energy is at a minimum. This can be seen in the diagram on the left. This means that the molecule is very near to optimisation, so this could be submitted for an NMR rather than trying to optimise the molecule again.

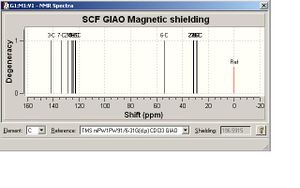
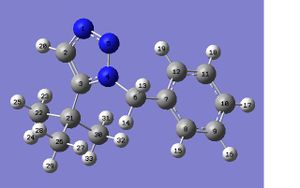
The NMR of the 1,5 isomer can be seen below, with the molecule and labelled atoms.
| Carbon | Shielding (ppm) | Literature values(4) |
| 3C | 141.49 | 146.00 |
| 7C | 133.87 | 136.37 |
| 2C | 128.42 | 131.37 |
| 11C | 125.56 | 131.26 |
| 9C | 124.98 | 128.61 |
| 10C | 124.15 | 127.68 |
| 8C | 123.08 | 126.32 |
| 12C | 122.75 | |
| 6C | 54.03 | 52.60 |
| 21C | 31.69 | 29.99 |
| 22C | 31.20 | |
| 30C | 29.39 | |
| 26C | 28.76 | 29.72 |
It can be seen in this NMR that carbons 8,9,10,11 and 12 are equivalent as their shielding values are so close together. It can be seen that these are the benzene ring carbons, so this makes sense as they are all in the same environment. Carbon 7 has a slightly higher shielding value as it is attached to carbon near the nitrogen atoms. Carbons 22, 26 and 30 are also equivalent as are all in the same environment attached to Carbon 21.
Compairing the obtained values with the literature values shows that the optimisation was relatively successful. The largest difference between the computational value was with carbon 3 which had a value of around 4.5ppm lower than the literature. This differences may be due to the calculation not running to completion.
The NMRs for the two different isomers are very similar. The main difference is the lack of the peak around 80ppm in the NMR of the second isomer. This is because in the second molecule Carbon 2 (in the 4 position) is not attached to a nitrogen with a phenyl group so therefore its chemical shift its lower than if it were attached to a nitrogen without a phenyl group. In the NMR for the 1st molecule the carbon with only a hydrogen attached, Carbon 3, has a chemical shift of much higher at around 128.42.
References
(1) [http://www.enc.edu/~timothy.t.wooster/courses/CH322/Lab/3-21%20The%20Diels%20Alder%20reaction.pdf
(2) http://www.chemistry.msu.edu/courses/CEM958/FS04_SS05%5Cmolengraft.pdf
(3) http://www.ch.ic.ac.uk/hunt/teaching_comp_lab_year3_3understand_opt_html
NMRs http://hdl.handle.net/10042/to-1020
(4) J. Am. Chem. Soc. 2005, 127, 15998; DOI:10.1021/ja054114s ).

