Rep:Mod:fiw170330365 1st
NH3 Optimisation
Optimised Ammonia Molecule |
Key Information
| Calculation Type | FREQ |
| Calculation Method | RB3LYP |
| Basis Set | 6-31G(d.p) |
| Final Energy E(RB3LYP) in au | -56.55776873 |
| RMS Gradient | 0.00000485 |
| Point Group | C3V |
| Optimised N-H Bond Length/ Å | 1.01798 |
| Optimised H-N-H Bond Angle/° | 105.741 |
The RMS Gradient is <0.0005 which indicates that the molecule has been optimised correctly, as for a minimum to be found the gradient must be zero or at least very close to zero.
The optimised bond length and bond angle agree well with the literature values. Literature[1] states the N-H bond length to be 1.019Å and the H-N-H bond angle to be 109.1°. These are similar to the optimised angles indicating an accurate optimisation.
Output Item Table
Item               Value     Threshold  Converged?
 Maximum Force            0.000004     0.000450     YES
 RMS     Force            0.000004     0.000300     YES
 Maximum Displacement     0.000072     0.001800     YES
 RMS     Displacement     0.000035     0.001200     YES
 Predicted change in Energy=-5.986273D-10
 Optimization completed.
    -- Stationary point found.
                           ----------------------------
                           !   Optimized Parameters   !
                           ! (Angstroms and Degrees)  !
 --------------------------                            --------------------------
 ! Name  Definition              Value          Derivative Info.                !
 --------------------------------------------------------------------------------
 ! R1    R(1,2)                  1.018          -DE/DX =    0.0                 !
 ! R2    R(1,3)                  1.018          -DE/DX =    0.0                 !
 ! R3    R(1,4)                  1.018          -DE/DX =    0.0                 !
 ! A1    A(2,1,3)              105.7412         -DE/DX =    0.0                 !
 ! A2    A(2,1,4)              105.7412         -DE/DX =    0.0                 !
 ! A3    A(3,1,4)              105.7412         -DE/DX =    0.0                 !
 ! D1    D(2,1,4,3)           -111.8571         -DE/DX =    0.0                 !
 --------------------------------------------------------------------------------
The optimisation file for NH3 is linked to here
Frequency and Vibrational Analysis
As can be seen from the above table, all frequencies are positive. This means that the optimisation has found a minimum and therefore a stable state of NH3.
Questions
How many modes do you expect from the 3N-6 rule?
NH3 has 4 atoms therefore using the 3N-6 rule for non-linear molecules one aan expect 6 vibrational modes.
Which modes are degenerate (ie have the same energy)?:
Modes 2 and 3, which are bending modes, are degenerate. Modes 5 and 6, which are stretching modes, are degenerate.
Which modes are "bending" vibrations and which are "bond stretch" vibrations?:
Bending modes= 1,2,3 Stretching= 4,5 and 6
Which mode is highly symmetric?
Mode 4 is highly symmetric.
One mode is known as the "umbrella" mode, which one is this?
Mode 1
How many bands would you expect to see in an experimental spectrum of gaseous ammonia?:
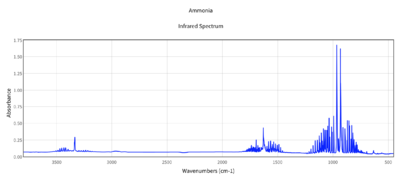
There are 6 vibrational modes however there are two sets of degenerate modes which absorb at the same frequency and would therefore give the same peaks. Therefore, theoretically one could see 4 bands. However the intensity of modes 4,5 and 6 are so low that you wouldn't expect to observe them. Modes 2 and 3 vibrate at the same frequency therefore would give the same peak. Therefore one would expect to actually observe two main peaks. One due to the bending vibrational mode 1 and one due to the bending modes 2 and 3. The theoretical optimisation agrees with the experimental literature spectrum (shown right) which has two main peaks. One peak is at roughly 1000cm-1 corresponding well to Mode 1 in the theoretical calculations and one is at roughly 1700cm-1 corresponding well to Mode 2 and 3 (degenerate). As expected 4,5 and 6 are not observed as main peaks as their intensities are too low. (although small peak at roughly 3200cm-1 could be due to stretching mode 4)
Charge Analysis
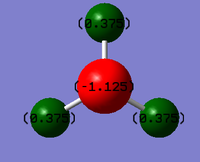
Charge on N= -1.125
Charge on H= +0.375
These charges are in line with expectation. The electronegativity of N is 3.04 whereas the electronegativity of H is 2.20[3]. (Pauling Scale). As N is more electronegative than H it attracts more electron density towards it meaning that the charge distribution is more on the Nitrogen. H has its electron density drawn away from it and so has a slight positive charge. Overall, the molecule is neutral.
N2 and H2 Optimisation
Nitrogen (N2)
Optimised Nitrogen Molecule |
Key Information
| Calculation Type | FREQ |
| Calculation Method | RB3LYP |
| Basis Set | 6-31G(d,p) |
| Final Energy E(RB3LYP) in au | -109.52412867 |
| RMS Gradient | 0.000008380 |
| Point Group | D*H (i.e. D infinityH) |
| Optimised N-N Bond Length/ Å | 1.10555 |
| Optimised Molecule Shape/° | Linear |
RMS Gradient < 0.0005 therefore indicates that optimisation has been successful in converging to energy minima.
Literature [3] N-N Bond length = 1.0976Å . Therefore the optimised N-N bond length agrees well with the literature indicating an accurate optimisation.
Output Item Table
Item               Value     Threshold  Converged?
 Maximum Force            0.000145     0.000450     YES
 RMS     Force            0.000145     0.000300     YES
 Maximum Displacement     0.000045     0.001800     YES
 RMS     Displacement     0.000064     0.001200     YES
 Predicted change in Energy=-6.585141D-09
 Optimization completed.
    -- Stationary point found.
                           ----------------------------
                           !   Optimized Parameters   !
                           ! (Angstroms and Degrees)  !
 --------------------------                            --------------------------
 ! Name  Definition              Value          Derivative Info.                !
 --------------------------------------------------------------------------------
 ! R1    R(1,2)                  1.1055         -DE/DX =   -0.0001              !
The optimisation file is linked to here
Frequency and Vibrational Analysis
For a linear molecule 3N-5 vibrational modes are expected therefore one mode is expected. The results are inline with expectation as one mode of vibration is found with a frequency 2456.91 cm-1. There is no change in dipole with this stretch therefore N2 is IR inactive and no peaks would be seen in the spectrum.
Charge Analysis
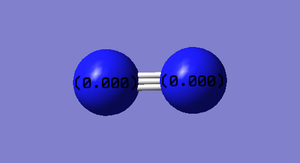
Both N atoms have the same electronegativity of 3.04 (Pauling Scale)[3]. Therefore no difference in electronegativity, therefore, no dipole and electron density evenly shared. Therefore, no partial charges on either of the atoms and overall the molecule is electrically neutral.
Hydrogen (H2)
Optimised Hydrogen molecule |
Key Information
| Calculation Type | FREQ |
| Calculation Method | RB3LYP |
| Basis Set | 6-31G(d.p) |
| Final Energy E(RB3LYP) /a.u. | -1.1785335 |
| RMS Gradient/a.u. | 0.00003809 |
| Point Group | D*H (D infinity H) |
| Optimized H-H Bond Length/ Å | 0.74289 |
| Optimised Molecule Shape | Linear |
RMS Gradient close to zero indicating optimisation was successful.
H-H bond length agrees well with the literature value[3]of 0.74138 Å indicating accurate optimization.
Output Item Table
Item               Value     Threshold  Converged?
 Maximum Force            0.000066     0.000450     YES
 RMS     Force            0.000066     0.000300     YES
 Maximum Displacement     0.000087     0.001800     YES
 RMS     Displacement     0.000123     0.001200     YES
 Predicted change in Energy=-5.726834D-09
 Optimization completed.
    -- Stationary point found.
                           ----------------------------
                           !   Optimized Parameters   !
                           ! (Angstroms and Degrees)  !
 --------------------------                            --------------------------
 ! Name  Definition              Value          Derivative Info.                !
 --------------------------------------------------------------------------------
 ! R1    R(1,2)                  0.7429         -DE/DX =   -0.0001              !
 --------------------------------------------------------------------------------
The optimisation file is linked to here
Frequency and Vibrational Analysis
3N-5 rule for linear molecules means that one vibrational mode is expected. The results agree with this as one vibrational mode is found at a frequency of 4464cm-1. There would be no peaks observed in an IR spectrum as there is no change in dipole moment and so H2 is IR inactive.
Charge Analysis
Both H atoms have the same electronegativity of 2.20[3] (Pauling Scale). No difference in electronegativity. Therefore no dipole and electron density evenly shared. Therefore no partial charges on either of the atoms and molecule is electrically neutral.
Haber-Bosch Analysis
Reaction Equation
N2 (g) + 3H2 (g) ---> 2NH3 (g)
Reaction Energies
| Energy Parameter | Energy value (in a.u.) |
|---|---|
| E(NH3) | -56.55776873 |
| 2*E(NH3) | -113.11553746 |
| E(N2) | -109.52412867 |
| E(H2) | -1.17853935 |
| E(H2) | -1.17853935 |
| ΔE=2*E(NH3)-[E(N2)+3*E(H2)] | -0.055790739999992 |
ΔE in kJ/mol = -146.48
Calculated energy for the conversion from N2 and H2 to NH3 is ΔE= -146.48 kJ/mol The theoretical molecule energies indicate that one mole of N2 is more stable than one mole of NH3 as it has a more negative energy. However, the reaction is exothermic (negative ΔE) which indicates that the products are lower in energy and therefore more stable. This is confirmed by the experimental literature[4] ΔE= -91.4kJ/mol. The calculated and experimental ΔE are quite different indicating that there may be some error in the calculations but both literature and experimental show that the reaction is exothermic. Therefore the ammonia is more stable than the gaseous reactants.
H2O Optimisation
Optimised Water Molecule |
Key Information
| Calculation Type | FREQ |
| Calculation Method | RB3LYP |
| Basis Set | 6-31G(d.p) |
| Final Energy E(RB3LYP) /a.u. | -76.41973742 |
| RMS Gradient/a.u. | 0.00000231 |
| Point Group | C2V |
| Optimized O-H Bond Length/ Å | 0.96532 |
| Optimised H-O-H Bond Angle | 103.7374 |
RMS Gradient is very small (<0.0005) therefore the molecule has been successfully optimised.
Output Item Table
Item               Value     Threshold  Converged?
 Maximum Force            0.000006     0.000450     YES
 RMS     Force            0.000004     0.000300     YES
 Maximum Displacement     0.000021     0.001800     YES
 RMS     Displacement     0.000022     0.001200     YES
 Predicted change in Energy=-1.228444D-10
 Optimization completed.
    -- Stationary point found.
                           ----------------------------
                           !   Optimized Parameters   !
                           ! (Angstroms and Degrees)  !
 --------------------------                            --------------------------
 ! Name  Definition              Value          Derivative Info.                !
 --------------------------------------------------------------------------------
 ! R1    R(1,2)                  0.9653         -DE/DX =    0.0                 !
 ! R2    R(1,3)                  0.9653         -DE/DX =    0.0                 !
 ! A1    A(2,1,3)              103.7374         -DE/DX =    0.0                 !
 --------------------------------------------------------------------------------
Force is very small, this is the derivative and so should be very close to if not zero. Therefore this indicates that the optimisation was successful.
The optimisation file is linked to here
Frequency and Vibrational analysis
Using the 3N-6 rule for non linear molecules, three vibrational modes are expected. The optimisation gives three vibrational modes. All of the vibrations cause a change in dipole moment therefore absorb in the IR spectrum however mode 2 has a very low intensity therefore probably wouldn't be seen in an experimental spectrum.
Charge Analysis
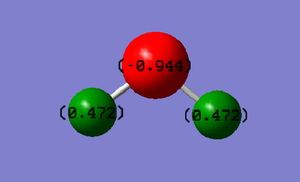
Partial Charges:
O= -0.944
H= +0.472
Oxygen has a Pauling electronegativity of 3.44 whereas H has an electronegativity of 2.20[3]. Therefore, oxygen is more electronegative than hydrogen and so draws some of its electron density away from the hydrogen and towards itself. Therefore H is left with a slight/delta positive charge and oxygen (which is drawing from two hydrogens) is left with a slightly larger delta negative charge. Though the atom have partial charges the molecule overall is neutral.
Molecular Orbital Analysis (MO)
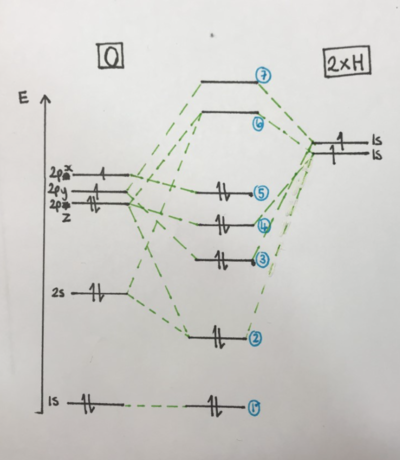
The MO level diagram (see right top) shows how the molecular orbitals are formed from mixing of the atomic orbitals. In H2O sp mixing occurs which affects the molecular orbitals. It can be seen that the 1s orbital of the oxygen are core electrons and are tightly bound and so don't mix with the other orbitals. The Molecule Axis Diagram (right middle) shows the orientations referred to in the MO level diagram and in the discussions of MO pictures. The orientations that are assigned x,y and z are arbitrary- i.e any direction can be called x y and z. It is only important to establish one way at the beginning so that the orientations can be compared to each other when analysing a molecule. The MO energy diagram (right bottom) shows that the first MO's are deeper in energy. It also shows that none of the MOs are degenerate.

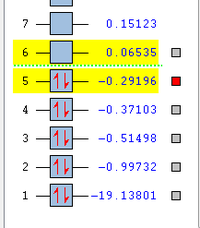
MO1 is formed from the 1s electrons on the oxygen. These are core electrons and are tightly bound. They therefore do not mix with any of the other orbitals and so are a tight sphere around the oxygen atom as shown here. This is a non bonding molecular orbital and is the level labelled '1' in the MO level diagram.
This MO is the result of the 2s orbital on the oxygen overlapping with the 1s orbital on one of the Hydrogens. The 2pz orbital also partially mixes affecting the energy of the MO as can be seen from the MO level diagram. As it is two s orbitals mixing, the MO is a large, almost spherical orbital which encompasses the whole molecule as can be see above. This MO is a bonding, sigma, gerade orbital. This orbital is the level labelled '2' in the MO level diagram.
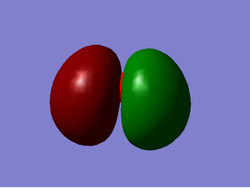
MO3 (labelled '3' in the MO level diagram) is formed from mixing between the 2pz orbital of the oxygen with the 1s orbital of one of the hydrogens. This is a sigma ungerade bonding orbital along the z axis (see axis diagram for reference). The overlap of the s orbital on the p orbital means that one side of the p orbital is in phase with the s orbital and one side is out of phase. This means that one lobe gets larger and one gets smaller giving an uneven MO. The MO in this picture is rotated so that the asymmetry is not seen very well. However, one lobe is bigger than the other. (this asymmetry can be seen more clearly in MO4).
MO4 (labelled '4' in MO level diagram) is similar to MO3. However, MO4 lies along the y axis rather than the z axis as the MO is due to the overlap of the 2py oxygen orbital with the 1s orbital on one of the hydrogens. MO4 is a sigma ungerade non bonding orbital and is the orbital in which one of the lone pairs of oxygen sit.
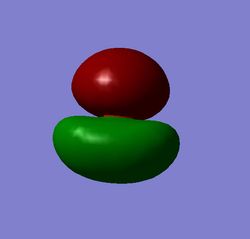
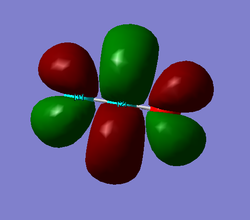
MO5 is due to the 2px atomic orbital of the oxygen. It is a non bonding orbital and is where the other lone pair on the oxygen sits. It lies in the x plane and is the HOMO of the molecule. This is the pair of electrons that are more likely to react when the water behaves as a nucleophile as they are highest in energy. Therefore, it can be useful to know the orientation of the orbital which they sit in as can be seen from above.
MO6 is the LUMO of the molecule and is from the mixing of the 2pz orbital on the oxygen with the 1s orbital on one of the hydrogens to form a ungerade anitbonding orbital. There is also some mixing/contribution from the 2s orbital on the oxygen which alters the energy level of MO4. There is also another higher MO7 which is another anti bonding orbital from the mixing of the 2py orbital of oxygen with the 1s orbitals of Hydrogen.
CO2 Optimisation
Optimised Ammonia Molecule |
Key Information
| Calculation Type | FREQ |
| Calculation Method | RB3LYP |
| Basis Set | 6-31G(d.p) |
| Final Energy E(RB3LYP) /a.u. | -188.59093943 |
| RMS Gradient/a.u. | 0.00007400 |
| Point Group | D*H (D infinity H) |
| Optimized O-H Bond Length/ Å | 1.16923 |
| Optimised Molecule Shape | Linear |
RMS Gradient is small (<0.0005) indicating that the optimisation converged and was successful. Optimised bond length is in good agreement with the literature value[5] of 1.162Å.
Output Item Table
Item               Value     Threshold  Converged?
 Maximum Force            0.000157     0.000450     YES
 RMS     Force            0.000111     0.000300     YES
 Maximum Displacement     0.000138     0.001800     YES
 RMS     Displacement     0.000097     0.001200     YES
 Predicted change in Energy=-2.163823D-08
 Optimization completed.
    -- Stationary point found.
                           ----------------------------
                           !   Optimized Parameters   !
                           ! (Angstroms and Degrees)  !
 --------------------------                            --------------------------
 ! Name  Definition              Value          Derivative Info.                !
 --------------------------------------------------------------------------------
 ! R1    R(1,2)                  1.1692         -DE/DX =   -0.0002              !
 ! R2    R(1,3)                  1.1692         -DE/DX =   -0.0002              !
 ! A1    L(2,1,3,-1,-1)        180.0            -DE/DX =    0.0                 !
 ! A2    L(2,1,3,-2,-2)        180.0            -DE/DX =    0.0                 !
 --------------------------------------------------------------------------------
Maximum Force is very close to zero indicating a successful optimisation.
The optimisation file is linked to here
Frequency and Vibrational analysis
Using the 3N-5 rule for linear molecule one would predict four vibrational modes. The optimisation calculation produces 4 vibrational modes. Two of the bending modes are degenerate (i.e of the same energy) and so would absorb at the same frequency and so would give the same peak in an IR spectrum. The stretching frequency of this bend is calculated to be 640.24 cm-1. This is similar to the literature value[3] of 667cm-1. The other two modes are due to stretching vibrations and are also similar to the literature values[3] of 1388cm-1 for mode 3 and 2349cm-1 for mode 4. Mode 3 corresponds to the symmetric stretch of CO2 which results in no change in dipole moment therefore it is not IR active and so has an intensity of 0. Mode 4 corresponds to the asymmetric stretch which does result in a change in dipole moment and so absorbs IR. Therefore overall one would expect to see 2 peaks in an IR spectrum. One at roughly 640 cm-1 due to the degenerate bending modes and one at roughly 2349cm-1 due to the asymmetric stretching mode.
Charge Analysis
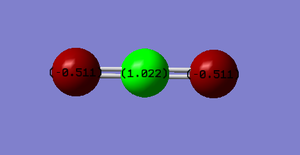
Partial Charges:
C= +1.022
O= - 0.511
(2x O therefore overall +1.022-1.022, molecule is neutral)
Carbon has an electronegativity of 2.55 and oxygen has an electronegativity of 3.44[3]. Therefore oxygen is more electronegative than carbon and so will draw electron density away from the carbon giving it a slight positive charge and onto itself giving itself a slight negative charge. These are only partial charges though as overall the molecule is neutral.
Molecular Orbital Analysis (MO)
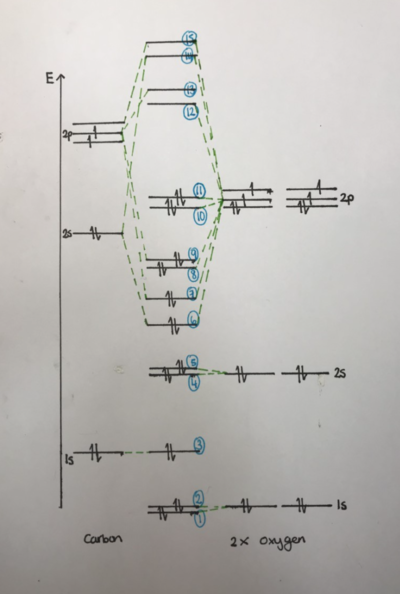
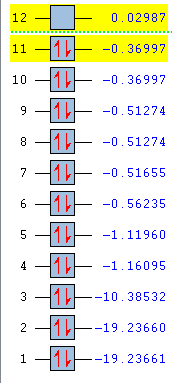
The MO level diagram (top right) shows the molecular orbitals and their relative energies for a molecule of CO2. The oxygen atomic orbitals shown to the left are lower/deeper in energy as oxygen is a more electronegative atom. The 1s orbitals for both the carbon and oxygen are shown. The diagram is not to scale as these orbitals are very deep in energy and are considered core electrons. They are not involved in bonding. The higher MOs are formed when s and p atomic orbitals overlap.
MO1 and MO2
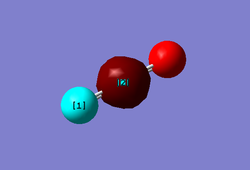
MO1 and MO2 are degenerate as can be seen from the MO energies diagram (right bottom). These MOs are due to the 1s orbitals of the two oxygen atoms. They are very deep in energy and are 'core' electrons and so are held tightly around each oxygen atom as can be seen. These are non bonding orbitals. MO1 is sigma gerade, MO2 is sigma ungerade.
MO3
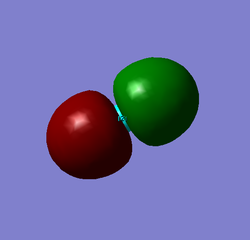
MO3 is the nonbonding orbital that corresponds to the 1s orbital on the carbon. Like the oxygen atoms, these electrons are also held very tightly and close to the atom and are considered core electrons. Therefore the orbital is very close and small around the central carbon as can be seen from the image.
MO4 and MO5
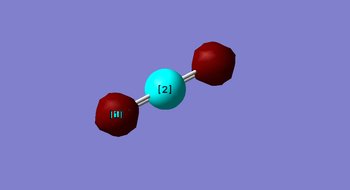
MO4 and MO5 (labelled '4' and '5' respectively on MO level diagram) represent the non bonding orbitals of the 2s orbitals on the two oxygens. As oxygen is more electronegative than carbon, the orbitals like deeper in energy than their respective orbitals in carbon. Therefore the 2s orbitals lie low enough not to be involved in the sp mixing/bonding and are non bonding orbitals. MO4 corresponds to the MO that forms when the two oxygens are in phase with each other and MO5 corresponds to when the two oxygens are out of phase with each other. The two orbitals are very similar in energy as can be see from the molecular energy diagram however they are not degenerate. The MO were the oxygens are out of phase is slightly higher in energy due to the phase difference. The 2s orbitals are bigger and are not as 'core'/tightly held as the 1s electrons and so the MOs diffuse across the whole molecule as can be seen from the above pictures. MO4 would be labelled gerade due to its symmetry and MO5 would be labelled ungerade.
MO6

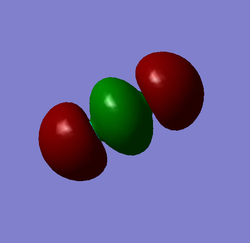
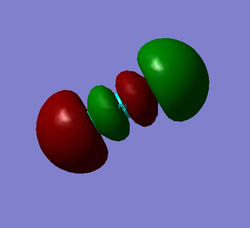
MO6 forms from the overlap of the 2s orbital of the carbon with one 2p orbital from each oxygen. (see diagram to the right). This is a sigma gerade orbital and is one of the bonding orbitals for the molecule. The bonding is sigma due to the head on overlap of the molecules and it is classified as gerade due to the symmetry about the centre of the molecule.
MO7

MO7 forms from the head on overlap of one of the 2p orbitals of the carbon with one of the 2p orbitals from each of the oxygen. (see diagram to the right) The overlap is head on therefore a sigma bond is formed. The phase is symmetrical about the centre of the molecule therefore is classified as ungerade. This MO is one of the bonding orbitals of the molecule. As this is a sigma bond the overlap has to be head on and therefore only the p orbitals along the plane of the molecule (2py) can form this MO. The other two p orbitals will form other kinds of MOs (see below).
MO8 and MO9
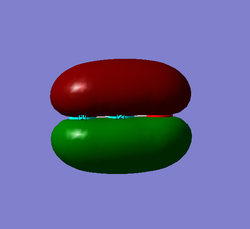
MO8 and MO9 are degenerate meaning that they are of the same energy (MO energy diagram). This is because they are the same MO just in different orientations. These MOs result from the side on overlap of the two left over 2p orbitals (that are not along the plane of the molecule). Therefore the bonding is pi bonding. Both are the same just one with the 2px orbitals overlapping and one with the 2pz orbitals overlapping. Both are classified as gerade. These two are the final two bonding orbitals and form the double bonds between the C and O atoms.
MO10 and MO11
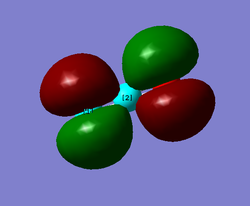
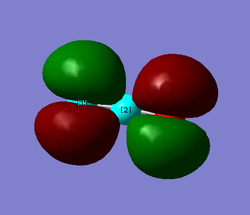
MO10 and MO11 are also degenerate. They are both non bonding orbitals and result from the 2p orbitals on the oxygens. MO11 is the HOMO of the molecule and therefore the orientation of it is important when considering the reactivity of the molecule. This is where the lone pairs on the oxygens would sit. Both MOs are gerade due to the symmetry around the centre of the molecule.
MO12
MO12 is an antibonding orbital and is the LUMO for the molecule. It is ungerade in symmetry.
References
- ↑ Freund H.J. () 2.3.8 Ammonia (NH{3}). In: Goldmann A., Koch EE. (eds) Subvolume A. Landolt-Börnstein - Group III Condensed Matter (Numerical Data and Functional Relationships in Science and Technology), vol 23a. Springer, Berlin, Heidelberg.
- ↑ Ammonia [Internet]. NIST Chemistry Webbook. 2018 [cited 8 March 2018]. Available from: http://webbook.nist.gov/cgi/cbook.cgi?ID=C7664417&Type=IR-SPEC&Index=1
- ↑ 3.0 3.1 3.2 3.3 3.4 3.5 3.6 3.7 3.8 Atkins, P. and De Paula, J. (2014). Atkins' Physical Chemistry. 10th ed. Oxford: University Press, pp.515,985,986.
- ↑ Haber Process for Ammonia Synthesis [Internet]. Ias.ac.in. 2018 [cited 9 March 2018]. Available from: http://www.ias.ac.in/article/fulltext/reso/007/09/0069-0077.
- ↑ Glockler, G. (1958). Carbon–Oxygen Bond Energies and Bond Distances. The Journal of Physical Chemistry, [online] 62(9), pp.1049-1054. Available at: https://pubs.acs.org/doi/pdf/10.1021/j150567a006 [Accessed 7 Mar. 2018].


