Rep:Mod:filmubs278m2
Investigating BH3
Optimization-
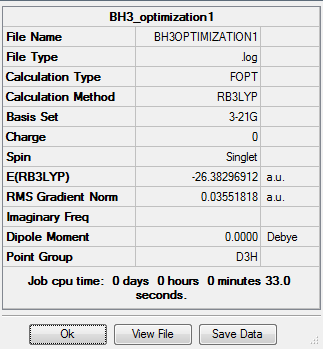
This molecule was modelled with the help of GaussView. The geometry was optimized using B3LYP as the method and 3-21G as the basis set.
Log file- https://www.ch.imperial.ac.uk/wiki/images/5/55/BH3_opt_.log
In order to find the minimum energy, the program resorts to solving the Schrodinger’s equation a few times considering different positions for the nucleus. As the minimum energy of the molecule reflects its most stable state/coordinates of the nuclei, Gaussian solves the Schrodinger’s equation altering the distance between the nuclei each time to see which ‘direction’ of change would give the lowest energy (ie greater distance/shorter distance between the nuclei).
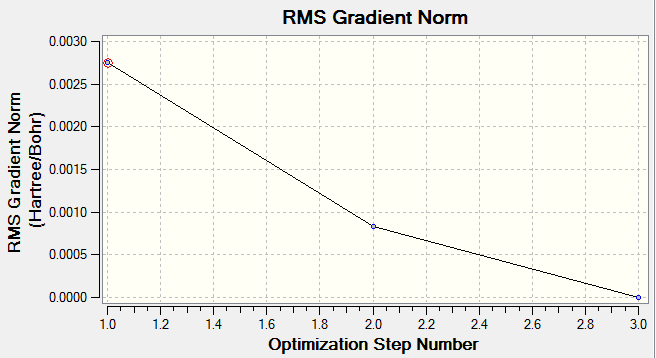
The graphs above show the number of steps in took to get to the minimum energy. When considering a potential energy surface graph, the most stable state is the minima of the curve (ie where the gradient is zero). The second graph illustrates this; it shows the number of optimization steps it took to get the gradient very close to zero. The first graph shows the number the number of steps it took to get to the minimum energy.
From the table above, we can see that the minimum energy after optimization was around -26.46 au and the energy approximately 0.00003 a.u indicating that the optimization was completed. The table also that there’s no dipole moment, and we know that this is true as all the dipoles cancel each other out in BH3. We also see from the table, that the point group of BH3 is D3H as expected.
MO-orbitals-
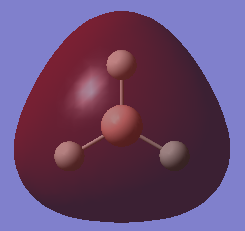
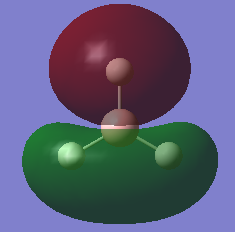
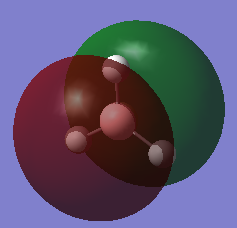
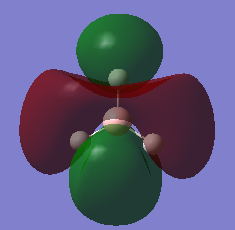
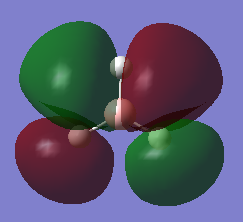
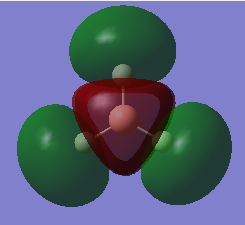
The MO of BH3 was analysed using the same parameters as before with the method set to B3LYP and basis set to 3-21g. The MO diagram + the table below illustrate the different orbitals as laid out by Gaussview. As you can see, there are no major differences between the expected and predicted orbital structures, however Gaussview had predicted that the 3a’1 orbital would be higher in energy the both 2e’1 orbitals. This could be as a result of mixing, not taken into account by the calculations.

| Model MO | LCAO sketch |
|---|---|
 |

|
 |

|
 |

|
 |

|
 |

|
 |

|
 |

|
MO-log file: DOI-[1]
NBO Analysis
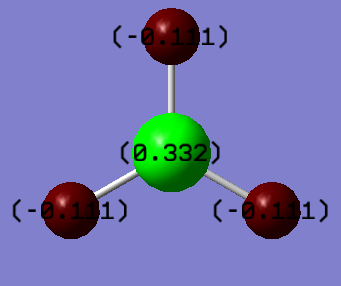
As you can see from the image below, the population analysis tells us the charge density/distribution on each atom. As expected, the boron is highly positive (very electron deficient) whilst they hydrogens are negative.
Vibrational analysis
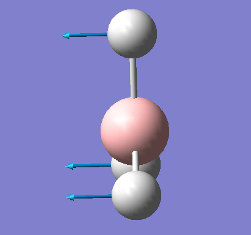
Using the same parameters as before (DFT-B3LYP/3-21g) and the optimized geometry log file of BH3, the frequency calculations were done. The purpose of this part is to ensure that we really do have the lowest energy structure. As the frequency calculations finds the second derivative of a curve, all the frequencies should be positive in order to have the lowest energy structure (the minima).
Freq. BH3 log file- https://www.ch.imperial.ac.uk/wiki/images/5/52/FreqBH3.log
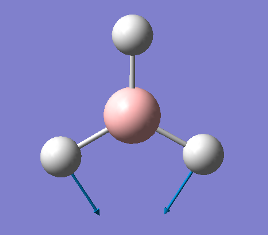
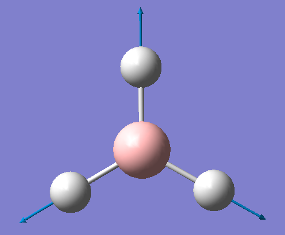
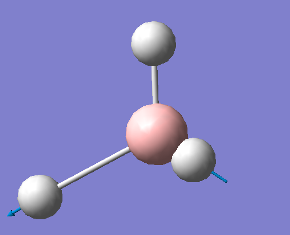
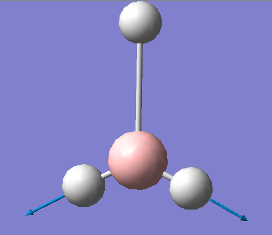
| Vibration | Frequency cm-1 |
|---|---|
 |
1144 |
 |
1204 |
 |
1204 |
 |
2598 |
 |
2737 |
 |
2737 |
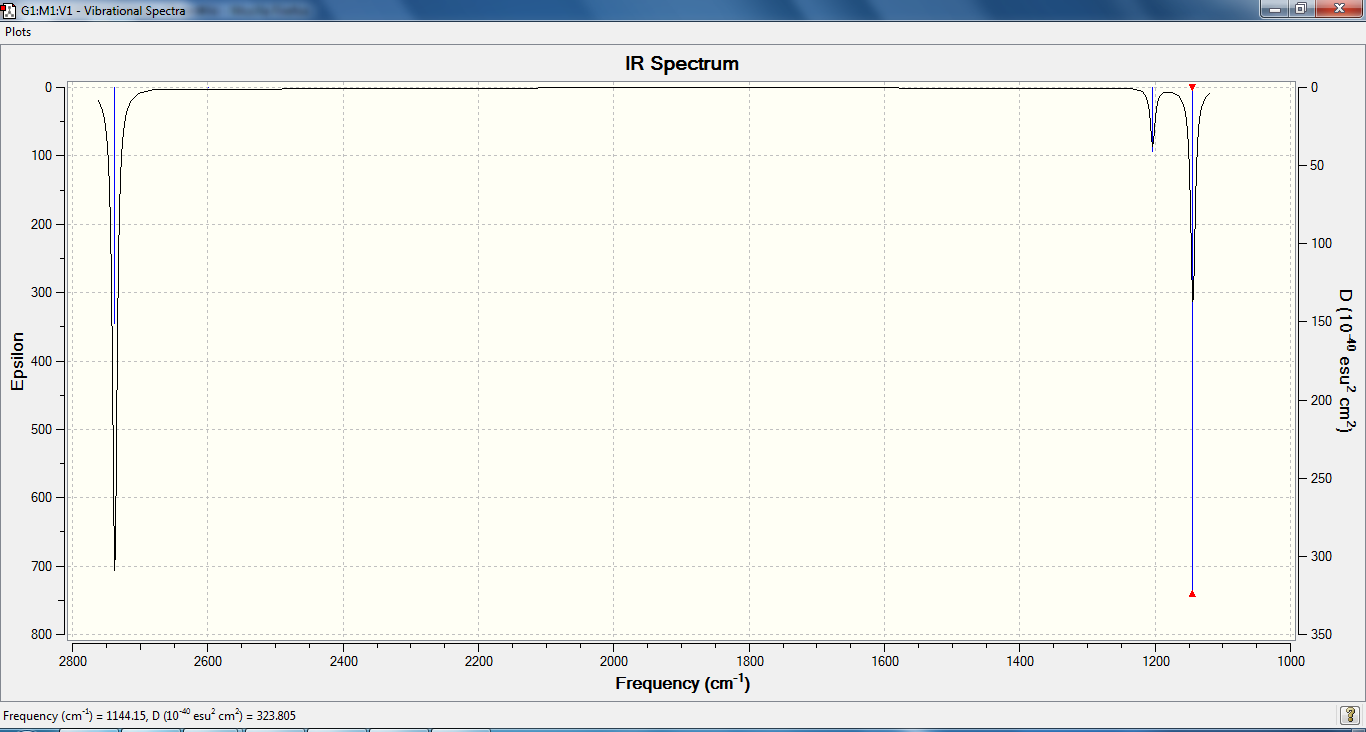
As we can see from the table and spectrum above, there are a few frequencies documented in the table that do not appear in the IR spectrum. Firstly, there are two degenerate frequencies, 1144 and 2737 cm-1 where two peaks of the same frequency give one peak with double the intensity. The third missing peak was meant to be at 2598 cm-1, but since the intensity is zero it does not appear in the spectrum. This lack of intensity is due tot eh lack in dipole moment as the motion is symmetrical.
Investigating TlBr3
Optimization-
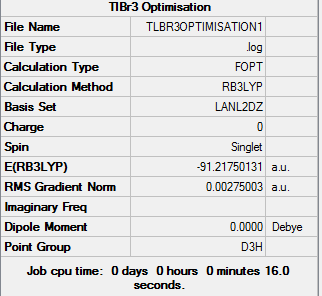
In this optimization, we used B3LYP as the method, but LANL2DZ as the basis set. We also restricted the geometry to D3h. The results were as follows:
OPT. LOG FILE: https://www.ch.imperial.ac.uk/wiki/images/c/c3/Tlbr3opt.log
As you can see, it took 3 steps for the optimization process to reach the minimum energy. The gradient is once again close to zero indicating that the calculation was successful. However, as explained previously, calculating the frequency can confirm that.
Vibrational Analysis
These calculations were once again done using the same parameters as the optimization. This is essential as using two different basis sets would result in the use of two different methods/approaches in calculations that would not be compatible with each other, and more than likely give rise to less accurate values, error messages or general anomalies in the vibrations for example.
Freq. log file: https://www.ch.imperial.ac.uk/wiki/images/0/07/Tlbr3freq1.log
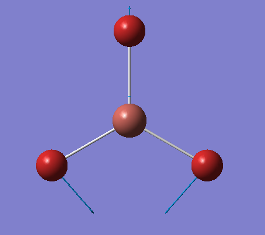
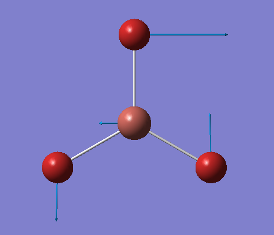
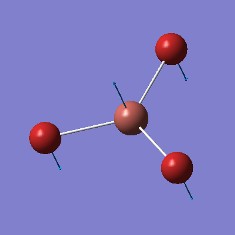
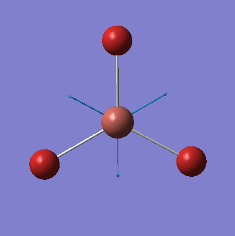
| Vibration | Frequency cm-1 |
|---|---|
 |
46.4 |
 |
46.4 |
 |
52.1 |
 |
165 |
 |
210 |
 |
210 |
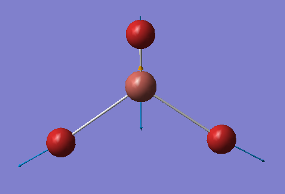
The table shows similar discrepancies as with the BH3 molecule. The two frequencies at 46 cm-1 are degenerate and only show one peak with a combined intensity. The same applies for the frequency at about 211 cm-1. The missing third frequency is once again due to the symmetric nature of the movement of the molecules resulting in no dipole moment and hence zeros intensity.
You might notice that Gaussview does not draw the bond between the atoms. This is because Gaussview has a ‘cut off’ point when it comes to bond lengths. This means that if the optimized structure has a bond length longer than the set parameters in Gaussview, it will remove the bond. However, this doesn’t mean that they are not taken into account in the calculations.
A chemical bond can be defined as electronic forces of attraction that for compounds. The VSEPR (Valence Shell Electron Pair Repulsion) theory assumes that bonds are localised interactions involving the two electrons of two atoms. The MO (molecular orbital) approach, however assumes the delocalization of electrons in molecular orbitals. Whilst neither approaches tell the complete story, by using more advanced mathematical techniques in describing the bond, both methods can be made more accurate.
Investigating Isomers of Mo(CO)4L2
Optimization
In this part, we will be optimizing the geometry of cis and trans Mo(CO)4L2 where L=PPh3 . However, since PPh3 is a bulky many-atom substituent, we have replaced the PPh3 with Chlorine atoms as they have similar electronic effects. This will drastically simplify the computational calculations.
For cis and trans Mo(CO)4L2 where L=PPh3, we have optimized the geometry twice; once using the basis set LANL2MB and the keywords ‘opt=loose’ to allow for loose convergence parameters . These where then optimised another time, using LANL2DZ as the basis set and adding the keywords ‘"int=ultrafine scf=conver=9” to increase the electronic convergence.
After the first optimization, the structures of both molecules were altered using Gaussview. The cis molecule was adjusted so that the one chlorine atom was parallel to the axial carbonyl whilst the other was parallel to the carbonyl group facing down where the two phosphorus groups would be anti-periplanar to one another. The trans molecule on the other hand was adjusted so that the two phosphorus groups were eclipsed.
Cis Opt. log file: https://www.ch.imperial.ac.uk/wiki/images/4/4e/Cisopt.log (unable to publish on D-space)
Trans Opt. log file: https://www.ch.imperial.ac.uk/wiki/images/e/e2/Transopt.log (unable to publish on D-space)
| Cis isomer | Trans isomer | |
|---|---|---|
| Energy (kJ/mol) | -623.577 | -623.576 |
| RMS Gradient Norm | 0.00005 | 0.00003 |
From the table above, you can see that the trans molecule has a slightly lower energy than the cis structure of 0.001 Hartree units=2.6 kJ/mol. This indicates that the trans molecule is the thermodynamically more stable product and hence the favoured one. However, the literature suggests that in Mo(CO)4 (PPh3)2 the cis isomer is the more stable one by about 70 kJ/mol. This can be explained by looking at the structure of the two isomers. In the cis isomer, where the two ligands are ‘anti periplanar’ to one another, it is not surprising that large ligands such as PPh3 would prefer this structure as the substituents are furthest apart in this conformation. For smaller ligands such as chlorine, the conformation does not matter as much in terms of steric clashes as can be seen from the very small difference in energy between the two isomers.
Vibrational Analysis
As always, the frequency calculations were done using the same restrictions as in the second optimization. We then looked at both log files that showed the following-
Cis-
Low frequencies --- -2.0268 0.0003 0.0004 0.0004 0.9616 1.3355
Low frequencies --- 10.7511 17.6400 42.0157
Trans-
Low frequencies --- -2.1367 -1.4710 -0.0005 -0.0003 0.0005 3.3604
Low frequencies --- 5.2174 6.2671 37.2105
As you can see, the lowest frequency is in the -2 range but as it is within our error limit (up to -5 would be considered positive), we can say that all the frequencies for both structures are positive and the lowest energy conformations.
Mini-Project- Investigating the different conformations and vibrations of Si2H4Cl2, Si2H4Br2, Si2H2Cl4 and Si2H2Br4
This project revolves investigates the different confirmations for the molecules mentioned above and how their energies and vibrations compare.
| Anti-periplanar Si2H4Cl2 | Anti-periplanar Si2H4Br2 | Anti-periplanar Si2H4Cl4 | Anti-periplanar Si2H4Br4 |
|---|---|---|---|
| Eclipsed Si2H4Cl2 | Eclipsed Si2H4Br2 | Eclipsed Si2H4Cl4 | Eclipsed Si2H4Br4 |
Firstly the optimization was done using B3LYP as the method and LANL2DZ as the basis set. The summary for each conformation is shown below.
| Molecule | Molecule 1 | Molecule 2 | Molecule 3 | Molecule 4 | Molecule 5 | Molecule 6 | Molecule 7 | Molecule 8 |
|---|---|---|---|---|---|---|---|---|
| Energy (kJ/mol) | -105315 | -95945 | -180823 | -162077 | -105302 | -95933 | -180812 | -162066 |
| RMS Gradient Norm | 0.00002 | 0.00003 | 0.00001 | 0.00001 | 0.00004 | 0.00003 | 0.00001 | 0.000009 |
| Dipole Moment | 0.0 | 0.0 | 0.0 | 0.0 | 0.0 | 0.0 | 0.0 | 0.0 |
| Point Group | CS | CS | C1 | C1 | C1 | C1 | C1 | C1 |
From the table above, we can see a few trends. Firstly, each the anti-periplanar/staggered conformation is more stable than its eclipsed counterpart (eg. mol 1 is more stable than mol.5). Also, each chloride compounds is more stable than its corresponding bromide compound (eg, molecule 1 is more stable than mol. 2).
This is expected as the staggered conformations are less crowded and do not experience as much steric clash as their eclipsed counterparts. Furthermore, chlorine is a smaller, more electronegative atom than bromine. This means that the Si-Cl bond is shorter and stronger the Si-Br bond, resulting in a more stable molecule.
We can also see that none of the staggered conformations have a dipole, whilst all the eclipsed conformations due. More often than not, the molecule with the greatest dipole moment is the least stable although this isn’t a blanket rule.
Mol 1-File:Mol1.log
Mol 2-File:Mol2.log
Mol 3-File:Mol3.log
Mol 4-File:Mol4.log
Mol 5-File:Mol5.log
Mol 6-File:Mol6.log
Mol 7-File:Mol7.log
Mol 8-File:Mol8.log
Unable to publish all the above on D-Space.
Vibrational Analysis
The frequency calculations were once again run using the same criteria as before. In the table above, all the gradients are very close to zero which indicates that the lowest energy conformations were achieved. However, to confirm this we need to look at the ‘low frequency’ section on the log report of all our molecules. As mentioned previously, all the frequencies must be positive in order to have reached the mimimum. Please note, frequencies +/-10 were considered ‘zero’ frequencies and hence positive ones.
Mol. 1
Low frequencies --- -1.0966 -0.7205 -0.0001 0.0000 0.0001 2.3748
Low frequencies --- 44.6026 77.6862 149.8726
Mol. 2
Low frequencies --- -6.9825 -1.8361 -0.8828 -0.0001 0.0000 0.0001
Low frequencies --- 34.3100 63.6296 104.2545
Mol. 3
Low frequencies --- -1.5971 -0.0001 0.0000 0.0002 1.2561 2.3915
Low frequencies --- 21.1178 61.3942 114.6829
Mol. 4
Low frequencies --- -1.5705 -1.0322 -0.4387 0.0000 0.0001 0.0002
Low frequencies --- 11.5243 40.1428 70.6558
Mol. 5
Low frequencies --- -52.8098 -0.0004 -0.0001 -0.0001 3.7593 4.0826
Low frequencies --- 4.1706 79.3350 197.3316
Mol. 6
Low frequencies --- -45.7717 -2.0804 -0.0002 0.0000 0.0015 1.6687
Low frequencies --- 2.1713 52.6069 165.3751
Mol. 7
Low frequencies --- -23.5285 -0.0005 -0.0002 0.0000 1.1565 1.1726
Low frequencies --- 2.6685 79.3467 92.9498
Mol. 8
Low frequencies --- -14.8976 -1.5838 -1.3014 -1.1028 0.0000 0.0000
Low frequencies --- 0.0000 53.4851 61.8193
It is clear to see that whilst Mol. 1-4 have all positive frequencies, Molecules 5-8 all have one negative value (less than -10 cm-1) indicating that for these molecules, the proposed structures are not the lowest energy conformations. This confirms what we already knew, that the lowest energy conformations are their staggered conformations represented here by Mol. 1-4.
That singly negative value indicates that Mol.5-8 are transition states, and this was expected as the final energy/lowest energy would be their anti-periplanar conformations.


