
Rep:Mod:f915a02f-4322-43c7-b0e1-c278a5663f7a
The hydrogenation of cyclopentadiene dimer
Dimer stereochemistry
The range of cyclopentadine dimers 1-2 in the laboratory script[1] are optimized in Gaussian[2] using a semi-empirical calculation and the AM1 forcefield, followed by a DFT B3LYP calculation with the STO-3G[3] basis set. A final optimisation is made by repeating this calculation with the 6-31Gdp[4] basis set to provide a well-optimised structure for the cyclopentadine dimer. The energy of this dimer is then calculated via the MMFF94[5] force field using Avogadro[6], which also provides details on the various components of this energy.
The rationale for this choice in basis set is that STO-3G provides a basic approximation as to an optimised form of the molecules, whereas the 6-31Gdp basis set provides a much more accurate calculation, but is much slower to calculate, hence by using the less-accurate calculation as a starting point, the computational time required is reduced.
In all cases the log file was inspected to ensure that the computation had fully converged, in case Gaussian had stopped optimising after most but not all of the set of parameters (maximum force, maximum displacement, force, displacement) had converged.
| Optimisation | Total energy | Stretching energy | Angle bending energy | Stretch bending energy | Torsional energy | Out-of-plane bending energy | Van der Waals energy | Electrostatic energy | Structure (click to view Jmol) |
|---|---|---|---|---|---|---|---|---|---|
| Unoptimised | 614.59655 | 228.51880 | 289.25905 | 38.12046 | 3.06030 | 0.56249 | 41.17159 | 13.90386 | |
| MMFF94 (see below) | 58.19071 | 3.46757 | 33.19192 | -2.08319 | -2.94979 | 0.02193 | 12.35774 | 14.18454 | |
| Semi-empirical (AM1) | 62.70312 | 6.91179 | 32.08449 | -3.02436 | -2.64849 | 0.00182 | 15.13093 | 14.24695 | |
| DFT B3LYP (STO-3G) | 60.72610 | 13.72504 | 30.47160 | -4.05790 | -2.72563 | 0.03206 | 10.50071 | 12.78022 | |
| DFT B3LYP (6-31Gdp) | 57.31751 | 6.76520 | 30.69327 | -2.84066 | -2.63646 | 0.05889 | 12.32317 | 12.95409 |
During the calculation of the AM1-based optimisation for dimer 2, Gaussian crashed with the following error:
GradGradGradGradGradGradGradGradGradGradGradGradGradGradGradGradGradGrad
Berny optimization.
Using GEDIIS/GDIIS optimizer.
Bend failed for angle 10 - 2 - 17
Tors failed for dihedral 17 - 2 - 10 - 5
Tors failed for dihedral 17 - 2 - 10 - 11
Tors failed for dihedral 17 - 2 - 10 - 19
Tors failed for dihedral 10 - 2 - 17 - 15
Tors failed for dihedral 10 - 2 - 17 - 18
FormBX had a problem.
Error termination via Lnk1e in C:\G09W\l103.exe at Mon Oct 21 16:48:02 2013.
Job cpu time: 0 days 0 hours 31 minutes 6.0 seconds.
File lengths (MBytes): RWF= 5 Int= 0 D2E= 0 Chk= 2 Scr= 1
The crash was resolved by initially optimising the molecule using Avogadro[6]'s MMFF94[5] calculation, leading to suspicion that the molecule was in such an unoptimised state that the calculation chosen was not able to optimise it. Considering the sizable difference in energy between the unoptimised and MMFF94 optimised molecules, this is likely the cause of the crash.
| Optimisation | Total energy | Stretching energy | Angle bending energy | Stretch bending energy | Torsional energy | Out-of-plane bending energy | Van der Waals energy | Electrostatic energy | Structure (click for Jmol) |
|---|---|---|---|---|---|---|---|---|---|
| Unoptimised | 1930.10752 | 711.93828 | 316.14991 | -74.91832 | 15.68700 | 4.49425 | 944.07055 | 12.68584 | |
| MMFF94 | 58.26139 | 3.48053 | 33.18103 | -2.08875 | -3.00539 | 0.02341 | 12.42840 | 14.24215 | |
| Semi-empirical (AM1) | 62.70732 | 6.91205 | 32.08480 | -3.02319 | -2.64828 | 0.00191 | 15.13140 | 14.24863 | |
| DFT B3LYP (STO-3G) | 63.73692 | 13.67796 | 31.64280 | -4.00234 | -2.76324 | 0.02448 | 11.01473 | 14.14253 | |
| DFT B3LYP (6-31Gdp) | 60.17377 | 6.70258 | 32.28113 | -2.81351 | -2.74196 | 0.05159 | 12.47692 | 14.21703 |
So as to allow for comparison, as a MMFF94 calculation is run on dimer 2, the same calculation is also run on dimer 1.
Comparison of optimisation methods
The presentation of the full set of energy values calculated allows for comparisons to be made between the various methods of optimisation. Optimisation provides a drastic reduction in the total energy of the molecule, unsurprising as the molecule was drawn without much consideration for how the atoms repel each other using ChemDraw.
Further optimisation on top of this provides little real benefit, with (in some cases) the total energy of the system actually increasing in energy. This may, however, actually be due to the previous method of optimisation not generating a particularly accurate picture of the molecule, and hence under-predicting its energy. Hence it is not possible to conclude that any one method is better or worse than the other. The STO-3G[3] basis set for B3LYP does seem to over-predict the bond stretching energy for both dimers (as all other optimisations are in close agreement), so suggesting that this optimisation is either flawed, or more likely not appropriate for the molecules in question
However, as almost all the components of the energy are in close agreement with each other (Bar some of the STO-3G[3] calculations), it does suggest that the level of optimisation taken may be excessive, and hence only a MMFF94[5] or AM1 calculation may be necessary.
Abundance of dimer
During a synthetic procedure forming such a dimer, the isomer which is predominantly formed depends on the various components of the energy. Each component of the energy indicates some deviation from ideality, and hence if an energy is excessively positive or negative, it suggests a large amount of strain in the molecule, and hence would be less likely to form.
Considering only the stretching term, there is a relatively large deviation of approx. 0.06 kcal/mol between the two isomers, with dimer 1 having a larger energy. A large energy is indicative of bonds that have been excessively stretched from natural length. In contrast, the electrostatic energy is much greater in dimer 2, possibly a reverse effect of the shortened bonds - the atoms are much closer to each other than in dimer 1, and hence the amount of repulsion between atoms increases.

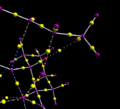
As the bonds are shorter in dimer 2, it suggests that this dimer is more stable than the other. Inspecting the arrangement of protons 1 and 2 in the diagram below (these are the protons that are of a different stereochemistry in dimer 1), it would appear that they are arranged in the optimised form to position themselves close to proton 3 on the second cyclopentene. This would result in attractive non-bonding Van der Waals interactions, leading to increased stability within the molecule. This is reflected in the increased Van der Waals term shown above.
The total energy of dimer 2 is greater than that of dimer 1, suggesting dimer 2 is the kinetic product of whatever dimerisation reaction occurred, however due to the Van der Waals interactions previously mentioned, it remains stable, and hence does not readily isomerise to the thermodynamic product (dimer 1). Hence, in a reaction to synthesis such a dimer, the 2nd isomer is formed predominantly.
Evaluation of dihydro derivatives
The 6-31Gdp optimised version of dimer 2 is converted to a dihydro derivative by removal of one of the double bonds in Gaussview 5.0. For both dihydro derivatives 3 and 4, the modified molecule is optimised using MMFF94s[7]using the steepest descent algorithm to provide a re-optimised complex.
Results
Using the same method as before, the energy has been calculated for each derivative, and reported below.
| Details | Total energy | Stretching energy | Angle bending energy | Stretch bending energy | Torsional energy | Out-of-plane bending energy | Van der Waals energy | Electrostatic energy | Structure (click for Jmol) |
|---|---|---|---|---|---|---|---|---|---|
| Derivative 3 unoptimised | 66.11969 | 10.81852 | 30.50689 | -2.92924 | 0.97799 | 0.05159 | 12.47692 | 14.21703 | |
| Derivative 3 optimised | 59.79125 | 3.29689 | 31.43404 | -1.93698 | 0.71805 | 0.02290 | 12.19839 | 14.05796 | |
| Derivative 4 unoptimised | 61.22879 | 10.39895 | 28.79350 | -2.48103 | -2.22817 | 0.05159 | 12.47692 | 14.21703 | |
| Derivative 4 optimised | 54.29811 | 3.14755 | 29.00070 | -1.84126 | -2.32317 | 0.68528 | 11.69799 | 13.93103 |
Stability
Derivative 4 is significantly lower in energy than derivative 3. This is likely because of the removal of the alkene near the bridgehead reducing the strain within the molecule, as the double bond forces the bridging group to take a small bond angle, which is not favourable considering its position in the molecule. This allows for a greater degree of stretching within the molecule, as seen by the greatly reduced stretch bending energy.
As it takes a significantly long duration of time for a tetrahydro species to form, it is likely that derivative 3 is the kinetic product, as identified by its higher energy. Over the long duration of time for full saturation, the thermodynamic product is achieved, which involves hydrogenation of the bond seen in derivative 4. Hence, it is thought that this hydrogenation process is kinetically controlled.
Conformations of a taxol intermediate
The two molecules 9 and 10 in the script[1] refer to isomers of an intermediate of the anti-cancer drug Taxol, which are formed during its synthesis[8]. The two molecules differ in terms of whether the carbonyl group points up or down.
To identify which isomer is predominate, the same calculation as has been applied to the dimer is applied. Following the knowledge learnt in the previous part that only a limited amount of optimisation is necessary, only a MMFF94s[7] optimisation is performed. A MMFF94s optimisation using Avogadro[6] is chosen over AM1, because only classical methods are used to calculate the energy, so there is little benefit to running a quantum mechanical optimisation. The settings used are a MMFF94s optimisation with the steepest descent algorithm.
Results
For both molecules, it was attempted to find other conformations for the molecule's cyclohexane ring which may be lower in energy. For molecule 9, the lowest energy conformation was the chair conformation, which had an energy of 70.56895 kcal/mol (Pk-Compound_9_chair.mol), with the only other conformation found being a twist boat at 76.28684 kcal/mol (Pk-Compound_9_twist-boat.mol). No boat conformation was found, likely as this is not an energy minimum conformation for cyclohexane in general. No other chair or twist-boat conformations were found, this is due to the ring being somewhat locked by the rest of the molecule, and therefore only allowing a degree of interconversion to occur, namely only ones where carbons at the end of the molecule move greatly. Conformations which involve the carbons at the other end of the ring do not exist as these carbons are locked in place by the rest of the ring, and hence is prevented from twisting.
A similar picture is seen for molecule 10, the chair conformation having an energy of 67.91010 kcal/mol (Pk-Compound_10_chair.mol), and the twist boat having an energy of 73.13669 kcal/mol (Pk-Compound_10_twist-boat.mol). Again, no other isomers can be seen.
The energies of the twist-boat conformers have not been reported here as they are not significant to drawing a conclusion to the most stable isomer, however the .mol files reported above can be downloaded and opened in Avogadro for calculation.
| Details | Total energy | Stretching energy | Angle bending energy | Stretch bending energy | Torsional energy | Out-of-plane bending energy | Van der Waals energy | Electrostatic energy | Structure (click to open Jmol) |
|---|---|---|---|---|---|---|---|---|---|
| Molecule 9 unoptimised | 2186.19968 | 851.70566 | 782.10989 | 69.14830 | 33.39899 | 34.81215 | 412.84627 | 2.17842 | |
| Molecule 9 chair | 70.56895 | 7.74017 | 28.40320 | -0.03589 | 0.02748 | 0.93986 | 33.18494 | 0.30920 | |
| Molecule 10 unoptimised | 2186.19966 | 851.70565 | 782.10989 | 69.14830 | 33.39899 | 34.18215 | 412.84626 | 2.17842 | |
| Molecule 10 chair | 67.91010 | 6.98114 | 25.11361 | -0.21231 | 2.33575 | 0.98027 | 33.47702 | 0.23462 |
Discussion
Analysis of stability
It is immediately clear that molecule 10 has a lower energy than molecule 9, and is hence more thermodynamically stable. Most of the contributions to the energy are similar between the two molecules, with major differences being present in the torsional energy and the angle bending energy.
To rationalise this difference, it is necessary to look at the carbonyl group, as this is the only thing which has changed (the ring may have altered slightly, however little change in the Van der Waals energy shows that it has not changed enough to cause any significant alteration in attraction or repulsion of atoms according to the Lennard-Jones potential[9]). The bond lengths and angles are compared to acetone to see if one isomer deviates from reality:
n.b. Atom *1 has been defined as the carbon to the left of the carbonyl, when the carbonyl is pointing upwards, and the cyclohexane ring is to the left of the carbonyl.
| Item | Acetone | Molecule 9 | Molecule 10 |
|---|---|---|---|
| Picture |  |
 |

|
| Bond length *1 to *2 (Å) | 1.505 | 1.540 | 1.527 |
| Bond length *2 to *3 (Å) | 1.505 | 1.539 | 1.531 |
| Bond angle (°) | 116.7 | 123.3 | 119.7 |
Taking acetone (the data for which has been computed) as an ideal example of the bond angles and lengths to be expected, it is clear that there is a large deviation from ideality for molecule 9, but this is not the case for molecule 10. Molecule 10 has some deviation, however the bond lengths are much closer to that of acetone than molecule 9's bond lengths are, and the angle in molecule 10 is much smaller than the one in molecule 9. The fact that molecule 9's bond angle is bigger is the key contributor to the larger angle bending energy seen.
This deviation from ideality is likely a result of the need for the molecule to avoid steric clashes with other ring atoms, and hence it arranges itself into a position where there there would be no clashes, even if this strains the bonds from the carbonyl to the rest of the ring. The Van der Waals and nuclear radii of an oxygen atom is much larger than that of the other atoms in this molecule, and so the presence of a carbonyl group near other protons can cause the structure to significantly change as it tries to prevent atoms becoming too close to each other.
Consideration of interactions from orbital overlap[10] have been considered, including σ(CH) to π*(CO), however these are not possible as such interactions only occur with sp³ oxygens. Interactions with CH groups and the lone pair have been considered, however as the oxygen is sp² hybridised, the only lone pair would be pointing along the same line as the double bond (but in the opposite direction), and so would be of the wrong angle to interact with any other orbitals within the molecule, as well as being too far away from other orbitals to overlap.
This could be verified via use of a QTAIM[11] calculation, or by calculating the NBOs using Gaussian[2]. QTAIM would allow inspection of the lone pairs of the carbonyl group, and would make it possible to see if they are of the orientation suggested, and whether they interact with anything, whereas calculation of the NBOs would allow for a visual inspection of orbital overlap and so to see if there are any antiperiplanar interactions which may occur.
Potential reactivity
These compounds have their double bonds located close to a bridgehead structure, leading to what is referred to in the literature as a 'hyperstable' alkene[12], as a result of a negative amount of 'olefinic strain' within the molecule - an expression of the destabilisation that is caused by the alkene existing on a bridgehead within the molecule. Examples seen previously show occasionally 90° angles within C=C-C, which is a huge deviation from the usual bond angle of 120°, and thus is usually matched with incredibly high energies for the molecule as a whole.
In contrast, a hyperstable alkene has an incredibly low strain, and is in fact less strained than the associated alkane[12]. In this instance, the energy of alkene 9 is 70.56895 kcal/mol, and the associate alkane is 81.75313 kcal/mol. The energy gained by taking the unsaturated form is huge, and is conclusive evidence of this alkene being of the 'hyperstable' kind.
Hyperstability is not a result of sterics or strengthening the π-bond. The original paper[12] suggested that this stability is enhanced by the instability of the corresponding alkane, and hence it is more kineticaly stable to remain as the alkene (and so be inert); but otherwise it was described as some form of 'special stabilisation'. From this investigation, it is possible that this alkene is stabilised by the nearby carbonyl group, and some form of overlap is stabilising the structure (possibly through some form of π interactions, not necessarily conjugation as has been reported before. However this would not explain why other bridgehead alkenes are also inert.
It is possible that there is some other form of short contacts which stabilise this specific setup (potentially between the main chain and the bridgehead), or possibly antiperiplanar interactions. Further investigation using QTAIM[11] to show whether any of the Van der Waals surfaces interact at the correct distance for short contacts to become attractive would be necessary to justify this argument. Investigation of the NBOs using Gaussian[2] would also assist in identification of antiperiplanar interactions.
It has been reported in the literature[13] that hyperstable alkenes are inert (as a result of their thermodynamic stability), and so it can be expected that the hyperstable nature of molecules 9 and 10[1] are the main cause of their inert nature.
Spectroscopic analysis using quantum mechanics
Molecule 17 shown in the laboratory script[1] is optimised using Avogadro[6] using the MMFF94s[7] force field. This molecule is further optimised using a DFT B3LYP function on Gaussian[2], which is also used to perform a prediction of the NMR spectrum. The 6-31Gdp[4] basis set is used in this calculation. After computation on the HPC, DOI:10042/25936 , the NMR spectrum is read using Gaussview[14], after specifying the nuclei to inspect, and solvent/standard to compare to.
Observations
The initial optimisation conducted using Avogadro[6] adjusted the stereochemistry of the proton marked in the original script, and the carbonyl group. These were manually adjusted and the optimisation repeated. The final optimisation yielded an energy of 118.50632 kcal/mol (MMFF94s[7] calculation), and showed a twist-boat conformation for the cyclohexane ring discussed previously. The alkene-containing ring takes a boat-like conformation, something which was not present before the stereochemistry was fixed. This is likely due to the rearrangement necessary to avoid steric clashes between the carbonyl and the nearby protons. Whilst the ring appears strained, no angles are particularly small, with the smallest angle between three carbon atoms in this ring being 113.4° - larger than the bond angles present in cyclohexane. So, whilst the ring takes this arrangement, is it not thought that this ring is strained. The structure can be viewed in Jmol by clicking this link: Pk-Compound_17_mmff94s_optimised.mol.
The additional optimisation and NMR calculation was conducted using the Gaussian 8px service on the IC SCAN service, and the results analysed using Gaussview, choosing a 1-H or 13-C nuclei as appropriate, and the TMS B3LYP/6-31G(d,p) Dichloromethane reference. The results were then exported to SVG and text formats for analysis. Methyl group protons were collected and averaged as Gaussian did not handle the equivalence of these protons - the averaged values can be found in the downloadable text files. Structure wise, there did not appear to be any significant deviation between the MMFF94s optimisation and the B3LYP one, suggesting the main requirement of this optimisation is to calculate an accurate NMR spectrum. The B3LYP structure can be viewed using this Jmol link: Molecule-17-nmr-opt.mol.
NMR Results
Comparisons for the 1H NMR and 13C NMR experiments are reported below, with an attempt made to correlate the literature values[15] to what is predicted based on the chemical shift and multiplicity. An attempt has also been made to justify whether the NMR assignment was correct or not. For a match to be classed as in agreement, the computed and experimental shifts should be within 0.15ppm of each other. For the multiplet classed as PARTIAL, the upper boundary fits within this limit, whereas the lower boundary does not. This error has been chosen taking into account a previous study[16], where it was deemed that a variance of 1.31ppm is unacceptable, whereas 0.27ppm is not - it is possible that the range chosen is too strict, however, the table of 1H NMR spectra shows that increasing this range further would not significantly alter any conclusions, whereas reducing it would. For all protons who's shifts are in close agreement, it is assumed that these are correctly assigned.
1H NMR

(please click to zoom)
| Gaussian (output) | Literature[15] | In agreement? | |||
|---|---|---|---|---|---|
| Integration (protons) | Shift (ppm), rounded to 2dp | Integration (protons) | Shift (ppm) | Multiplicity | |
| 1 | 4.88 | 1 | 4.84 | dd | YES |
| 1 | 3.31 | 4 | 3.40-3.10 | m | YES |
| 1 | 3.20 | ||||
| 1 | 3.11 | ||||
| 1 | 2.98 | ||||
| 1 | 2.96 | 1 | 2.99 | dd | YES |
| 1 | 2.96 | 14 | 2.80-1.35 | m | PARTIAL |
| 1 | 2.62 | ||||
| 1 | 2.55 | ||||
| 1 | 2.52 | ||||
| 1 | 2.46 | ||||
| 1 | 2.16 | ||||
| 1 | 2.14 | ||||
| 1 | 1.96 | ||||
| 1 | 1.92 | ||||
| 1 | 1.91 | ||||
| 1 | 1.89 | ||||
| 1 | 1.73 | ||||
| 1 | 1.61 | ||||
| 1 | 1.61 | ||||
| 3 | 1.53 | 3 | 1.38 | s | YES |
| 1 | 1.52 | 1 | 1.00 | m | NO (0.52ppm) |
| 3 | 1.20 | 3 | 1.25 | s | YES |
| 3 | 1.07 | 3 | 1.10 | s | YES |
| Total 30 H | Total 30 H | ||||

Only one proton is not in close agreement with the literature value[15], and this is the one which is computationally found at 1.52ppm (picture of this proton is found to the right marked [1]). This is quite close to the carbonyl group, and therefore it would be reasonable to expect this proton to have a shift greater than 1.00ppm. It is therefore tempting to classify this as an incorrect assignment, however there are no other protons which are also massively different to what was experimentally found, and so it would not be possible to reassign the molecule for just this proton and not affect other protons. It may instead be an error in the calculation, possibly due to the approximations made in the computational model. There may also be slight changes in conformation between what was calculated and what was reported, which would also slightly affect the shifts seen.
The error in the large 14H multiplet may again be an error in the computational model - the difference between the shifts of the last proton in the computational and experimental band is of a size similar to that of the error in the 1.52ppm proton, supporting the idea of a limitation in the model. Additionally, the maximum error between computational and literature is only 0.52ppm, which is still far below the 2ppm errors seen in previous work[16], and this too supports the idea of there not being any misassignment in the molecule. To fully conclude this is not the case, however, it is also necessary to inspect the 13C NMR spectrum.
13C NMR
Prior to analysis of the 13C NMR spectrum, it is necessary to calculate the correction needed due to the spin-orbit coupling of sulfur. Ab initio calculations of the spin-orbit coupling error of sulphur have been made by comparison of a calculated NMR shift of 21.21ppm vs a reported shift of 18.01ppm[17] for dimethyl sulphide. This gives a correction of 3.2ppm. In the event a carbon is bonded to two sulfur atoms, the correction is doubled.
Whilst this does not allow for an accurate calculation of the coupling, as this would require calculations using third-order pertubation theory[18], it does allow for a reasonable approximation which is suitable for the analysis conducted here (where it is anticipated that some error in the shift is seen). It is also of note that in a recent paper, it is seen that the computational and experimental shifts for protons near halogens are almost identical once a similar correction has been applied, so applying this technique in reverse should be reasonable.
The Jmol for the optimised dimethyl sulphide can be found here: Pk-Dms_nmr.mol, and the SVG of the computed NMR here: media:Pk-Dms-nmr.svg.

(please click to zoom)
| Computed shift (ppm) - rounded to 1dp | Experimental shift (ppm)[15] | In agreement? |
|---|---|---|
| 23.4 | 18.7 | YES |
| 24.9 | 21.0 | YES |
| 26.7 | 23.9 | YES |
| 28.7 | 25.7 | YES |
| 29.3 | 26.9 | YES |
| 32.3 | 28.3 | YES |
| 36.0 | 28.8 | NO (7.2ppm) |
| 36.1 | 32.7 | YES |
| 36.1 | 35.9 | YES |
| 36.7 | 38.8 | YES |
| 43.0 | 39.8 | YES |
| 43.2 | 45.8 | YES |
| 49.2 | 46.8 | YES |
| 51.9 | 48.5 | YES |
| 57.0 | 52.5 | YES |
| 61.9 | 56.2 | NO (5.7ppm) |
| 85.5 | 72.9 | NO (12.6ppm) |
| 128.5 | 125.3 | YES |
| 144.2 | 144.6 | YES |
| 216.1 | 218.8 | YES |
| Total 20 C | Total 20 C |

This time, following advice given in the original script[1], two carbons were deemed to be in agreement if the error in the shift is less than or equal to 5ppm. In the vast majority of cases, the difference between shifts was found to be within this range, with some larger errors. Calculation of the average difference came to 2.94ppm, which is within the accepted range, however is still quite large. It is expected that, with the inherent error in the computational calculation, the average should become 0 as the errors balance out, unless there is a misassignment in the structure. In this case, owing to the disagreeing shifts and large average deviation, it is assumed that the assignment of the NMR spectrum is incorrect.
Of note is a plot of the deviation for each shift, which shows that there is some negative deviation (as is to be expected from the error in the model), but a lot more positive deviation. The conclusion to make from this is that there is an error in the calculation, but this is small compared to the error from the misassignment. As the proton NMR calculation closely matches what was experimentally found, it is assumed here that this error originates from a conformational error, rather than a significant mistake in the structure's assignment. A potential source for the error is incorrect stereochemistry in one of the bonds. The graph can be viewed to the left. The methodology for the graph was inspired by a study previously conducted to inspect the misassignment of a structure in literature[18]. The same study could theoretically be applied to the 1H NMR data, however much of the literature report is in terms of a 14H multiplet, which prevents this variance calculation from being performed.
Catalyst crystal structure
Shi catalyst
A search is conducted for the Shi catalyst including bond lengths for the anomeric bonds using the Cambridge Crystal Structure Database[19][20] . specifying the settings:
- R Factor <= 0.05
- Not disordered
- No errors
The results are then analysed in Mercury[21], additionally for the inspection of other interesting structural features.
Results
One result was returned from the search, which accurately matches the structure for compound 21 in the script, and can be seen below. There are a number of items of interest.
Firstly, the bond lengths within the 5-membered rings are not equal. Inspecting the 5-membered ring perpendicular to the rest of the molecule, there appears to be a distinctivly longer bond close to where this ring fuses to the main 6-membered ring. The bond lengths shrink towards the centre of the molecule (where the oxygens are), and then lengthen again at the other end. This imbalance is a result of the electronegativity of the oxygens present within the molecule. To take the example of the 1.510Å bond shown in the Jmol, this C-C bond's electron density is subject to electronegative withdrawal from three oxygen groups - hence this bond is significantly weakened and the bond length increased. The 1.403Å bond, in contrast, is only subject to electron density withdrawal from one oxygen group (the other is part of the bond), so the bond is not weakened significantly. In this case, as the bond is comprised of an oxygen atom, it is shortened by this inductive effect, which draws electrons onto this bond (and thus the oxygen atom). In the case of the 1.510Å bond, even though it is not directly bonded to any oxygen atoms, it is still close enough for induction to propagate through the molecule.
Secondly, the second 5-membered ring is directly fused to the 6-membered ring, which would alter the electron density on this part of the molecule (compared to the 5-membered ring), and so explains the differing bond lengths seen on this otherwise similar ring. The effects in terms of induction described previously still apply here.

Finally, each single molecule within the unit cell has slightly different bond lengths. This is a result of the short contacts present in the crystal, indicated in cyan and red in the diagram on the right. These short contacts are between the carbonyl group, oxygens within the 6-membered ring, and the 5-membered rings. This has two effects:
- These short contacts originating from the Lennard-Jones potential[9] stabilise the molecules. The effect of this is to shorten the bonds as electron density is donated (the nature of the short contacts is to create a stabilising interaction involving the exchange of electron density as temporary dipoles are created and attraction occurs).
- As the interactions involve electronegative oxygen groups, it is also possible to withdraw electron density from the non-oxygen end of the short contact. According to the behaviour described above, this would lengthen bonds.

The net effect is some bonds are lengthened compared to the equivalent bond on another instance of the molecule, and others are shortened. This can be seen in the diagram on the right: a bond which was 1.406Å becomes 1.395Å thanks to a short contact between one of the carbons in this bond and a carbonyl group, whereas a bond which was 1.438Å becomes 1.439Å as a result of a short contact to a methyl group's proton.
Other observations: The structure takes a chair form for the six-membered ring, which is unsurprising as this is the most stable conformation of cyclohexane. However, the 5-membered rings do not take the 'envelope' structure commonly associated with cyclopentane. This is likely a result of the bonding seen to the 6-membered ring locking the conformation in place, in addition to the substituent methyl groups and heteroatoms.
Jacobsen catalyst
The Jacobsen catalyst is also inspected in the Cambridge Crystal Structure Database[19], and the bond distance between the tBu groups is also examined to check for any potential steric clashing. The same search parameters as used for the Shi catalyst were also used here.
Results
This time two structures were found, one being a newer revision of the other (02 vs 01). The newer structure was examined and a mol file exported from the database.

All the tert-butyl groups are significantly far enough away to avoid steric clashing. As part of this, the molecule appears to bend somewhat so as to bring the tert-butyls on opposing phenyl rings closer together. This was initially thought to be to increase the amount of stabilisation from short contacts, however, further investigation yielded that no short contacts exist between theses tBu groups. Instead this is the result of the nature of the coordination to the manganese centre. Short contacts do exist, primeraly from tBu groups to the manganese centre of another molecule, as shown in the picture.
The distance between the central carbon of each tBu group on a single phenyl ring is 5.087Å, which is a very large distance - much longer than an average bond length. The distance between the closest two protons on such tBu groups is 3.162Å, which is also too far away for any meaningful interaction to occur. Despite the bulky nature of these tBu groups, they do not clash due to the separation enforced by the benzene ring.
There is the potential for steric clashes between facing tBu groups on separate benzene rings. The shortest distance between the protons in this case is 2.363Å, which is an optimum distance for H-H short contacts[22]. In this case, it is possible to conclude that the bulky nature is actually stabilising as it results in protons close enough to perform a stabilising interaction. The molecule will arrange itself to set up such an interactions, which is why in some cases the tBu groups face each other (like diagram 1), and in other cases arrange themselves in a nature similar to the antiperiplanar conformation seen in other molecules (see diagram 2). This arrangement in the case of the 'facing' groups is likely aided by the short contacts which are made to the proton on the phenyl ring located between the two tBu groups (see diagram 3) - this distance is found to be 2.203Å. Attempting to maximise the stabilising interaction found here is one of the main contributions to the conformation see.
-
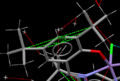 Diagram 1 - showing facing tBu groups
 -
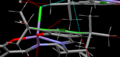 Diagram 2 - showing antiperiplanar-like arrangement of tBu groups
 -
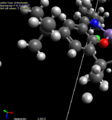 Diagram 3 - showing short contact stabilisation with proton between tBu groups


Epoxide NMR calculation
For (1S,2R)-1,2-epoxy-1,2,3,4-tetrahydronaphthalene (see right), a full optimisation and NMR calculation DOI:10042/25959 similar to what was performed on the taxol intermediate is conducted. The calculation is also modified to include the NMR coupling constants.
The method used to calculate the NMR with coupling constant is as follows: The molecule is drawn in ChemDraw and optimised using the MMFF94s[7] force field in Avogadro[6]. An optimisation and NMR calculation is conducted in Gaussian[2] using the following keywords: Opt SCRF=(CPCM,Solvent=chloroform) Freq NMR EmpiricalDispersion=GD3. Following this, a second calculation is also made to obtain the NMR coupling constants using the following keywords: scrf(cpcm,solvent=chloroform) NMR(spinspin,mixed), utilising the output from the first calculation as a starting point. This latter calculation uses the 6-311+G(d,p)[23] basis set.
The calculated 1H and 13C NMR spectra are then compared to literature[24] to investigate the accuracy of the computed spectra.
In all cases, the solvation used when obtaining NMR data is TMS B3LYP/6-31G(d,p) Chloroform, except when obtaining the coupling constants (which are not dependent on solvent or standard).
Whilst this method allows for confirmation on the epoxide's structure, it does not allow for assignment of the structure's absolute configuration (also known as chirality), which is handled later.
1H NMR
As there are no methyl groups in this molecule, it was not necessary to average any shifts to compensate for the lack of time-averaging in the calculations.

(please click to zoom)
| Gaussian (output) | Literature[24] | In agreement? | |||
|---|---|---|---|---|---|
| Integration (protons) | Shift (ppm), rounded to 2dp | Integration (protons) | Shift (ppm) | Multiplicity | |
| 1 | 7.62 | 1 | 7.45 | d | NO (0.17pm) |
| 1 | 7.37 | 2 | 7.35-7.20 | m | YES |
| 1 | 7.29 | ||||
| 1 | 3.57 | 1 | 3.90 | d | NO (-0.33ppm) |
| 1 | 3.50 | 1 | 3.77 | t | NO (-0.27ppm) |
| 1 | 2.92 | 1 | 2.85-2.80 | m | YES |
| 1 | 2.34 | 1 | 2.60-2.55 | m | NO (0.24ppm) |
| 1 | 2.25 | 1 | 2.50-2.40 | m | YES |
| 1 | 1.73 | 1 | 1.80-1.75 | m | YES |
| Total 9 H | Total 9 H | ||||

Once again, a variance in either direction of 0.15ppm was deemed an acceptable range for classifying a shift as a correct assignment. To fully conclude whether the assignment is correct, the same graph method as used previously can also be applied here. To handle the shifts reported as a range, the mid point can be taken if the integration is 1, otherwise the top and bottom of the range is taken as the two shifts where the integration is 2.
The average error in shift is -0.036ppm, and both this data and the graph does suggest that the discrepancy is a result of errors in the computational model (since the average error almost reaches zero). It is also of note that the error between computational and experimental is below 0.5ppm in all cases, which also supports the theory of an error in the calculation rather than an incorrect assignment.
13C NMR

(please click to zoom)
The 13C NMR was taken as is with no spin-spin coupling correction due to a lack of heavy atoms (oxygen is not counted as one).
| Computed shift (ppm) - rounded to 1dp | Experimental shift (ppm)[24] | In agreement? |
|---|---|---|
| 156.5 | 137.1 | No shift is within 10ppm |
| 150.5 | 132.9 | |
| 146.1 | 129.9 | |
| 143.8 | 129.8 | |
| 142.7 | 128.8 | |
| 141.3 | 126.5 | |
| 65.7 | 55.5 | |
| 63.4 | 53.2 | |
| 40.4 | 23.8 | |
| 40.1 | 22.2 | |
| Total 10 C | Total 10 C |

All carbon nuclei in this molecule appear to not be in agreement with literature[24], which would intially suggest an incorrect assignment. However it is of note that the majority of nuclei have a difference between computational and reported shifts of between 14 and 18ppm, suggesting there is some systematic error in the calculation. The two nuclei with an error of approx 10ppm are bonded directly to the oxygen group, suggesting that the assumption that there is no heavy atom correction necessary for carbons near oxygen is incorrect. The average error seen is 15.1ppm.
Owing to the similar level of variance in almost all the nuclei, and the fact that the proton NMR is in close agreement, it is concluded that the molecule is correctly assigned in literature, and there is some form of error in the approximations used as part of this calculation.
Assigning absolute configuration
Using a variety of techniques, it is possible to assign the absolute configuration of the alkene mentioned. As the necessary transition states for this analysis are not available for the previous choice of epoxide, analysis is instead performed on trans-β-methylstyrene epoxide, optimised to the DTF B3LYP 6-31G(d,p)[4] level and shown on the right. A literature value for its optical rotation is 46° at 589nm in chloroform[25], which is in very close agreement to the computed value of 46.8° (calculated at the CAM-B3LYP/6-311++g(2df,p)[23] level in chloroform), suggesting correct assignment. Other techniques include calculation of the electronic circular dichroism, the vibrational circular dichroism, and through analysis of the transition state. The first method is not applicable here as this epoxide does not have a UV-Visible spectrum, and the third secod has no prior work or literature reference to compare results to, and so calculation of would not be valuable here.
Analysis of transition state with Shi catalyst
Supplied transition states[1] can be analysed to inspect the varying free energy difference and hence what transition state is most likely to form. As part of this, it is possible to see which configuration of epoxide is formed (based on which is lower in energy), and this can be utilised to find the enantiomeric excess. As part of this latter calculation, only the lowest energy of all the transition states of each R,R and S,S series is inspected, as it is anticipated that the higher energy transition states will not form during the reaction. Free energies are obtained from inspecting
| R,R Series
LOWEST ENERGY | |
|---|---|
| DOI | Energy (Hartree) |
| DOI:10.6084/m9.figshare.738028 | -1343.022970 |
| DOI:10.6084/m9.figshare.749615 | -1343.019233 |
| DOI:10.6084/m9.figshare.738036 | -1343.029272 |
| DOI:10.6084/m9.figshare.738037 | -1343.032443 LOWEST ENERGY (open Jmol: Rr_lowest.mol) |
| S,S Series | |
| DOI | Energy (Hartree) |
| DOI:10.6084/m9.figshare.738038 | -1343.017942 |
| DOI:10.6084/m9.figshare.739115 | -1343.015603 HIGHEST ENERGY (open Jmol: Pk-ss_highest.mol) |
| DOI:10.6084/m9.figshare.739116 | -1343.023766 |
| DOI:10.6084/m9.figshare.739117 | -1343.024742 LOWEST ENERGY (open Jmol Pk-ss_lowest.mol) |
Analysis of S,S transition states

The highest energy S,S transition state (TS) is notable for having the methyl groups on the two end 5-membered rings of the catalyst pointing away from the alkene. In contrast, the lowest energy S,S transition state has these methyl groups pointing towards the alkene. The result of this change is that the carbonyl group coordinating to the alkene changes between the two transition states, suggesting the electronic properties of these two oxygen groups are different, and the coordination of one leads to a far more stable transition state than the other.
Interestingly, in the lower energy TS, the oxygen not coordinating to the alkene appears to gain slight double bond character - this behaviour is not present in the other TS. Therefore it is thought that the lower energy TS is stabilised by some form of orbital overlap which results in this double bond character and hence stabilisation of the molecule.
Additionally, there is the potential for two hydrogen bonds to form with this oxygen with double bond character, represented in the image. Whilst the angle between the three atoms is not exactly 180°, there is still the potential for some interaction to occur which may lead to an overall stabilisation within the molecule. There is no alignment of this nature in the high energy TS.
Also of note, in the high energy TS, the methyl groups mentioned previously approach endo to the phenyl ring, whereas in the low energy TS, the methyl groups approach exo. The methyl group approaching the centre of the phenyl ring is likely subject to a large degree of repulsion in terms of electron pair repulsion. The low energy TS avoids this by ensuring the methyl group avoids the ring, and hence this destabilising interaction is not present, and the energy is not raised.
Comparison to R,R transition state

Analysing the low energy TS for the R,R configuration draws similar conclusions to that of the low energy R,R configuration. Firstly, the endo approach is again preferred, likely for the same reasons as described previously. Secondly the same slight double bond character is also observed, suggesting many of the reasons that the low energy S,S configuration is the lowest energy of the four is also the same here.
The main difference observed between the two isomers is that there is a much greater overlap with the phenyl ring and the catalyst in the R,R configuration than the S,S. Because of the bulky nature of the groups involved, and the high electron density of the phenyl ring and oxygen atoms (due to their electronegativity in the oxygen case), it is likely that a large amount of electron pair repulsion occurs, which increases the energy of the R,R approach. Because of the nature of the overlap, all such R,R approaches will involve this overlap (which is not present in the S,S arrangement), and hence they will all be higher energy than the S,S conformations.
Calculation of enantiomeric excess
By comparing the difference in energy of the two low energy enantiomers, it is possible to find the enantiomeric excess via the equilibrium constant for some interchange procedure of the two enantiomers. Firstly, it is necessary to calculate the equilibrium constant using the equation
This yields a value for K, which expresses the balance of enantiomers in a mixture of the final product from this epoxidation. For this equation, must be expressed in J mol-1. The conversion from Hartrees to Joules is given by 1 Hartree = 2625.49962 kJ mol^-1[26] which is then easily converted to Joules. This can be expressed in terms of the two enantiomers as follows
where the enantiomers are F+ and F-.
The enantiomeric excess is defined by[27]
and it is possible to find the two F values by rearrangement and simultaneous equations.
The various numeric values are reported below. Standard conditions are assumed.
| Quantity | Value |
|---|---|
| -20219 J mol-1 | |
| K | 3500.991 (3 dp) |
| F+ | 0.000286 (6 dp) |
| F- | 0.999714 (6 dp) |
| ee | 99.94289% |
This predicts a very pure product would be formed, almost purely of the R,R enantiomer. Literature reports[28] shows an experimental enantimeric excess of 95.5%, which shows the calculations performed (and also the energy calculations which underpin these reactions) to be reasonable. The theoretical calculation predicts a more pure product than is actually produced, as these calculations work in a perfect environment with no impurities and assume the reaction is performed with absolutely no error. In reality, neither of these factors are true, and thus an equivalent value for the enantiomeric excess can not be expected.
Analysis of transition state with Jacobsen catalyst
Supplied transition states for cis-β-methyl styrene epoxide are analysed by the same procedure as used previously. Two states are available for each of the S,R and R,S enantiomers, describing the endo/exo arrangement of the alkene compared to the catalyst.
| S,R Series
LOWEST ENERGY | |
|---|---|
| DOI | Energy (kJ/mol-1) |
| DOI:10.6084/m9.figshare.740436 | -3383.259559 LOWEST ENERGY (Open Jmol: Pk-s_r_lowest.mol) |
| DOI:10.6084/m9.figshare.783851 | -3383.253442 (Open Jmol: Pk-s_r_highest.mol) |
| R,S Series | |
| DOI | Energy (kJ/mol-1) |
| DOI:10.6084/m9.figshare.740437 | -3383.251060 LOWEST ENERGY (Open Jmol: Pk-r_s_lowest.mol) |
| DOI:10.6084/m9.figshare.783898 | -3383.250270 (Open Jmol: Pk-r_s_highest.mol) |


Initial inspection of the R,S transition states shows the double bond and carbonyl catalyst being relatively far apart in distance, with the carbonyl being closer in position to the terminal methyl group. The main differentiation between the low and high energy conformation is seen with regards to with overlap between the aromatic rings on the catalyst and the alkene. The low energy conformation has a greater degree of overlap (the two rings are eclipsed), whereas the high energy conformation has staggered rings. This can be explained in terms of pi-stacking[29], where aromatic rings in close arrangement with each other exhibit some form of stabilising interaction. The arrangement shown here is a 'sandwich' like structure, which exhibits exceptionally good stabilisation vs other configurations which exhibit pi stacking.
Considering the S,R enantiomer, this stacking stabilisation is again observed, though to a lesser degree as the alkene's ring takes an angle somewhere between what is observed with eclipsed and staggered. This is likely the main reason why the energy of the S,R enantiomer is of a lower energy than the R,S. In addition, it is observed that a short 1.93 Å internuclear H-H distance exists in the R,S enantiomer (pictured), which is not present in the S,R enantiomer. Such a distance is destabilising as it exists in the replusive part of the Lennard-Jones potential[9], and hence the presence of this interaction destabilises the molecule additionally compared to the S,R enantiomer. The poor overlap of the carbonyl oxygen with the alkene is additionally observed here too.
Calculation of enantiomeric excess
The same method as used for the Shi catalyst is also applied here, and the results are printed below. This time, a cis-alkene is analysed to verify claims that the Jacobsen epoxidation process works best with cis-alkenes[30].
| Quantity | Value |
|---|---|
| -22314.1 J mol-1 | |
| K | 8155.494 (3 dp) |
| F+ | 0.000123 (6 dp) |
| F- | 0.999877 (6 dp) |
| ee | 99.97548% |
Again, a very pure product is predicted from the analysis of the transition states. Of interest, this reaction also yields a similar degree of purity as to what is seen with the Shi catalyst. Literature examination predicts an enantiomeric excess of 68%[31], showing the calculations correctly model the selectivity of this reaction, although it overpredicts the degree of purity seen in the product. This can be explained using via the same rationale as used for the Shi catalyst, however it is also of note that the method chosen to decide which transition state leads to the product is only approximate. Use of the Boltzmann distribution to find the average contribution of each TS to the overall energy would lead to a more accurate picture, and would likely result in a reduced enantiomeric excess due to the increased contribution to the total energy change from the undesired enantiomer.
To verify the claims that this epoxidation works best with cis-alkenes, the transition state for S,S and R,R enantiomers for the trans-alkene are examined via the same method as previously used to yield energies of -3383.262481 Hartrees for S,S and -3383.254344 Hartrees for R,R, making S,S the lower energy isomer.
|
While the enantiomeric excess is slightly reduced compared to the cis-alkene, it is not as low as has been previously reported (20%[32]), and thus it is challenged that the Jacobsen catalyst is a poor catalyst for the epoxidation of trans-alkenes. It is not possible at this point to conclude that this assertion is false as it is necessary to perform the analysis using the Boltzmann distribution as mentioned previously, and additionally it is necessary to consider that, in reality, the reaction does not occur through the lowest energy transition state as it actually coordinates at an alternative angle (potentially due to steric clashing from other catalyst/alkene pairs in the system). This theory is supported by analysis conducted by Jacobsen and his colleagues[30].
Conclusions
Through a variety of techniques, it has been possible to correctly assign the structures for trans-β-methylstyrene epoxide and both the cis and trans form of β-methyl styrene epoxide. Firstly, it is seen that the optical rotation found experimentally matches what is computed for the same structure. Secondly, examination of the transition states give similar values for the enantiomeric excess of the epoxides synthesised with the relevant catalysts, suggesting that the products synthesised through the synthetic pathways executed are successful at producing an enantiomericaly pure sample of the product expected. This both confirms the structure and the reaction pathway seen. A potential misunderstanding of the mechanism for the Jacobsen epoxidation with regards to performance with cis and trans alkenes is the only deviation from literature seen.
Examination of reaction active site
It is possible to examine the nature of the active site of the molecule (namely, where the alkene coordinates to the epoxide). For this investigation, both Non-Covalent Interaction (NCI)[33] and Quantum Theory Atoms in Molecules (QTAIM)[11] theory is used. This information can be used to identify the stereoselectivity of reactions, and so the transition state for the epoxidation of R,S trans-β-methyl styrene using the Jacobsen catalyst has been examined to identify the source of its stereoselectivity.
NCI analysis
This diagram is calculated through electron density cube generation on Gaussian[2] to produce a 'fine' cube which is then uploaded to an online tool[34] to generate the final output seen below.
NCI analysis shows the electron density from non-covalent interactions between atoms in the molecule. The most striking interaction between the molecules in this analysis shows a strong attractive interaction between the phenyl rings of the catalyst and the alkene. This strongly suggests the discussion of pi-stacking[29] mentioned earlier is the reason why the enantiomers containing overlapping phenyl rings are lower in energy than the other enantiomers. This is also one of the reasons contributing to the stereoselectivity seen.
This interaction goes as far as a short H-H contact between a terminal proton on the alkene and the opposite phenyl ring on the catalyst mentioned earlier. There is also a smaller short H-H contact between one of the aromatic protons on the alkene and a methyl proton on the catalyst. Both of these interactions also helps to lock the alkene into a specific arrangement for stereospecific epoxidation, by making the system more electronically favourable to take the arrangement seen.
There are also a number of other interactions within the catalyst, but these do not affect the stereochemistry seen in the reaction. The interactions mentioned previously do provide an indication as to why this reaction is stereoselective.
QTAIM analysis
QTAIM analysis conducted using Avogadro[6] on the Gaussian wavefunction[2] shows a number of sites of coordination between the Jacobsen catalyst and the alkene for this transition state.
Initial observations show the previous theory of pi-stacking[29] causing stability in arrangements where the aromatic rings of the alkene and catalyst coincide is correct, as two bond-critical points are seen between the rings, between locations where atoms are parallel. Unlike the NCI analysis, this shows that this interaction only occurs if the rings are close enough - as towards the centre the rings are further apart from each other, and no such interaction exists here.
The short H-H contacts are also shown -this time making it much more clear which protons interact with each other. Once again, it is thought that these interactions lock the molecule into place for stereospecific epoxidation.
One contact which is not shown in the NCI interaction is part of the covalent interaction between the oxygen/nitrogen and the carbons of the double bond. Of note, the location of the bond critical point is located equidistant between atoms, suggesting the formation of a new covalent bond. This is significant, as it provides information on what exact bonds are formed at the transition state. The equidistance of the critical point also shows this interaction is not due to electronegativities, which is always a possibility with nitrogen and oxygen.
Finally, all other interactions mentioned have equidistant bond critical points, showing that only covalent bonds are being made at this transition state. A few examples from the QTAIM data is shown below.
-
 QTAIM calculation for transition state
 -
 Interactions at the alkene double bond
 -
 Interactions between phenyl rings


Comparison of QTAIM and NCI methods
Both methods provide similar information, showing the stabilising interactions between atoms which lead to the molecule preferring to take one arrangement vs another. One recent study concluded[35] that QTAIM is an inferior method which provides no benefits now NCI has been developed. From what has been identified above, it is tempting to disagree with this claim.
The rationale behind this is that QTAIM provides two details which is not provided by NCI, namely information on the covalent bond formation at the reactive site, and information on the origin of the stabilising interactions on the phenyl rings. NCI suggests the interaction is from the entire ring, while QTAIM shows the interactions originating from just two carbon atoms.
Combined the two methods provide significant information, and future investigation in this field should make full use of both methods to obtain the most detailed picture of the nature of reactivity at transition states.
Candidates for future research
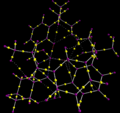
A number of epoxides have been investigated to propose future candidates for research, utilising Reaxys to search for epoxides where the optical rotatory power is either below -500 or above 500. A proposed candidate is (-)-Periplanone-B, a sex pheremone from female cockroaches. It is not possible to purchase this product from suppliers, however an 18 step synthesis is proposed. An optical rotatory power of -552° in hexane has been reported[36].
This compound is of interest due to the number of functional groups it contains. The pheremone contains two epoxide groups, which can lead to investigation into which epoxide is more reactive (e.g. what are the electron densities over each epoxide). Additionally there are two alkene groups, which can also be made subject to NCI[33] and QTAIM[11] analysis to see what transition states would be possible during their epoxidation (if at all possible), and it is also possible to examine the non-epoxidated equivalent to see why the two epoxides shown in the molecule form instead of at the other two potential positions.
Finally, no previous synthesis of this compound utilises epoxidation catalysts. Hence, there is the potential to examine if there is some structural reason why this compound cannot be synthesised using the methods discussed in this report.
The sheer number of functional groups in this molecule thus provides many potential avenues for investigation, making it an interesting molecule for conducting further analysis on.
A drawing of this compound optimised to the MMFF94s[7] level is shown above.
References
- ↑ 1.0 1.1 1.2 1.3 1.4 1.5 H. S. Rzepa, "Synthesis and Computational Lab: 1C", 2013, DOI:10042/a3uws
- ↑ 2.0 2.1 2.2 2.3 2.4 2.5 2.6 Gaussian 09, Revision D.01, Frisch, M. J.; Trucks, G. W.; Schlegel, H. B.; Scuseria, G. E.; Robb, M. A.; Cheeseman, J. R.; Scalmani, G.; Barone, V.; Mennucci, B.; Petersson, G. A.; Nakatsuji, H.; Caricato, M.; Li, X.; Hratchian, H. P.; Izmaylov, A. F.; Bloino, J.; Zheng, G.; Sonnenberg, J. L.; Hada, M.; Ehara, M.; Toyota, K.; Fukuda, R.; Hasegawa, J.; Ishida, M.; Nakajima, T.; Honda, Y.; Kitao, O.; Nakai, H.; Vreven, T.; Montgomery, J. A., Jr.; Peralta, J. E.; Ogliaro, F.; Bearpark, M.; Heyd, J. J.; Brothers, E.; Kudin, K. N.; Staroverov, V. N.; Kobayashi, R.; Normand, J.; Raghavachari, K.; Rendell, A.; Burant, J. C.; Iyengar, S. S.; Tomasi, J.; Cossi, M.; Rega, N.; Millam, N. J.; Klene, M.; Knox, J. E.; Cross, J. B.; Bakken, V.; Adamo, C.; Jaramillo, J.; Gomperts, R.; Stratmann, R. E.; Yazyev, O.; Austin, A. J.; Cammi, R.; Pomelli, C.; Ochterski, J. W.; Martin, R. L.; Morokuma, K.; Zakrzewski, V. G.; Voth, G. A.; Salvador, P.; Dannenberg, J. J.; Dapprich, S.; Daniels, A. D.; Farkas, Ö.; Foresman, J. B.; Ortiz, J. V.; Cioslowski, J.; Fox, D. J. Gaussian, Inc., Wallingford CT, 2009.
- ↑ 3.0 3.1 3.2 W. J. Hehre, R. F. Stewart, and J. A. Pople, J. Chem. Phys., 51 2657-64.
- ↑ 4.0 4.1 4.2 R. Ditchfield, W. J. Hehre, and J. A. Pople, J. Chem. Phys., 54 724.
- ↑ 5.0 5.1 5.2 Thomas A. Halgren, J. Comp. Chem.; 1996; 490-519
- ↑ 6.0 6.1 6.2 6.3 6.4 6.5 6.6 M. Hanwell et al. J. Chem. Inf., 4, 17 Error: Bad DOI specified!
- ↑ 7.0 7.1 7.2 7.3 7.4 7.5 Halgren, T. A. J. Comput. Chem., 20 720–729. DOI:<720::AID-JCC7>3.0.CO;2-X 10.1002/(SICI)1096-987X(199905)20:7<720::AID-JCC7>3.0.CO;2-X
- ↑ S. W. Elmore and L. Paquette, Tetrahedron Letters, 1991, 319 Error: Bad DOI specified!
- ↑ 9.0 9.1 9.2 J. E. Lennard-Jones, J. E., Proc. R. Soc. Lond. A, 106, 463–477 Error: Bad DOI specified!
- ↑ R. M. Pitzer and W. N. Lipscomb, J. Chem. Phys, 39, 1995-2004 DOI:10.1063/1.1734572
- ↑ 11.0 11.1 11.2 11.3 R. Bader, Chemical Reviews 91: 893-928 Error: Bad DOI specified!.
- ↑ 12.0 12.1 12.2 W. F. Maier and P. V. R. Schleyer, J. Am. Chem. Soc 103, 1891-1900
- ↑ P. R. Spurr, B. A. R. C. Murty, W. D. Fessner, H. Fritz, H. and H. Prinzbach, Angew. Chem. Int. Ed. Engl., 26 455–456 DOI:10.1002/anie.198704551 }
- ↑ GaussView, Version 5, Dennington, Roy; Keith, Todd; Millam, John. Semichem Inc., Shawnee Mission, KS, 2009.
- ↑ 15.0 15.1 15.2 15.3 L. A. Paquette, N. A. Pegg, D. Toops, G. D. Maynard, and R. D. Rogers, J. Am. Chem. Soc. 112, 277-283
- ↑ 16.0 16.1 M. W. Lodewyk, C. Soldi, P. B. Jones et. al., J. Am. Chem. Soc., 134, 18550-18553
- ↑ C. Chambers and C. L. Hill, J. Am. Chem. Soc., 112, 8427-8433
- ↑ 18.0 18.1 C. Braddock and H. S. Rzepa, J. Nat. Prod., 71, 728-730
- ↑ 19.0 19.1 C. F. Macrae, P. R. Edgington, P. McCabe, E. Pidcock, G. P. Shields, R. Taylor, M. Towler and J. van de Streek, J. Appl. Cryst., 39, 453-457
- ↑ F. H. Allen, Acta Crystallogr., B58, 380-388
- ↑ C. F. Macrae, P. R. Edgington, P. McCabe, E. Pidcock, G. P. Shields, R. Taylor, M. Towler and J. van de Streek, J. Appl. Cryst., 39, 453-457
- ↑ M. Mantina, A. C. Chamberlin, R. Valero, C. J. Cramer, and D. G. Truhlar, J. Chem. Phys. A., 113, 5806-5812
- ↑ 23.0 23.1 A. D. McLean and G. S. Chandler, J. Chem. Phys., 72, 5639-48.
- ↑ 24.0 24.1 24.2 24.3 M. W. C. Robinson, K. S. Pillinger, I. Mabbett, D. A. Timms and A. E. Graham, Tetrahedron, 66, 8377-8382 DOI:10.1016/j.tet.2010.08.078
- ↑ P. Besse and M. F. Renard, Tetrahedron: Asymmetry, 5, 1249-1268, DOI:10.1016/0957-4166(94)80167-3
- ↑ CODATA 2010
- ↑ IUPAC. Compendium of Chemical Terminology, 2nd ed. (the "Gold Book"). Compiled by A. D. McNaught and A. Wilkinson. Blackwell Scientific Publications, Oxford (1997). XML on-line corrected version: http://goldbook.iupac.org (2006-) created by M. Nic, J. Jirat, B. Kosata; updates compiled by A. Jenkins. ISBN 0-9678550-9-8. DOI:10.1351/goldbook
- ↑ Z.-X. Wang, Y. Tu, M. Frohn, J.-R. Zhang, Y. Shi, J. Am. Chem. Soc., 119, 11224-11235 DOI:10.1021/ja972272g
- ↑ 29.0 29.1 29.2 G. B. McGaughey, M. Gagné, A. K. Rappé, J. Biol. Chem., '273 15458–15463 DOI:10.1074/jbc.273.25.15458
- ↑ 30.0 30.1 T. Linker, Angew. Chem. Int. Ed. Engl., 36 2060–2062 DOI:10.1002/anie.199720601
- ↑ R. Irie et. al., Tetrahedron: Asymmetry, 2, 481-494, DOI:10.1016/S0957-4166(00)86102-9
- ↑ W. Zhang et. al., J. Am. Chem. Soc., 112, 2801-2803
- ↑ 33.0 33.1 E. R. Johnson, S. Keinan, P. Mori-Sánchez et. al., J. Am. Chem. Soc., 132, 6498-6506
- ↑ H. S. Rzepa, "Script for creating an NCI surface as a JVXL compressed file from a (Gaussian) cube of total electron density"
- ↑ J. R. Lane, J. Contreras-García, J. Piquemal, B. J. Miller and H. G. Kjaergaard, Journal of Chemical Theory and Computation, 9, 3263-3266
- ↑ S. Kuwahara, K. Mori, Tetrahedron, 46, 8075-8082 DOI:S0040-4020(01)81464-2