Rep:Mod:eo308mod3
Third Year Computational Lab - Module 3: Transition states and reactivity by Emma Oakton
The Cope Rearrangement Tutorial - Optimising the reactants and products
Part A
An initial structure of 1,5-hexadiene was first optimised using a Hartee Fock (HF) method and 3-21G basis set. The initial structure was drawn there was an anti-peri-planar relationship with respect to the substituents on the central C-C bond. The HF/3-21G optimisation was then run of Gaussian, with memory set to 250MB. The output log file for this calculation can be found at: https://wiki.ch.ic.ac.uk/wiki/images/a/ad/REACT_ANTI.LOG
The results summary for this optimisation can be found in the figure below. Figure 2 below shows the 1,5-hexadiene structure, the Jmol button shows the optimised anti 1,5-hexadiene structure.

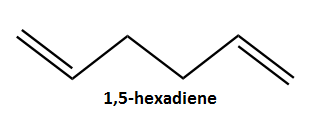
The Point group of this structure was determined as C2.
Part B
In this section, the gauche conformation of 1,5-hexadiene is investigated. Following the same method in part A, an initial gauche conformation was drawn (using Gaussview) and optimised using an HF method and 3-21G basis set. Figure 3 below shows the results summary window for this calculation. Figure 4 (Jmol applet button) shows the optimised gauche structure of 1,5-hexadiene. The output log file for the gauche optimisation can be found at: https://wiki.ch.ic.ac.uk/wiki/images/8/80/REACT_GAUCHE.LOG
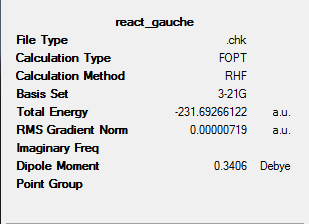
The point group for the gauche conformation was determined as C2.
The final energies of parts A and B can now be compared. Table 1 below shows these value in Hartrees and kJ/mol.
| Conformation | Energy / Hartees | Energy / kJ/mol | Energy difference / kJ/mol |
|---|---|---|---|
| APP | -231.69260235 | -608308.974 | 0.154 |
| Gauche | -231.69266122 | -608309.128 |
The table above shows the structure optimised in part A (APP) is higher in energy in comparison to the gauche conformation.
Normally we would expect the anti-peri-planar (APP) conformation to be lower in energy, and therefore more a more favourable structure, due to reduced steric strain within the APP conformation. The gauche structure doe have increases steric clashing due to the reduced torsion angle between the groups attached to the 2 cental C atoms. However the gauche structure can be investigated further, to rationalise it's increased stability as confirmed by the above calculations.
For hydrocarbons containing electron withdrawing groups (eg. 1,2-difluoroethane) it is widely noted that the gauche confirmation is much more stable than the APP conformation, or any others such as syn-peri-planar. This increase in stability has been termed the Gauche Effect. However IUPAC also defines the Gauche Effect as The destabilization of the gauche (synclinal) conformation in a two carbon unit bonded vicinally to large, soft and polarizable elements such as sulfur and bromine. . This definition can be used for 1,5-hexadiene. The two alkene groups in 1,5-hexadiene can be considered are large and polarisable, due to the diffuse pi bonding present.
The amount of attractive Van der Waals H-H interactions within the two conformations (APP and gauche) can also be investigated, as an increased amount of these interactions would lead to a more stable conformation. The relative attractive H-H bond distances are shown in diagram 1 and 2 below for the anti and gauche conformations.


The Van der Waals attractive H-H bond distance is around 2.47Å. It can be seen that the gauche structure has more interactions around this distance (diagram 1). The increased amount of interactions in this case leads to extra stabilisation and a decreased energy for the gauche conformation relative to the anti conformation.
Part C
Taking into account the results of part A and B. It can be seen that gauche relationships result in a lower molecular energy. Therefore it can be suggested that the most stable conformation would be that with the most gauche relationships between bonds.
To investigate this, a 1,5-hexadiene comformer was drawn increasing the amount of gauche relationships within the molecule. The Jmol below shows this initial structure.
A HF/3-21G level optimisation was completed on the above Jmol structure. The output log file for this optimisation can be found at:. The results summary can be found in the figure below along with a Jmol of the resulting structure.

From the Jmol above it can be seen that the sterics of the optimised structure can be improved. The steric clash which can be reduced is shown in the figure below.

With an aim to reduce this steric clash and produce a lower energy conformer, the above structure was further optimised (HF/3-21G) after alteration.
The Jmol of the resulting structure and results summary can be found below.

The results summary (left) shows that the re optimised structure, which accounts for sterics and gauche interactions is more favourable due to it's lower energy.
Part D
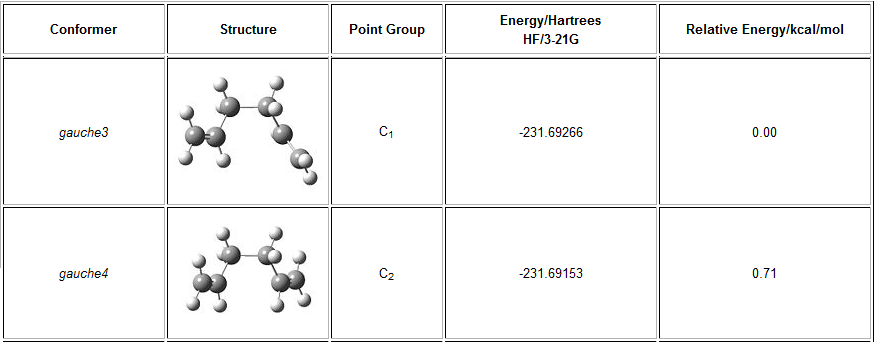
The structure 1 in part C can be compared to the 'gauche4' structure given in the figure below. The re optimised structure is similar to the gauche3 conformation shown in the figure below.
Part E
The structure in figure 6 below shows the Ci anti2 conformation of 1,5-hexadiene optimised in this section.

An initial structure of this anti2 conformation was drawn and optimised. Figure 7 below shows the optimisation result summary for this calculation using a HF method and 3-21G basis set.
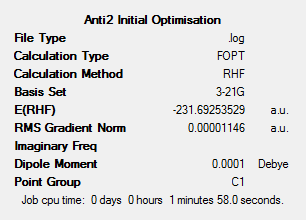
The energy of the structure in figure 6 can be compared with the energy shown for the HF/3-21G optimised structure in figure 7.
It can be seen that the optimised structure (Jmol shown in figure 8) has the same energy as that shown in figure 6 and therefore correct optimised structure has been found.
Part F
The structure in figure 8 (part E) was then re-optimised, using Gaussian. A DFT-B3LYP method and 6-31G(d) basis set were used for this calculation. The results summary and re-optimised structure of Ci anti2 1,5-hexadiene can be found below.

Table 2 below compares the energy values for the anti2 structure calculated with HF/3-21G and DFT-B3LYP/6-31G(d).
| Calculation Method/Basis set | Energy of anti2 1,5-hexadiene / Harteees | Energy of anti2 1,5-hexadiene / kJ/mol |
|---|---|---|
| HF/3-21G | -231.6925 | -608308.7051 |
| DFT-B3LYP/6-31G(d) | -234.6117 | -615973.0653 |
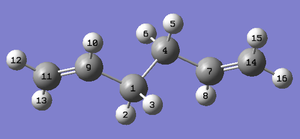
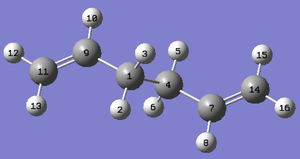
The geometries of the anti2 structures optimised under HF/3-21G and DFT-B3LYP/6-31G(d) levels of theory can be compared. This is done in the table below. The labelling in the table is with reference to the two figures below.
| Calculation Method/Basis set | HF/3-21G | DFT-B3LYP/6-31G(d) | Literature[1]. |
|---|---|---|---|
| C=C bond lengths / Å | 1.316 | 1.334 | 1.340 |
| C9,1,4-C1,4,7 bond length / Å | 1.509, 1.553, 1.509 | 1.504, 1.548, 1.504 | 1.508 |
| C-H bond length / Å | 1.07-1.09 | 1.09-1.10 | - |
| C14,7,4,1-C7,4,1,9-C4,1,9,11 bond angles / o | 124.805, 111.345, 111.346,124.807 | 125.285, 112.671, 112.670, 125.286 | 124.6, 111.5 |
The above table shows there is reasonable agreement between the 2 levels of theory. Increasing the level of theory to DFT-B3LYP shows a decrease in the C-C bond length and an increase in the C=C bond length. The bond angles also so an increase of approximately 0.5o and 1.3o.
In comparison to literature the increased accuracy of the DFT-B3LYP method is confirmed. As the DFT-B3LYP geometry is much closer to that quoted in literature[1].
Part G
A frequency analysis calculation on the DFT-B3LYP/6-31G(d) optimised structure of anti2 1,5-hexadiene was run. This produced the output file found at: https://wiki.ch.ic.ac.uk/wiki/images/c/c6/REACT_PARTG_ANTI2REOPT_FREQ.LOG
Figure 11 shows the low frequencies calculated for this structure.

From this we can see there are negative frequencies at -9.4294cm-1, -0.0004cm-1. However to account for calculation error, truly negative values are considered if they are less than -5cm-1. From this we can see the -9.4294cm-1 frequency is a concern.
The nature of this vibration can be justified by looking at the vibrational modes for the anti2 1,5-hexadiene. The first 5 vibrational modes for this structure can be found in figure 12 below.
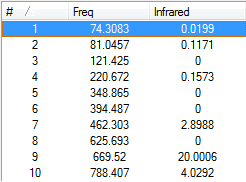
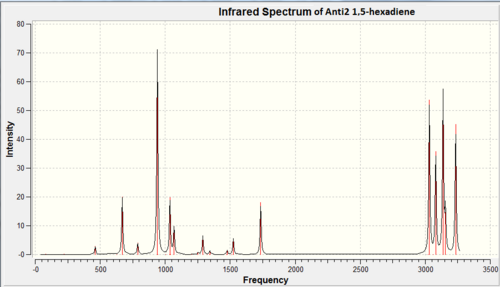
From figure 12 above, we can see the lowest vibration mode occurs at 75.004cm-1. As the vibration at -8.4172cm-1 does not occur in this list or the IR spectrum (figure 13) all the calculated frequencies are considered real, indicating the anti2 1,5-hexadiene structure is a ground state structure and not a transition state.
Figure 13 below shows the IR spectrum of anti2 1,5-hexadiene.
The output checkpoint file for this frequency analysis also gave information on the energies in the Thermochemistry section of the file. This is shown in the figure below.

The Cope Rearrangement Tutorial - Optimising the Chair and Boat Transition Structures
Optimising the Chair Transition Structure
An allyl fragment was first optimised, using a HF method and 3-21G basis set, the output log file for this optimisation can be found at: https://wiki.ch.ic.ac.uk/wiki/images/c/cc/ALLYL_OPTIMISATION.LOG
Two of the optimised allyl structures were orientated to mimic the chair transition state structure. The distances between the ends of the two allyl fragments was set as 2.2A. The figure below shows the orientation of the two allyl fragements.

The structure shown in the figure above was then optimised and frequency analysis completed. This was done by running an Opt+Freq calculation and optimising to a transition state using the Berny Algorithm (denoted by TS(berny)). The force constants were set to be calculated once and keywords 'Opt=NoEigen' added.
The results summary and optimised structure Jmol can found below. The output log file for the Opt+Freq calculation can be found at:
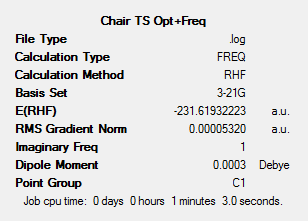
The vibrational frequencies of this transition state can also be analysed. The figure below shows the IR spectrum of the chair transitions tate structure as calculated in the Opt+Freq calculation.


From the two figures above we can see there is a large negative frequency at 818cm-1. By animating this mode, we can see it corresponds to the Cope Rearrangement. This shown in the two figures below. The terminal C atoms move towards each other in a concerted bond forming fashion.


The chair transition state structure can now be analysed via the frozen co-ordinate method. The co-ordinates of the four terminal C atoms in the chair transition state structure were frozen and the bond breaking/forming distances set as 2.2A. An optimisation calculation was run (HF/3-21G), to optimise the structure to a minimum.
This model was then re-optimised (HF/3-21G) to a transition state, without force constant calculation. The same co-ordinates were frozen, however the bond/derivative were selected over unidentified/add. The output file for this calculation can be found at: https://wiki.ch.ic.ac.uk/wiki/images/3/3b/CHAIR_TS_FROZEN_COORD_BONDDERIV_PARTG.LOG
The results summary and Jmol of this optimised structure can be found below.
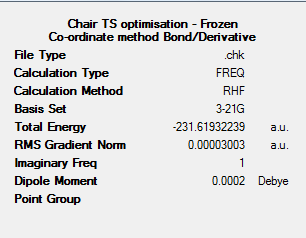
The table below compares the bond forming/breaking distances for the Opt+Freq calculation and the two step optimisation completed above.
| Calculation | Bond length / Å |
|---|---|
| Opt+Freq | 2.019 |
| Opt Bond/Derivative | 2.021 |
The above table shows that the initial Opt+Freq calculation freezes the co-ordinate bonds to 2.19Angstroms. However when the Bond/Derivative options are selected the bond length is optimised to the accurate values of 2.021 Angstroms. This distance is the optimum distance between the two fragments which make up the chair transition state structure.
IRC method for Chair Transition Structure
In order to visualise the path down which a structure is optimised to the structure with the lowest potential energy, we employ the IRC method. This was done in a variety of ways.
Method 1
In the Gaussview Calculation Setup the following alterations were made under the IRC calculation:
1. Reaction co-ordinate was computed in the forward direction only.
2. Force constants were calculated once.
3. Number of points along the IRC (N) set to 50.
The results summary and Jmol of the final optimised structure produced can be found below.
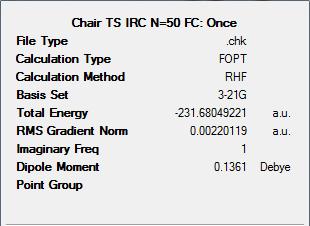

It can be seen from the information given above, that the resulting structure from the previous IRC calculation is not a minimum. Therefore we can use other methods to improve this. This is carried out below.
Method 2
Method 2 involves running an optimisation to a minimum on the final step of the initial IRC above. The structure shown in the Jmol titled ‘Jmol of resulting IRC method 1 structure’ (above) was optimised to a minimum with HF/3-21G level theory. The published output files can be found here: DOI:10042/to-6189

It can be seen from the Jmol above that this method has not resulted in the chair transition structure.
Method 3
In method 3, the following alterations were made under the IRC calculation:
1. Reaction co-ordinate was computed in the forward direction only.
2. Force constants were calculated once.
3. Number of points along the IRC (N) set to 100.
Please find the result summary and Jmol of the resulting structure below. The figure below right shows the total energy and RMS gradient variation throughout the IRC calculation.


Method 4
Method 4 invokes the following changes to the IRC calculation:
1. Reaction co-ordinate was computed in the forward direction only.
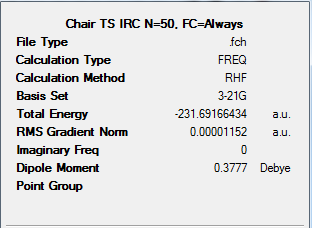
2. Force constants were calculated always, i.e. for every step of the IRC calculation.
3. Number of points along the IRC (N) set to 50.
The output log file for this calculation can be found at: DOI:10042/to-6190
The figure below shows the result summary for this calculation. The Jmol of the resulting structure can also be found below.
The figure below right shows the total energy and RMS gradient variation throughout the IRC calculation.

Conclusions
My looking at the total energy graphs for the methods, we can see that methods 3 and 4 optimise the structure to the lowest energy transition states. We can now compare between the energies of these two structures.
| Method used | Energy / Hartees | Energy / kJ/mol | Energy difference / kJ/mol |
|---|---|---|---|
| 3 | -231.69047617 | -608303.39152243 | 3.120 |
| 4 | -231.69166434 | -608306.511063 |
From the above table we can see the energy difference of the results between methods 3 and 4, is reasonably small. However it is noted that method 4 is computationally more intensive than method 3. This is because in method 4 the force constants are calculated at every step. Therefore there is not a large increase in energy minimisation in comparison to the addition amount of computational power. Because of this method 3 would be most suitable in this case. Although the number of steps (N) could be increased further.
Optimising the Boat Transition Structure
The DFT-B3LYP/6-31G(d) optimised anti2 1,5-hexadiene structure was duplicated. Both structures were labelled and orientated to look like the reactants and products. This is shown in the figure below.

An Opt+Freq calculation was then run on the above structures, optimising to a QST2 transition state. However this calculation resulted in a non-reasonable transition state. The output file can be found at: https://wiki.ch.ic.ac.uk/wiki/images/6/6c/BOAT_OPT.LOG
The figure below shows the resulting optimised QST2 transition state structure as shown from the checkpoint file.

The figure (left) shows the optimised QST2 transition state structure to be a chair conformation with crossed C1-C6 and C3-C4 bonds. Chemical intuition tells us this would not be a viable transition state structure.
Because the previous calculation did not result in a reasonable transition state structure, the input file was modified. The central C-C-C dihedral angles in both the reactant and product were set to 0o and the C5-C4-C3 and C2-C3-C4 dihedral angles set to 100o in the reactant and the C5-C6-C1 and C2-C1-C6 dihedral angles set to 100o in the product. The resulting structures and orientations for the input file are shown in the figure below.

A QST2 Opt+Freq calculation was then set up on the above structures. This was done by selecting to optimised between the structures to a QST2 transition state. The output log file for this calculation can be found at: https://wiki.ch.ic.ac.uk/wiki/images/7/7c/BOAT_MODIFIED.LOG
The resulting structure was then reoptimised (HF/3-21G) to give the result file below. The figures below shows the results summary for the Opt+Freq and reoptimisation calculation, the resulting TS(QST2) structure and a Jmol of this TS.
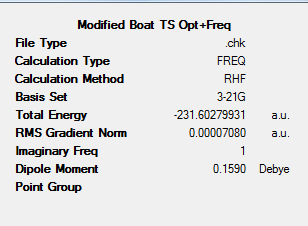


From the original Opt+Freq calculation output checkpoint file, the vibrational modes of the boat transition state can be analysed. The figure below shows the region of the output log file denoting the low vibrational frequencies of the boat transition state structure.

The above figure shows there is a large negative vibration at -839.977cm-1. This vibration was then animated to further investigate the nature of the vibrational mode. This is shown in the two figures below.

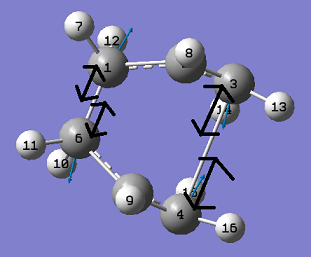
Activation energy of the Chair Transition State
So that the activation energy of the reaction (Cope rearrangement) via the chair transition state can be calculated for both HF/3-21G and DFT-B3LYP/6-31G(d) level calculations, an optimisation an frequency analysis must be compelted at DFT-B3LYP/6-31G(d) level for the chair transition state.
The HF/3-21G chair transition structure was first optimised using DFT-B3LYP method and 6-31G(d) basis set. This calculation gave the output log file found at: https://wiki.ch.ic.ac.uk/wiki/images/3/30/CHAIR_ACCOPT.LOG
Frequency analysis was then completed again at the DFT-B3LYP/6-31G(d) level. This gave the output files published here: DOI:10042/to-6186
This frequency calculation gave the following result summary and accurately optimised chair boat structure.

From the output log file ( DOI link above) information on the energies of the chair transition state can be gathered. This is found in the thermochemistry section of the log file, shown in the figure below.

This comparison is made in the table below. Where: Eelec = Electronic energy, ZPE = Zero Point Energy and Ethermal = Thermal energies.
| HF/3-21G | HF/3-21G | DFT-B3LYP/6-31G(d) | DFT-B3LYP/6-31G(d) | |
|---|---|---|---|---|
| Eelec + ZPE / Hartrees | Eelec + Ethermal / Hartrees | Eelec + ZPE / Hartrees | Eelec + Ethermal / Hartrees | |
| Temperature / K | 0 | 298.15 | 0 | 298.15 |
| Anti2 Reactant | -231.539539 | -231.532566 | -234.469285 | -234.461965 |
| Chair TS | -231.466701 | -231.461341 | -234.413434 | -234.407105 |
From the values in the table above the activation energies (Eact) at 0K and 298.15K can be calculated. This is done in the table below.
| HF/3-21G | HF/3-21G | DFT-B3LYP/6-31G(d) | DFT-B3LYP/6-31G(d) | Experimental | |
|---|---|---|---|---|---|
| Temperature / K | 0 | 298.15 | 0 | 298.15 | 0 |
| Eact / Hartrees | 0.072838 | 0.071225 | 0.055851 | 0.05486 | - |
| Eact / kcal/mol | 45.71 | 44.69 | 35.05 | 34.43 | 33.5 ± 0.5 |
The above table shows there is a large difference between the activation energy computed via HF/3-21G. However the accuracy of this calculation is greatly increased by using the more accurate DFT-B3LYP/6-31G(d) method and basis set. In this case the increased accuracy is worth the increased computational power required to perform the more accurate calculation.
Activation energy of Boat Transition State
In order to compute the activation energy of the reaction occuring via the boat transition state, the boat structure must be more accurately optimised. This was done by optimising the HF/3-21G structure using a DFT-B3LYP method and 6-31G(d) basis set. The output file for this calculation can be found at: https://wiki.ch.ic.ac.uk/wiki/index.php?title=Image:Boat_accurate_opt.out
The figure below shows the results summary for this optimisation. A Jmol of this accurately optimised structure can also be found below.
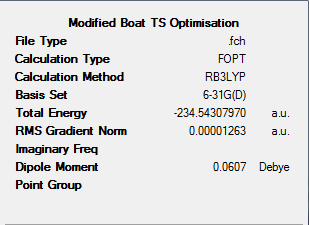
Frequency analysis (DFT-B3LYP/6-31G(d)) was next completed on the accurately optimised boat structure. From this energy values can be gained from the output log file. The output log file for this calculation can be found at: https://wiki.ch.ic.ac.uk/wiki/images/e/e0/Boat_accurate_freq.txt
The figure below shows the energy values found under the thermochemistry section of the output log file.

We can compare the energies calculated in the frequency analysis for the boat transition structure, to the anti2 reactant conformation for both level of theory. To make a full comparison for the HF/3-21G values, frequency analysis of anit2 was completed at this level, the output file for this can be found at: https://wiki.ch.ic.ac.uk/wiki/images/4/40/Anti2_HF_freq.txt
This comparison is made in the table below. Where: Eelec = Electronic energy, ZPE = Zero Point Energy and Ethermal = Thermal energies.
| HF/3-21G | HF/3-21G | DFT-B3LYP/6-31G(d) | DFT-B3LYP/6-31G(d) | |
|---|---|---|---|---|
| Eelec + ZPE / Harees | Eelec + Ethermal / Hartrees | Eelec + ZPE / Hartrees | Eelec + Ethermal / Hartrees | |
| Temperature / K | 0 | 298.15 | 0 | 298.15 |
| Anti2 Reactant | -231.539539 | -231.532566 | -234.469285 | -234.461965 |
| Boat TS | -231.450921 | -231.445294 | -234.402302 | -234.395968 |
From the values in the table above the activation energies (Eact) at 0K and 298.15K can be calculated. This is done in the table below.
| HF/3-21G | HF/3-21G | DFT-B3LYP/6-31G(d) | DFT-B3LYP/6-31G(d) | Experimental | |
|---|---|---|---|---|---|
| Temperature / K | 0 | 298.15 | 0 | 298.15 | 0 |
| Eact / Hartrees | 0.088618 | 0.087272 | 0.066983 | 0.065997 | - |
| Eact / kcal/mol | 55.61 | 54.76 | 42.03 | 41.41 | 44.7 ± 2.0 |
From the results above we can see there is a large difference between the Eact values calculated for the HF and DFT-B3LYP methods (and their corresponding basis sets). The increased accuracy of the DFT-B3LYP/6-31G(d) method can be seen by comparing the values (for 0K) with the experimental value. We can see that the DFT-B3LYP calculated value is much closer to the experimental value, it is almost within the experimental error.
Discussion of the chair and boat transition states
The above analysis shows the boat transition state has a higher energy then the chair transition state and therefore the reaction via the boat transition state has a higher activation energy.
The Diels Alder Cycloadditon
MO analysis of cis-Butadiene
An initial structure of cis-Butadiene was first optimised using the AM1 semi-empiral method. This gave the output log file found at: https://wiki.ch.ic.ac.uk/wiki/images/7/7c/CIS_BUTADIENE_NEW_OPTIMISATION.LOG
The optimisation gave a result summary found in the figure below and the Jmol of the AM1 optimised cis-butadiene structure can also be found below.

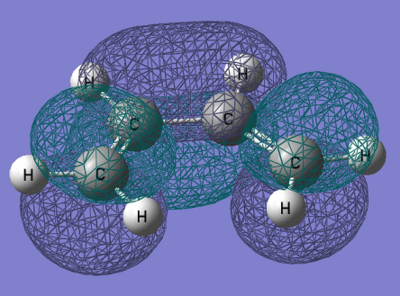
From the output checkpoint file for this calculation, the molecular orbitals of cis-Butadiene were visualised, specifically the HOMO and LUMO. Figures of these can be found in the table below.
| Structure | HOMO | LUMO |
|---|---|---|
| cis-Butadiene | 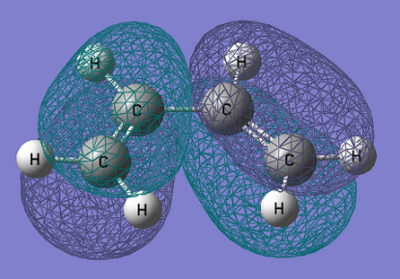
|
|
| Symmetry with respect to molecular plane | Antisymmetric | Antisymmetric |
The above table shows the HOMO and LUMO of the optimised cis-Butadiene structure. From the figure we can see both orbitals are antisymmetric with respect to the molecular plane.
Transition State Structure for Prototype Reaction
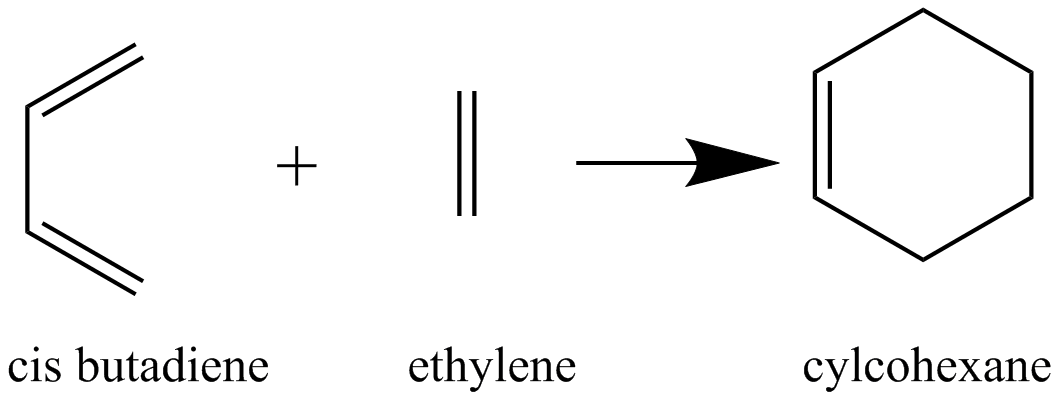
In this section, the 'prototype' reaction shown in the figure below was studied. This is a Diels-Alder reaction between cis-Butadiene (optimised above) and ethylene.
An initial transition state structure (figure below) was drawn and optimised in a two step process.
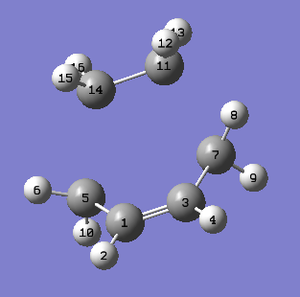
Firstly, the co-ordinates of atoms; 14, 5, 7 and 11 were frozen and their bond distances (14-5 and 11-7) set to 2.2A. An AM1 optimisation to a minimum geometry was then run. The following output log file was produced: https://wiki.ch.ic.ac.uk/wiki/images/9/9b/DATS_2BL_OPT_TO_MIN.LOG
The results summary and Jmol of resulting optimised structure can be found below.
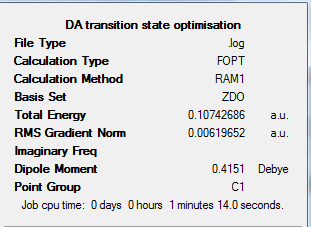
This structure was then re-optimised. This re-optimisation will allow the bond distances previously frozen to be optimised. This was done by opening the checkpoint file of the previous optimisation and changing the 'unidentified' tab to 'bond' and the 'add' tab to 'derivative'. An optimisation to TS(berny) was then run. This calculation gave the following output log file: https://wiki.ch.ic.ac.uk/wiki/images/d/d1/DATS_2BL_BONDDERIV.LOG
The results summary and Jmol of the resulting structure for this calculation can be found below.

Geometry of optimised Transition State
The table below shows the geometric elements for the optimised transition state.
| Value | |
|---|---|
| C14-C5, C11-C7 Bond Distance / Å | 2.12, 2.12 |
| Typical sp3 bond distance / Å | 1.38 |
| Typical sp2 bond distance / Å | 1.40 |
| C1-C5-C14, C3-C7-C11 Bond Angle / o | 99.39, 99.38 |
The Van der Waals radius can also be calculated from the C-C bond length. This is because in order to calculate this value we treat the C atoms as hard spheres and the radius represents half of the C-C bond length.
The Van der Waals radius: 1.38/3 = 0.69Å
Vibrational modes for the Prototype Reaction Transition State
Frequency analysis was then carried out on the above optimised transition state structure. This was done again using a semi-empirical AM1 level Opt+Freq calculation on Gaussian. The output log file for this calculation can be found here: https://wiki.ch.ic.ac.uk/wiki/images/4/43/DATS_2BL_BONDDERIV_OPTFREQ.LOG
The low frequency vibrations can be noted from the output log file (link above), these are shown in the figure below.

From the above figure we can see there are 2 negative frequencies (<-5cm-1) occurring at -955.19cm-1 and -8.28cm<sup|>-1. Large negative frequencies would be expected from this structure as it is a transition state, and negative frequencies are and indication that a structure is a true transition state. We can animate these vibrations to see if one corresponds to the Diels-Alder reaction.
The figures below show vibrational modes 1-10 for this transition state and it's IR spectrum.
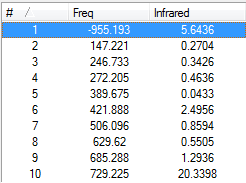
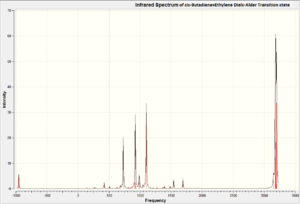
From the figures above, we can confirm the vibration at -955.19cm-1 is the only large negative vibration in the system. We can now animate this vibration to see if it corresponds to the Diels Alder reaction between cis-Butadiene and Ethylene. The vibrational mode at -955.19cm-1 is shown in the figures below.
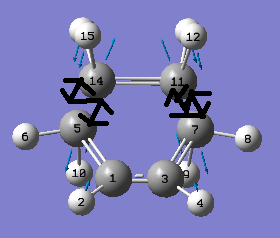
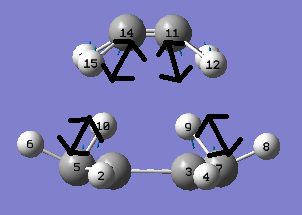
From the above figures we can see that this negative vibration does correspond to the Diels Alder reaction between cis-Butadiene and Ethylene. The above figures show this bond formation process is synchronous.
Now we can compare this vibration with the lowest positive vibration which occurs at 147.22cm-1. This vibration is modelled in the two figures below. The red arrows represent the movement of the cis-Butadiene fragment, whereas the black arrows show the movement of the ethylene fragment.
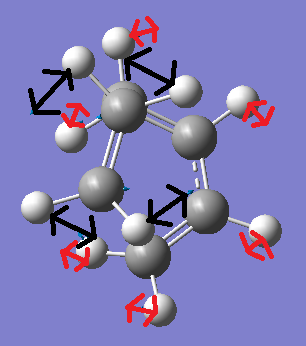
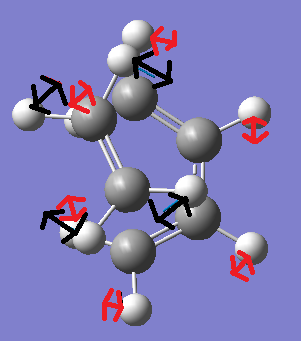
The above figures demonstrate the lowest positive vibrational mode. This shows ansynchorous twisting of the ethylene and butadiene fragments. However the amount of displacement of the ethylene fragment during twsiting is much larger than the displacement of the cis-Butadiene fragment.
Molecular Orbitals of the Transition State Structure
From the previously completed optimisation and frequency calculation of the cis-Butadiene + Ethylene transition state structure. The HOMO of this structure was modelled and can be found in the figure below.
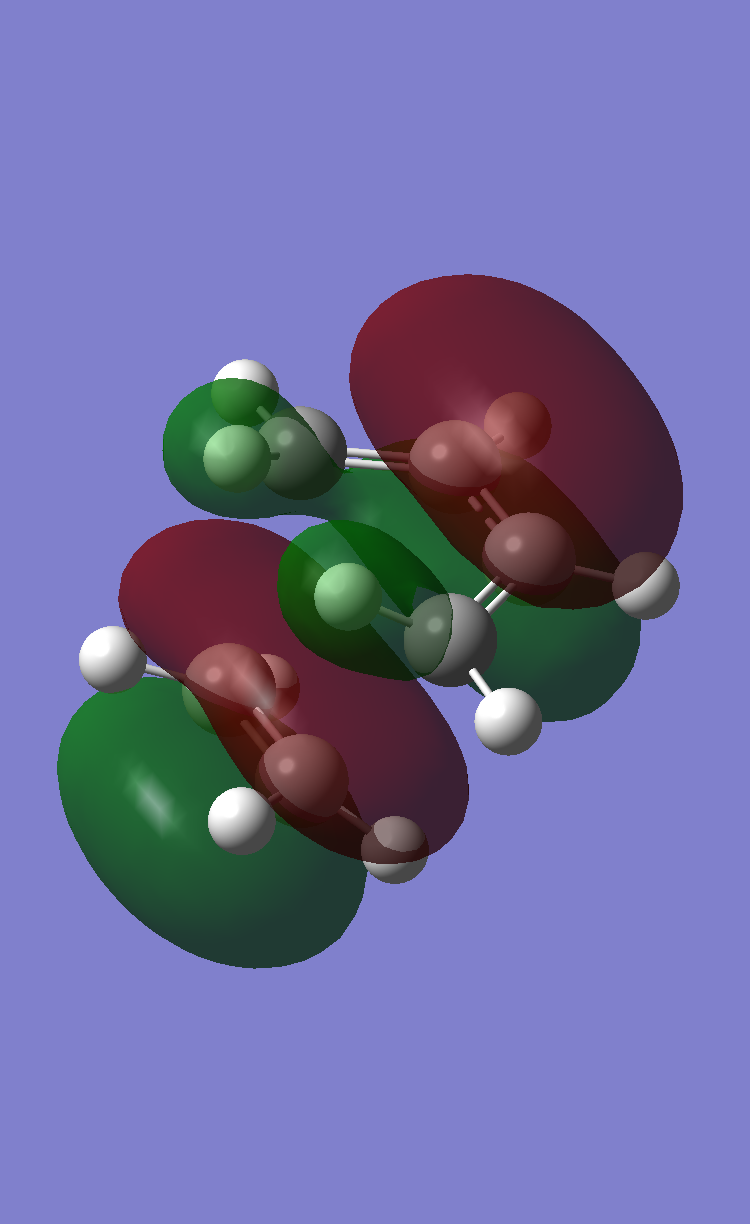
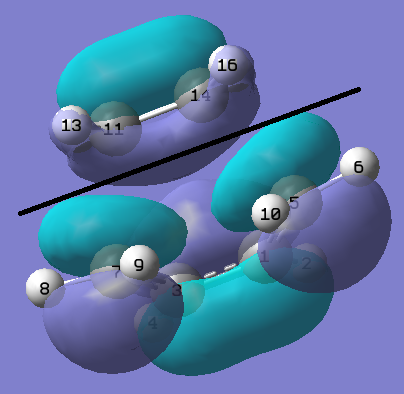
About the symmetry/nodal plane shown by the black line in the figure above, it can be seen the HOMO orbital is antisymmetric. The orbitals contributed from each fragment towards this MO can also be deduced from this figure. The MO is formed via overlap between the de localised pi system of the butadiene fragment and p orbitals from the ethylene fragment. This reaction is allowed because the orbitals are of the same symmetry and they have similar energies.
By looking at the LUMO we can see that the orbital is antisymmetric about the nodal plane.
Regioselectivity of the Diels Alder Reaction
In this section, the Diels Alder reaction between Cyclohexa-1,3-diene and Maleic Anhydride. This can form two products, shown in the reaction scheme below.

It is well known that this reaction is kinetically controlled and the exo product is the major product of this reaction. From this we know that the reaction pathway to the endo product will involve a lower energy transition state. The transition states for the exo and endo product pathways can now be modelled using GaussView 3.0.
Exo-product Transition State
Geometry Optimisation
The first stage in forming the exo product transition state was optimising the Maleic Anhydride molecule. This was done using a semi-empirical AM1 method. The output log file for this calculation can be found here: https://wiki.ch.ic.ac.uk/wiki/images/0/04/MALEIC_ANHYDRIDE_OPT.LOG
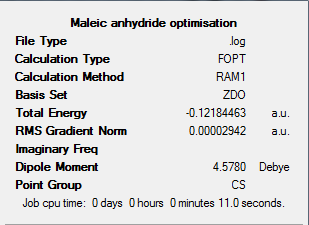
The results summary below shows the key results of this optimisation, the Jmol of the resulting optimised Maleic Anhydride structure can be found below.
An initial guess transition state structure was then drawn in GaussView. This is shown in the Jmol below.
This was then optimised using the freeze co-ordinate method described previously. The fragment distances were set to 2.2A. This initial optimisation gave the following output log file found here: https://wiki.ch.ic.ac.uk/wiki/images/b/b3/CYCLO_ANHYDRIDE_TS_EXO_OPT.LOG
The resulting structure from this calculation can be found in the Jmol below.
An Opt+Freq calculation was then carried out on this initially optimised structure. The co-ordinates of the previously frozen bonds (bonds which are expected to form during the Diels Alder reaction) were unfrozen and the bond distance between the fragments was decreased to 2.1A. The calculation was set to optimise to a TS(berny) calculating the force constants once, adding Opt=NoEigen as a keyword. This calculation was the run on Gaussian and produced the following output log file: https://wiki.ch.ic.ac.uk/wiki/images/0/07/EXO_TS_OPTIMISATION_NEW.LOG
This produced the results summary window found in the figure below. The Jmol below also shows the final exo transition state structure.

The geometry of this optimised exo transition state can now be analysed. This is done in the table below. All bond lengths are quoted with respect to the labelling in the figure below.

| Value | |
|---|---|
| C1,2-C16,15 Bond Distance / Å | 2.636, 2.635 |
| C1,1,6,5,4,3-C2,6,5,4,3,2 bond distance / Å | 1.397, 1.394, 1.489, 1.522, 1.489, 1.394 |
| C16,16,15-C15,19,17 Bond Distance / Å | 1.410, 1.488, 1.488 |

Frequency Analysis
As the previous calculation carried out on the exo transition state was an Opt+Freq calculation, the same log file can be used to show the vibrations in the molecule. These can be found directly in the log file and visualising the vibrations on GaussView.

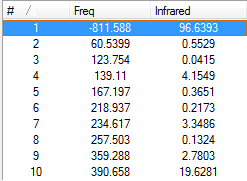
From the above figures we can see the major negative frequency occurs at -811.59cm-1. This confirms this structure is a transition state. This vibration is visualised in the figure below.

HOMO analysis
The figures below show the HOMO of the exo transition state from two different view points.
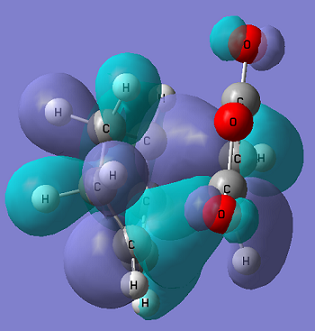
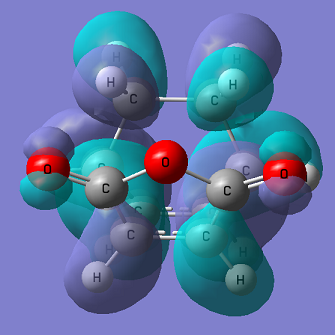
From the figure above it can be seen there is no interaction between the carbonyl C and the cyclohexa-1,3-diene, suggesting no secondary overlap takes place here.
Endo-product Transition State
Geometry Optimisation
The endo transition state was optimised in the same way as the exo transition state. An initial structure guess was made combining the cyclohexa-1,3-diene fragments with an optimised Maleic Anhydride. This is shown in the Jmol below.
This structure was then optimised using the freeze co-ordinate method, freezing the bond co-ordinates for the bonds formed during the Diels Alder reaction. This calculation (semi-empirical AM1 method) produced the following output log file: https://wiki.ch.ic.ac.uk/wiki/images/8/87/ENDOCYCLO_ANHYDRIDE_TS_OPT.LOG
The calculation produced the optimised structure found below.
This structure was then re-optimised. The previously frozen bonds were unfrozen and the fragment distances reduced to 2.1A. An Opt+Freq calculation was then to optimise to a TS(berny) using a semi-empirical AM1 method. The force constants were calculated once and 'Opt=NoEigen' added to the keywords. This calculation produced the output log file here: https://wiki.ch.ic.ac.uk/wiki/images/b/bf/ENDO_TS_OPTIMISATION.LOG
This calculation produced the results summary below with the Jmol of the resulting structure.
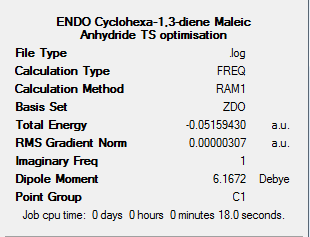
The table below shows the important bond lengths for the optimised endo transition state. They are made with respect to the labelling in the diagram below.

| Value | |
|---|---|
| Partially formed C15,16-C2,1 Bond Distance / Å | 2.707 |
| C16,16,15-C15,19,17 Bond Distance / Å | 1.408, 1.408, 1.489 |
| C1,1,6,5,4,3-C2,6,5,4,3,2 bond distance / Å | 1.397, 1.393, 1.490, 1.522, 1.490, 1.393 |
The distance between the Maleic Anhydride and cyclohexa-1,3-diene fragment. This is done below.
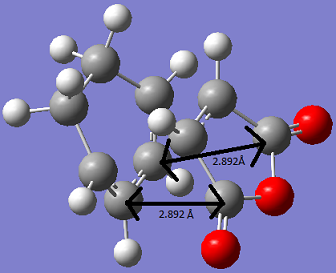
Although this distances is shorter than that for the exo structure, this does not lead to steric repulsion as the -(C=O)-O-(C=O)- fragment is on the opposite face to the -CH2-CH2- bridge. However the shorter distance does indicates secondary orbital overlap is more likely in this case. This is discussed later on.
Frequency analysis
By looking at the previous output file, we can see the vibrational modes for the endo transition state. These are shown in the figures below.

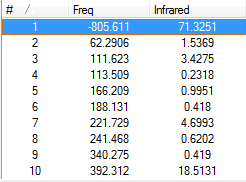
This vibration is animated in the figure below.
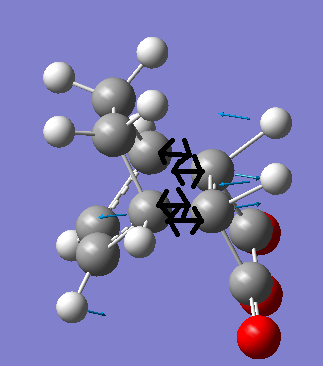
From this image (left) it is clear the vibration corresponds to the Diels Alder reaction between Maleic Anhydride and cyclohexa-1,3-diene.
HOMO analysis
This figures below show the HOMO of the endo transition state.

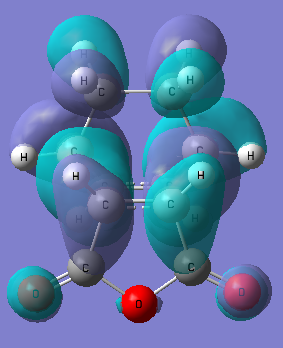
It can be seen from figure 71 that there is little interaction between the carbonyl C atoms and the cyclohexa-1,3-diene fragment of the molecule. This suggests secondary orbital overlap is not apparent in this case. This is discussed further in the next section.
Relative energies of the exo and endo transition states and further dicussion
The table below shows the relative energies and energy difference between the exo and endo transition states for this reaction.
| Conformation | Energy / Hartees | Energy / kJ/mol | Energy difference / kJ/mol |
|---|---|---|---|
| Exo | -0.0505 | -132.58776 | 2.888 |
| Endo | -0.0516 | -135.47581 |
The above table shows the exo structure is higher in energy than the endo structure. This can be rationalised by both steric interactions and secondary orbital overlap. These two factors are discussed below.
There is a large structural difference between the exo and endo structures. For the exo, the Maleic Anhydride fragment is on the same side of the molecule (syn) as the CH2-CH2 bridging group. This would lead to a large amount of steric strain in the structure. In comparison for the endo structure, the Maleic Anhydride fragments in of the opposite side of the molecule (anti). This positioning relieves the steric strain between the bridging group and the Maleic Anhydride fragment. In both cases the geometry/positioning of the cyclohexa-1,3-diene fragments remains the same.
The above table shows the exo transition state is higher in energy. This would be expected due to the steric strain in the exo structure between the bridging CH2CH2 group and the Maleic Anhydride as previously discussed.
Secondary orbital overlap favour the endo transition state in this case. This is due to the overlap between p orbitals on C atoms of the Maleic Anhydride and Cyclohexa-1,3-diene fragments on approach to form the endo transition state. This favours the formation of the endo transition state, therefore stabilising the formation of the endo reaction product. We would not expect secondary orbital overlap for the exp transition state as the carbonyl C atoms are not in the correct orientation with respect to the C=C areas of the cyclohexa-1,3-diene. This emans secondary orbital overlap cannot occur between these regions to further stabilise the transition state.
However secondary orbital overlap is hard to confirm from the HOMO diagrams, as both exo and endo structures show a similar level of overlap. This suggests if the secondary orbtial overlap does stabilise the endo transitions state, it is not apparent from the HOMO's of the exo and endo transition state structures.
The effect of sterics vs. secondary orbital overlap is discussed in literature[2].
Structure Comparison
For both structures the partially formed bonds are longer than an expected C-C bond length[1]. This supports that they are transition states and not fully optimised product states. As previously discussed the exo and endo structures differ by the relative orientation of the Maleic Anhydride and cyclohexa-1,3-diene structures.
References
- ↑ 1.0 1.1 1.2 G. Schultza and I. Hargittai, Conformational investigation of gaseous 1,5-hexadiene by electron diffraction and molecular mechanicsDOI:10.1016/0022-2860(94)09007-C
- ↑ M. A. Fox, R. Cardona, N. J. Kiwiet, Steric effects vs. secondary orbital overlap in Diels-Alder reactions. MNDO and AM1 studiesDOI:10.1021/jo00384a016
