Rep:Mod:ek1813 MgO
Introduction
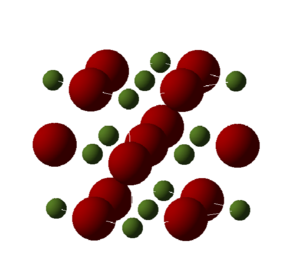
Magnesium oxide, is a naturally occurring mineral composed of and made up in a lattice that is held together through ionic bonding. The lattice structure is a face centred cubic (FCC) lattice structure and can be described with a periodic motif that is made up of a repeated unit cell. Below in figures 1, 2 and 2a it is possible to compare the primitive and conventional MgO cells. The primitive cell is the most basic, and an infinite lattice can be made by applying the same symmetry operation to the primitive unit cell. The conventional cell is most often used as it is easier to visualise the atoms and it is possible to see the face centred cubic structure of the MgO crystal. As the unit cell contains all the information needed to elucidate the structure of the MgO crystal it can be used in computer simulations to calculate physical properties of the crystal structure. It is of great importance to understand the physical and structural properties of MgO as it has many uses from the medicinal to the construction industry.In this case, the phonon dispersion of the MgO crystal was calculated, as well as the free energy of the crystal and the thermal expansion of the crystal as the temperature was increased. The quasi harmonic approximation (QHA) and molecular dynamics (MD) models were used to calculate the thermodynamic properties of the crystal.


29/01/2016 Elisabeth Koninx
Methodology
RedHat Linux was used as the platform to run the computational simulations and DL Visualize (DLV) was used as a general purpose graphical user interface to model the output information. It has a number of quantum mechanical and emperical simulation codes, one of which being General Utility Lattice Program (GULP) which was used to calculate the thermodynamic properties of the crystal.
Two methods were used to calculate the thermodynamic properties of the MgO crystal: the Quasi Harmonic Approximation and Molecular dynamics. QHA assumes that the system can be described as a collection of harmonic oscillators where the vibrations of each harmonic oscillator is independent and does not interact with other oscillations. Using the QHA, one can calculate the complete free energy of the system: [1] Where A is the Helmholtz free energy, U is the internal energy, is the reduced planck's constant, is the frequency of the vibration, T is temperature and is Boltzmann's constant. The vibrational modes are calculated using a simple harmonic oscillator, where the equilibrium bond displacements are adjusted to minimise the free energy. Molecular dynamics simulation on the other hand is based on Newton's second law: . Therefore, if the forces applied on the atoms are known, the accelerations of the atoms can be found and thus their trajectories. The trajectories provide information on the properties of the system. This is a deterministic method, meaning that the system state can be predicted at any time as long as the positions and velocities of the atoms are known.[2] Neither method is perfect to calculate the thermodynamic properties of the system and their limitations will be discussed.
Results and Discussion
Calculating the Internal Energy and Lattice Parameter of an MgO Crystal from QHA
The code GULP was used to calculate the free energy and lattice parameter of the MgO crystal. At 300 K, the Helmholtz free energy, per unit cell. The lattice parameter of the primitive cell was equal to 2.11 Å. A simple conversion using Pythagoras' Theorem gives the lattice parameter a = 4.21 Å for the conventional cell. These values agree with the literature values.[3]
Lattice Vibrations: Computing the Phonons using QHA
A phonon is a quantum unit of vibrational energy that can travel through a material. There are two types of phonons that can propogate through solids: acoustic and optical phonons. Acoustic phonons converge to . Optical phonons occur when there is more than one atom in the unit cell, which is the case for MgO, and do not converge to . They are called "optical" as these modes of phonons are usually easily excited by light.[4] Below in figure 3, it is possible to see the phonon dispersion of MgO at 300 K. We can see both acoustic and optical phonons.

The phonon density of states (DOS) is another property that can be calculated for the MgO crystal. The density of states is the number of available states at each k value. Therefore, if you select a certain k-value and move up in wave-number, you can calculate the DOS by counting the number of phonon branches you encounter. As a result, for the grid size of 1x1x1 the DOS can easily be determined from the dispersion curve. By comparing the two figures 3 and 4, we can see that the DOS corresponds to the L k-value as four phonon lines cross the L k-value. Two peaks in the DOS graph have double the intensity due to the four acoustic lines that converge to two acoustic lines.
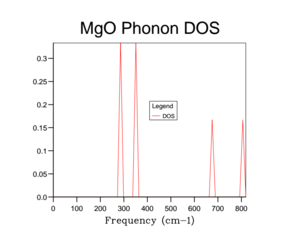
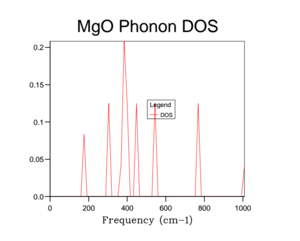
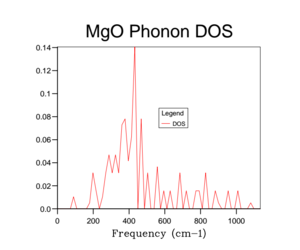
Unfortunately the DOS for the 1x1x1 only samples one k-value and so this only gives a rather crude approximation for the density of states available in MgO at 300 K. Therefore it is necessary to increase the overall grid size in order to get a more accurate description of the total DOS. Below are a variety of DOS graphs calculated using different grid sizes. As the grid size increases, the phonon DOS becomes much clearer and smoother. A grid size of 4x4x4 provides a general structure of the phonon DOS, however it still goes to zero at places where it shouldn't. The difference between the 10x10x10 and the 25x25x25 DOS is that the latter is smoother. There is no difference between the 25x25x25 and then 50x50x50 DOS graph and so a grid size of 25x25x25 was used as the optimal grid size for all further calculations to save computational time. The DOS graphs look as you would expect them to based on the phonon dispersion: at there is the largest amount of states, which quickly tapers off as we approach . As the wave-number increases the DOS tapers of slower as there are still phonon energy states available, however not as much as around .

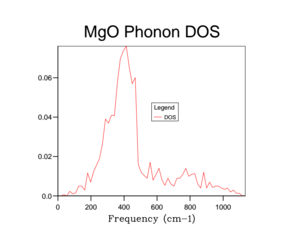
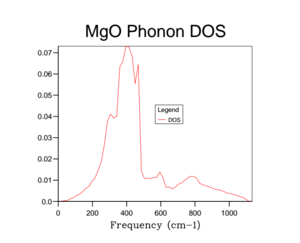
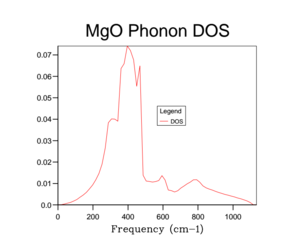
This optimal grid size of 25x25x25 would be appropriate for a similar calculation on CaO. This is because CaO, has a similar lattice parameter size (a = 4.80 angstrom)[5] and is also FCC. On the other hand, the MgO optimal grid size would not be suitable for the zeolite faujasite. This is because it has a lattice parameter of a = 24.2-25.1 angstrom.[6] This means that the unit cell of faujasite is much larger than MgO and therefore it will have a much smaller volume in the reciprocal space and so the optimal grid size will be smaller. Lithium metal has a smaller lattice parameter (a = 3.49 angstrom) and has a body centred cubic motif. Therefore in reciprocal space, the unit cell will have a larger volume and so needs a larger grid size to calculate the DOS to the same degree of accuracy.
Lattice Vibrations: Computing the Free Energy using QHA
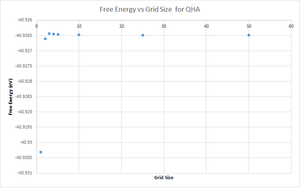
Increasing the grid size, also has an effect on the free energy calculation of the system. As can be seen below from figure 11, increasing the grid size allows the free energy to converge on to a single value. A grid size of 50x50x50 gives a free energy value of A = -40.926483 eV. A grid size of 3x3x3 allows the free energy to be calculated to 1 meV (A = -40.926432 eV), a grid size of 4x4x4 allows the free energy to be calculated to 0.5 meV (A = -40.926450 eV) and a grid size of 5x5x5 allows the free energy to be calculated to 0.1 meV (A = -40.926463 eV).
Smaller grid sizes over-estimate the free energy of the system, while once a grid size of 3x3x3 is reached the free energies converge.
Again, the optimal grid sizes for CaO, faujasite and lithium metal would be the same as mentioned before for the same reasons. However, as the inter-atomic potentials between the atoms have changed this is likely to have an effect on the equilibrium bond distance and thus the free energy values are likely to be different and so the optimal grid size may be different.
Thermal Expansion of MgO: Simulation using QHA and MD
Finally, the free energy as a function of temperature can be computed and the MD model can be compared with the QHA model as can be seen below in figure 12.

Based on the graph it is possible to see that the MD model follows a positive linear trend while the QHA model follows an approximate negative non-linear trend. These trends can be explained based on the fundamental principles that make up each theory. The MD model predicts a linear increase of the free energy with temperature as it is based on Newtonian mechanics: where and f is the number of degrees of freedom in the system, N is the number of particles, k is the Boltzmann constant and T is the temperature. This equation illustrates that the energy is directly proportional to the temperature. Conversely, for the QHA model the free energy decreases non-linearly. This is due to the fact that the free energy A is calculated using a simple harmonic model with the equation: As can be seen, the free energy depends on the vibrational frequency which is harmonic in nature. So at low vibrational energies the free energy appears to depend quadratically on temperature.
At 300 K, the free energy was calculated to be with QHA and for MD. When comparing to literature () [7]we can see a large discrepancy between the calculated and experimental values. This is due to the assumptions and limitations of the two models which are discussed below. However between the two calculated values there is good agreement, therefore as experimental methods we can say that the QHA and MD models are precise but inaccurate.
The lattice constant vs temperature using the QHA model was also plotted to give the following graph:
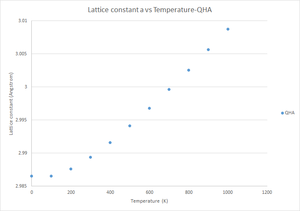
From the graph it is possible to see that using the QHA model, the lattice constant increases quadratically with temperature.
The thermal expansion coefficient is an intrinsic value of a material which is dependent on temperature. The thermal volumetric expansion due to temperature was calculated using both QHA and MD and a plot of volume expansion vs temperature can be seen below. Note that for the MD calculations a MgO supercell was used which was made up of 32x32x32 conventional cells. As a result, the output volumes were divided by 32 in order to compare the QHA and MD results. Figure 13 illustrates that the QHA has a non-linear expansion as temperature increases, however once past the temperature of 400 K, this can be approximated as linear. The MD follows a linear positive trend. Again, the differences in trend is due to the fundamental principles which underlie the two theories.
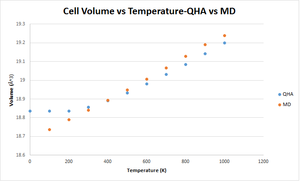
The thermal expansion coefficient can be calculated as: . Thus, the thermal expansion coefficient can be calculated by obtaining the gradient of the linear portion of each graph and then dividing by the initial volume of the cell. For QHA and for MD . This is similar to the literature value of which was measured at 273 K.[8]
Again, there is an observable difference between the two models at low temperatures. QHA takes into account the zero point energy of the vibrations and so can be applied at low temperatures when quantum behaviour begins to dominate the properties of the system. MD is more suited to calculations at higher temperatures where classical behaviour begins to dominate, as the model itself is based on classical mechanics. It is important to note that the two models cannot be used as the temperature increases above the melting point of MgO. This is due to the fact that in the liquid form, the structure can no longer be described as an ordered infinite periodic lattice and so the concept of the unit cell breaks down. Additionally, the QHA model does not take into account the anharmonicity that arises at high temperatures, which is one of its main approximations. This means that as the temperature approaches the melting point, QHA will continue to model the vibration of bonds at extreme amplitudes where in reality the bond would dissociate. Finally, a limitation of the of the MD model is that as the system size increases, if the same order of accuracy were to be used as in this report, the computational time becomes very expensive. Thus, compromises between accuracy and computational time need to be made.
The thermal expansion arises from the increase in vibrational amplitudes in the crystal. As a result, two atoms may become very close which causes a large unfavourable increase in energy. Therefore, in order to minimise the energy of these unfavourable states, the equilibrium bond distances change. This changes the motif of the primitive cell and thus the cell volume.[9]
In a diatomic molecule with an exactly harmonic potential, the bond length would not increase with temperature due to the symmetry of the harmonic potential. However, in the QHA the bond length increases with temperature because the atoms prefer to be at greater distance from each other as the repulsion is so great when they are close together.
Conclusion
This experiment investigated two different models used to calculate the thermodynamic properties of MgO. It was found that at low temperatures the quasi-harmonic approximation is more applicable to calculate the thermodynamic properties because it takes into account quantum effects. At high temperatures the molecular dynamics simulation is more applicable to calculating thermodynamic properties as the system becomes more classical in nature. However, as the system approaches the melting point of MgO both models break down as QHA fails to model bond dissociation and the MD would break down as the liquid can not be modelled with long range periodic structure. Neither model though could accurately predict the experimental thermodynamic properties to the same order of magnitude.
References
- ↑ R. Wentzcovitch, The Quasi Harmonic Approximation, University of Minnesota, Minnesota, USA, n/a.
- ↑ EMBnet. Theory of Molecular Dynamics Simulations, 2016, http://www.ch.embnet.org/MD_tutorial/pages/MD.Part1.html [Accessed: 28/01/2016].
- ↑ K. Parlinski, J. Łażewski and Y. Kawazoe, Journal of Physics and Chemistry of Solids, 2000, 61, 87-90 (DOI:http://dx.doi.org/10.1016/S0022-3697(99)00226-7).
- ↑ Encyclopedia Britannica. Phonon, 2016, http://www.britannica.com/science/phonon [Accessed: 28/01/2016].
- ↑ II-VI and I-VII Compounds; Semimagnetic Compounds, ed. O. Madelung, U. RÃssler and M. Schulz, Springer Berlin Heidelberg, Berlin, Heidelberg, 1999, p. 1-3.
- ↑ J. Kaduk and J. Faber, Rigaku J, 1995, 12, 14.
- ↑ P. W. Atkins; J. De Paule, Atkins’ Physical Chem- istry, Oxford University Press, Oxford, ninth edition, 2010, Resources section, Table 2.8, 923.
- ↑ Crystran Ltd. Magnesium Oxide (MgO), 2012, http://www.crystran.co.uk/optical-materials/magnesium-oxide-mgo [Accessed: 28/01/2016].
- ↑ M. Oliver and S. Cranford. Thermal expansion, 2009, http://web.mit.edu/mbuehler/www/SIMS/Thermal%20Expansion.html [Accessed: 28/01/2016].
