Rep:Mod:de403e6c-ea35-4dd5-aec1-fd7e3c51f158
Part 1: Basic optimisations and the effect of metals and ligands on bond lengths
A variety of basic calculations and experimentation have been conducted on BH3 and a number of similar molecules, namely BBr3 and GaBr3. As part of this, energies have been calculated at a variety of optimisation levels. The overall aim is to explore the various facilities available as part of the Gaussian and GaussView suite, in addition to investigating the effect that ligands and metals have on the bond lengths of ML3 structures.
To begin, the molecules of choice need to be optimised to energy minima so that the bond lengths resemble the molecule's reality.
Optimisation of BH3
BH3 was plotted in GaussView and the structure altered to have bonds 1.54, 1.55, and 1.56Å, so breaking the symmetry of the molecule. An optimisation was then conducted as follows:
- Method: B3LYP
- Basis set: 3-21G
- Calculation type: FOPT
The optimisation completed in 55.0 seconds. Analysis of the log file yielded the following information:
File Name		PK_BH3_OPT
File Type		.log
Calculation Type	FOPT
Calculation Method	RB3LYP
Basis Set		3-21G
Charge			0
Spin			Singlet
E(RB3LYP)		-26.46226429	 a.u.
RMS Gradient Norm	0.00008851	 a.u.
Imaginary Freq
Dipole Moment		0.0003		Debye
Point Group		CS
Job cpu time:		0 days  0 hours  0 minutes 55.0 seconds.
The molecule was confirmed to converge.
        Item               Value     Threshold  Converged?
Maximum Force            0.000220     0.000450     YES
RMS     Force            0.000106     0.000300     YES
Maximum Displacement     0.000919     0.001800     YES
RMS     Displacement     0.000447     0.001200     YES
Predicted change in Energy=-1.672479D-07
Optimization completed.
   -- Stationary point found.
                          ----------------------------
                          !   Optimized Parameters   !
                          ! (Angstroms and Degrees)  !
--------------------------                            --------------------------
! Name  Definition              Value          Derivative Info.                !
--------------------------------------------------------------------------------
! R1    R(1,2)                  1.1944         -DE/DX =   -0.0001              !
! R2    R(1,3)                  1.1947         -DE/DX =   -0.0002              !
! R3    R(1,4)                  1.1948         -DE/DX =   -0.0002              !
! A1    A(2,1,3)              119.9983         -DE/DX =    0.0                 !
! A2    A(2,1,4)              119.986          -DE/DX =    0.0                 !
! A3    A(3,1,4)              120.0157         -DE/DX =    0.0                 !
! D1    D(2,1,4,3)            180.0            -DE/DX =    0.0                 !
--------------------------------------------------------------------------------
Strangely, despite apparent convergence, the derivative for the displacements had not reached zero. It was decided not to attempt to rectify this as an additional optimisation would be run shortly after, and any concern from lack of convergence can be had at that point.
The non-D3h point group was somewhat surprising considering the apparent symmetry in the molecule. To verify, all the bond lengths and angles were inspected and reported as follows:
- B-H bond lengths (Å): 1.9445 (H2 B1), 1.9467 (H3 B1), 1.9480 (H4 B1)
- H-B-H bond angles (°): 119.986 (H2 B1 H4), 120.016 (H4 B1 H3), 119.998 (H2 B1 H3)
There is quite a significant amount of variance between the bond lengths and angles, explaining the lack of D3h group expected. The molecule is symmetric up to 3dp in the bond lengths and 1° in the angles. A superior optimisation is so required.
A second optimisation was run on the optimised structure. The parameters used are as follows;
- Method: B3LYP
- Basis set: 6-31G(d,p)
- Calculation type: FOPT
The charge was set to 0 and the multiplicity as singlet - this was no change to what was originally specified, but was double checked at this point.
Once again, convergence was confirmed.
        Item               Value     Threshold  Converged?
Maximum Force            0.000012     0.000450     YES
RMS     Force            0.000008     0.000300     YES
Maximum Displacement     0.000061     0.001800     YES
RMS     Displacement     0.000038     0.001200     YES
Predicted change in Energy=-1.068331D-09
Optimization completed.
   -- Stationary point found.
                          ----------------------------
                          !   Optimized Parameters   !
                          ! (Angstroms and Degrees)  !
--------------------------                            --------------------------
! Name  Definition              Value          Derivative Info.                !
--------------------------------------------------------------------------------
! R1    R(1,2)                  1.1923         -DE/DX =    0.0                 !
! R2    R(1,3)                  1.1923         -DE/DX =    0.0                 !
! R3    R(1,4)                  1.1923         -DE/DX =    0.0                 !
! A1    A(2,1,3)              120.0007         -DE/DX =    0.0                 !
! A2    A(2,1,4)              119.9938         -DE/DX =    0.0                 !
! A3    A(3,1,4)              120.0055         -DE/DX =    0.0                 !
! D1    D(2,1,4,3)            180.0            -DE/DX =    0.0                 !
--------------------------------------------------------------------------------
This time, all gradients have reached zero, hence despite the concern had earlier about the non-zero gradients, there is no issue with convergence when investigating the final conformation of the molecule.
The data obtained from the log file is as follows:
File Name		PK_BH3_OPT_631GDP
File Type		.log
Calculation Type	FOPT
Calculation Method	RB3LYP
Basis Set		6-31G(d,p)
Charge			0
Spin			Singlet
E(RB3LYP)		-26.61532361	 a.u.
RMS Gradient Norm	0.00000706	 a.u.
Imaginary Freq
Dipole Moment		0.0001	 	Debye
Point Group		CS
Job cpu time:		0 days  0 hours  0 minutes 16.0 seconds.
Disappointingly the point group was still found to be CS. Again, all the bond lengths and angles were reported and are as follows:
- B-H bond lengths (Å): 1.19232 (H2 B1), 1.19231 (H3 B1), 1.19231 (H4 B1)
- H-B-H bond angles (°): 119.994 (H2 B1 H4), 120.005 (H4 B1 H3), 120.001 (H2 B1 H4)
This time, the bond angles and lengths are much more in agreement, but not yet identical as was expected. Bond lengths are in agreement up to 5dp, but bond angles again 1°. It is unusual to see a dipole moment in a molecule as symmetric as this, however the minor imbalance in the molecule reported above likely leads to a minor dipole moment. CRC notes the experimental bond length as 1.1900Å[1] which is quite close to what has been computed - the basis set provides an excellent approximation for this molecule. The difference between the computed and experimental bond lengths in the first optimisation is much larger (0.8Å), so vindicating the decision to perform a second optimisation.
Optimisation of GaBr3
GaBr3 was plotted in GaussView and the symmetry fixed to D3h within 0.00001 tolerance. Optimisation was conducted on the HPC to the LanL2DZ basis set (providing Los Alamos ECP pseudo-potentials on all atoms in the system).
- Method: B3LYP
- Basis set: LanL2DZ
- Calculation type: FOPT
Details from the log file are reported below:
File Name		PK_GABR3_OPT_LANL2DZ
File Type		.log
Calculation Type	FOPT
Calculation Method	RB3LYP
Basis Set		LANL2DZ
Charge			0
Spin			Singlet
E(RB3LYP)		-41.70082783	 a.u.
RMS Gradient Norm	0.00000016	 a.u.
Imaginary Freq
Dipole Moment		0.0000	 	Debye
Point Group		D3H
Job cpu time:		0 days  0 hours  0 minutes 13.9 seconds.
This calculation can be viewed on Dspace: DOI:10042/26081 .
Convergence was again verified:
        Item               Value     Threshold  Converged?
Maximum Force            0.000000     0.000450     YES
RMS     Force            0.000000     0.000300     YES
Maximum Displacement     0.000003     0.001800     YES
RMS     Displacement     0.000002     0.001200     YES
Predicted change in Energy=-1.282684D-12
Optimization completed.
   -- Stationary point found.
                          ----------------------------
                          !   Optimized Parameters   !
                          ! (Angstroms and Degrees)  !
--------------------------                            --------------------------
! Name  Definition              Value          Derivative Info.                !
--------------------------------------------------------------------------------
! R1    R(1,2)                  2.3502         -DE/DX =    0.0                 !
! R2    R(1,3)                  2.3502         -DE/DX =    0.0                 !
! R3    R(1,4)                  2.3502         -DE/DX =    0.0                 !
! A1    A(2,1,3)              120.0            -DE/DX =    0.0                 !
! A2    A(2,1,4)              120.0            -DE/DX =    0.0                 !
! A3    A(3,1,4)              120.0            -DE/DX =    0.0                 !
! D1    D(2,1,4,3)            180.0            -DE/DX =    0.0                 !
--------------------------------------------------------------------------------
All gradients have reached zero, so the molecule has fully converged.
Bond lengths were 2.35018Å for all bonds, and all angles were exactly 120°. Analysis of the CRC Handbook states[1] an experimental bond length of 2.249Å, 0.1Å is not an insignificant difference, but is reasonable considering the rather basic basis set used.
Optimisation of BBr3
As a further investigation into pseudo-potentials, a molecule of BBr3 was optimised, with full control on the basis sets used on each atom. Boron was subject to 6-31G(d,p), and the bromine atoms LanL2DZ. Calculation was run on the HPC with an overall DFT B3LYP function. The results can be seen online: DOI:10042/26079 Summary data is as follows, according to the log file:
File Name		PK_BBR3_OPT_GEN
File Type		.log
Calculation Type	FOPT
Calculation Method	RB3LYP
Basis Set		Gen
Charge			0
Spin			Singlet
E(RB3LYP)		-64.43644897	 a.u.
RMS Gradient Norm	0.00001048	 a.u.
Imaginary Freq
Dipole Moment		0.0003		 Debye
Point Group		CS
Job cpu time:		0 days  0 hours  0 minutes 20.0 seconds.
Convergence was once again checked and found to indeed converge, with all parameters reaching a stationary point:
        Item               Value     Threshold  Converged?
Maximum Force            0.000021     0.000450     YES
RMS     Force            0.000011     0.000300     YES
Maximum Displacement     0.000115     0.001800     YES
RMS     Displacement     0.000063     0.001200     YES
Predicted change in Energy=-2.469464D-09
Optimization completed.
   -- Stationary point found.
                          ----------------------------
                          !   Optimized Parameters   !
                          ! (Angstroms and Degrees)  !
--------------------------                            --------------------------
! Name  Definition              Value          Derivative Info.                !
--------------------------------------------------------------------------------
! R1    R(1,2)                  1.9339         -DE/DX =    0.0                 !
! R2    R(1,3)                  1.934          -DE/DX =    0.0                 !
! R3    R(1,4)                  1.934          -DE/DX =    0.0                 !
! A1    A(2,1,3)              120.0004         -DE/DX =    0.0                 !
! A2    A(2,1,4)              119.9975         -DE/DX =    0.0                 !
! A3    A(3,1,4)              120.0021         -DE/DX =    0.0                 !
! D1    D(2,1,4,3)            180.0            -DE/DX =    0.0                 !
--------------------------------------------------------------------------------
Once again, there is a lack of symmetry in the optimised molecule, this time the molecule was not configured to have a forced D3h symmetry. This can be seen from the parameters below:
- Bond lengths (Å): 1.93393 (B1 Br2), 1.93397 (B1 Br3), 1.93401 (B1 Br4)
- Bond angles (°): 119.997 (Br4 B1 Br2), 120.000 (Br2 B1 Br3), 120.002 (Br3 B1 Br4)
The rather large dipole (compared to the 0 it should be) is likely a result of the slightly elongated B1-Br4 bond, making a net dipole in the molecule. As Br is more electronegative than H, this effect is more pronounced here than it is in BH3. The CRC handbook notes[1] the bond length being 1.893Å, which does not exhibit a huge range from what is calculated here, showing this was a good choice of basis set. Further investigation could be made into alternative basis sets to see if a closer value is obtained.
Summary
In conclusion, all the molecules mentioned previously have been optimised, and the bond lengths have been reported below and compared.
| Molecule | Bond lengths (M-L) Å | ||
|---|---|---|---|
| BH3 | 1.19232 | 1.19231 | 1.19231 |
| GaBr3 | 2.35018 | 2.35018 | 2.35018 |
| BBr3 | 1.93393 | 1.93397 | 1.93401 |
An initial observation is the lack of equality in bond lengths for the two boron molecules. This is not an effect of the boron, but rather the nature of the calculation used. The gallium molecule was configured to force the stereochemistry as D3h, and hence Gaussian ensured that bond lengths are identical to create this symmetry. Thus no conclusions can be drawn from this difference.
It is possible to draw some conclusions from the difference in magnitude between the three molecules. The gallium molecule has a significantly larger bond length than either of the boron molecules - it is thought that this is due to the larger atomic radius of gallium compared to boron (one is in group 4, the other is in group 2), which, by necessity of ensuring the nuclei do not clash with each other, leads to a increased bond length. This leads to the approximate 0.4Å increase in bond length seen. The increase in bond length is not huge, as the increase in nuclear radius is quite small - hence it still remains quite close to the BBr3. If the same calculation was run on TlBr3, which is further down the group, a much larger bond length would be expected compared to BBr3.
Comparing BH3 and BBr3, we can see how a change in ligand affects the bond length. In this case, the main differences between the two ligands are in terms of the size of the nuclei and their electronegativities. While the increase in atomic radius would increase the bond length (as per the change in metal centre), the rather charge in electronegativity causes quite a large change in the bond length. This is because the electronegative atom will polarise the bond as it draws a larger share of the electron density. As a result, electron density is pulled away from the bond to the bromine atom, and when the electron density in a bond is reduced, the bond is weakened and therefore lengthened. This leads to the very large (0.7Å) increase in bond length observed.
This information also makes it possible to examine the nature of a bond. Two questions related to the work done here have been posed and answered below.
In some structures, GaussView does not draw bonds where we expect. Does this mean there is no bond? Why?
It is reported that GaussView only draws a bond depending on whether the two atoms are close enough for the bond to exist (in addition to the inevitable criteria over whether a bond can exist in a given location - for example if a transition metal has filled its coordination sphere). Hence, even if there is no bond shown, it does not necessarily mean no bond exists.
The existence of a bond depends on a number of criteria, one of which is the length, but other factors must be considered such as whether there is sufficient orbital overlap or whether the antibonding interactions at a given distance outweigh any bonding interactions. Hence, the simple distance criteria that GaussView uses is not sufficient to be absolutely sure if a bond is there or not. To fully ensure if a bond exists, it would be necessary to perform a number of additional calculations, such as investigation of the electron density contour maps and analysis of the molecular orbitals. Only these plots can show whether a bond exists or not, and hence GaussView's approximation is not sufficient proof that a bond does not exist.
What is a bond?
The IUPAC Gold Book defines a chemical bond as[2]:
When forces acting between two atoms or groups of atoms lead to the formation of a stable independent molecular entity, a chemical bond is considered to exist between these atoms or groups.
Models have been built on top of this to describe specific kinds of bonding, the most common of which are:
- Covalent bond, in terms of a bond where each atom in the bond donates one electron, to form a two-electron bond.
- Ionic bond, a bond where negatively charged anions are electrostatically attracted to positively charged cations, leading to a stabilised arrangement compared to the ions being separate.
- Metallic bond, where positive cations of a metal are in a sea of delocalised electrons.
In the latter two cases, electrostatics are involved, and it is this combination of positive and negative charges combined which lead to a very stable and attractive combination, which massively lowers the energy of the system.
For a covalent bond, modern thinking (which also applies to a variety of inorganic compounds too) makes use of molecular orbitals, a combination of bonding and antibonding orbitals being created when atomic orbitals combine. Generally, according to the Klopman-Salem equation[3][4], the bonding orbitals created are of a lower energy than the atomic orbitals they were created from. As a result of this, as these bonding orbitals are filled, the molecule is stabilised, and hence the IUPAC definition of a bond is adhered to.
There are many different ways in which this stabilisation can be created, and the methods discussed here are only a few of them (there may still be other kind of stabilising interactions as yet undiscovered). Hence, it is reasonable to argue that any interaction which causes a stabilising effect in a molecule can be deemed a chemical bond, which the terms 'single' and 'double bond' being associated with interactions of a certain magnitude.
Part 2: Frequencies, vibrations, orbitals and energies
On the optimised structures reported previously, a number of advanced calculations have been performed. Initially, frequency analysis has been conducted to ensure that the energies calculated are minima. Once this has been confirmed, more advanced calculations have been performed to help find out more about the nature of these compounds.
Frequency and vibrational analysis of BH3
Through use of a 6-31G(d,p) frequency analysis of the optimised BH3 structure, it is possible to identify whether a minima has been attained. Initially, the results have been compared to what was obtained from the optimisation, and the frequency results summary from the log file is found below:
File Name           PK_BH3_FREQ_631GDP
File Type           .log
Calculation Type    FREQ
Calculation Method  RB3LYP
Basis Set           6-31G(d,p)
Charge              0
Spin                Singlet
E(RB3LYP)           -26.61532361     a.u.
RMS Gradient Norm   0.00000702       a.u.
Imaginary Freq      0
Dipole Moment       0.0001           Debye
Point Group         CS
Job cpu time:       0 days  0 hours  0 minutes 18.0 seconds.
Other than a minor change in the gradient, the results are the same as was reported previously. Convergence was again confirmed:
         Item               Value     Threshold  Converged?
 Maximum Force            0.000014     0.000450     YES
 RMS     Force            0.000007     0.000300     YES
 Maximum Displacement     0.000089     0.001800     YES
 RMS     Displacement     0.000045     0.001200     YES
 Predicted change in Energy=-1.487544D-09
 Optimization completed.
    -- Stationary point found.
Low frequencies were reported as
Low frequencies --- -25.0305 -12.9079 0.0006 0.0007 0.0009 15.0420
which are outside the range of -15 to +15 cm-1. Hence, the molecule was reoptimised with scf=conver=9 int=ultrafine keywords and a tight convergence to yield the following data in the log file:
File Name           PK_BH3_OPT_TIGHT_631GDP
File Type           .log
Calculation Type    FOPT
Calculation Method  RB3LYP
Basis Set           6-31G(d,p)
Charge              0
Spin                Singlet
E(RB3LYP)           -26.61532360     a.u.
RMS Gradient Norm   0.00000594       a.u.
Imaginary Freq
Dipole Moment       0.0001           Debye
Point Group         CS
Job cpu time:       0 days  0 hours  0 minutes 13.0 seconds.
Convergence was obtained on the optimisation:
         Item               Value     Threshold  Converged?
 Maximum Force            0.000009     0.000015     YES
 RMS     Force            0.000007     0.000010     YES
 Maximum Displacement     0.000053     0.000060     YES
 RMS     Displacement     0.000034     0.000040     YES
 Predicted change in Energy=-7.783630D-10
 Optimization completed.
    -- Stationary point found.
                           ----------------------------
                           !   Optimized Parameters   !
                           ! (Angstroms and Degrees)  !
 --------------------------                            --------------------------
 ! Name  Definition              Value          Derivative Info.                !
 --------------------------------------------------------------------------------
 ! R1    R(1,2)                  1.1923         -DE/DX =    0.0                 !
 ! R2    R(1,3)                  1.1923         -DE/DX =    0.0                 !
 ! R3    R(1,4)                  1.1923         -DE/DX =    0.0                 !
 ! A1    A(2,1,3)              120.0008         -DE/DX =    0.0                 !
 ! A2    A(2,1,4)              119.9938         -DE/DX =    0.0                 !
 ! A3    A(3,1,4)              120.0054         -DE/DX =    0.0                 !
 ! D1    D(2,1,4,3)            180.0            -DE/DX =    0.0                 !
 --------------------------------------------------------------------------------
The frequency calculation was then subsequently run, using the same keywords (but no tight setting). The log file reported the following data:
File Name		PK_BH3_FREQ_TIGHT_631GDP
File Type		.log
Calculation Type	FREQ
Calculation Method	RB3LYP
Basis Set		6-31G(d,p)
Charge			0
Spin			Singlet
E(RB3LYP)		-26.61532360	 a.u.
RMS Gradient Norm	0.00000594	 a.u.
Imaginary Freq		0
Dipole Moment		0.0001	 	Debye
Point Group		CS
Job cpu time:   	0 days  0 hours  0 minutes 19.0 seconds.
This time there was convergence:
         Item               Value     Threshold  Converged?
 Maximum Force            0.000013     0.000450     YES
 RMS     Force            0.000006     0.000300     YES
 Maximum Displacement     0.000086     0.001800     YES
 RMS     Displacement     0.000043     0.001200     YES
 Predicted change in Energy=-1.187652D-09
 Optimization completed.
    -- Stationary point found.
Regrettably the low frequencies were still out of range:
 Low frequencies ---  -19.8568  -17.0127   -9.6394    0.0004    0.0005    0.0007
 Low frequencies --- 1162.9117 1213.0852 1213.1686
At this point the optimisation was conducted again with the same keywords and forcing a D3h symmetry. The log file showed:
File Name		PK_BH3_OPT_FORCED_631GDP
File Type		.log
Calculation Type	FOPT
Calculation Method	RB3LYP
Basis Set		6-31G(d,p)
Charge			0
Spin			Singlet
E(RB3LYP)		-26.61532364	 a.u.
RMS Gradient Norm	0.00000571	 a.u.
Imaginary Freq
Dipole Moment		0.0000	 	Debye
Point Group		D3H
Job cpu time:		0 days  0 hours  0 minutes 13.0 seconds.
with convergence:
         Item               Value     Threshold  Converged?
 Maximum Force            0.000011     0.000015     YES
 RMS     Force            0.000007     0.000010     YES
 Maximum Displacement     0.000045     0.000060     YES
 RMS     Displacement     0.000030     0.000040     YES
 Predicted change in Energy=-7.760436D-10
 Optimization completed.
    -- Stationary point found.
                           ----------------------------
                           !   Optimized Parameters   !
                           ! (Angstroms and Degrees)  !
 --------------------------                            --------------------------
 ! Name  Definition              Value          Derivative Info.                !
 --------------------------------------------------------------------------------
 ! R1    R(1,2)                  1.1923         -DE/DX =    0.0                 !
 ! R2    R(1,3)                  1.1923         -DE/DX =    0.0                 !
 ! R3    R(1,4)                  1.1923         -DE/DX =    0.0                 !
 ! A1    A(2,1,3)              120.0            -DE/DX =    0.0                 !
 ! A2    A(2,1,4)              120.0            -DE/DX =    0.0                 !
 ! A3    A(3,1,4)              120.0            -DE/DX =    0.0                 !
 ! D1    D(2,1,4,3)            180.0            -DE/DX =    0.0                 !
 --------------------------------------------------------------------------------
The frequency calculation was then run again, with the log file yielding:
File Name		PK_BH3_FREQ_FORCED_631GDP
File Type		.log
Calculation Type	FREQ
Calculation Method	RB3LYP
Basis Set		6-31G(d,p)
Charge			0
Spin			Singlet
E(RB3LYP)		-26.61532364
RMS Gradient Norm	0.00000572
Imaginary Freq		0
Dipole Moment		0.0000
Point Group		D3H
Job cpu time:		0 days  0 hours  0 minutes 18.0 seconds.
with convergence:
         Item               Value     Threshold  Converged?
 Maximum Force            0.000011     0.000450     YES
 RMS     Force            0.000006     0.000300     YES
 Maximum Displacement     0.000045     0.001800     YES
 RMS     Displacement     0.000022     0.001200     YES
 Predicted change in Energy=-7.723726D-10
 Optimization completed.
    -- Stationary point found.
This time, the low frequencies were found to be within the allowed range.
 Low frequencies ---  -14.8515  -14.8476  -11.2630    0.0012    0.0162    0.3377
 Low frequencies --- 1162.9477 1213.1209 1213.1211
Vibrations seen were of the symmetry labels A2", E', E', A1', E', E' which matches what the character tables for D3h suggests.
Visual representation of vibrational peaks
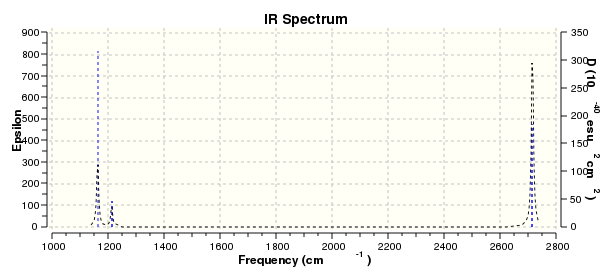
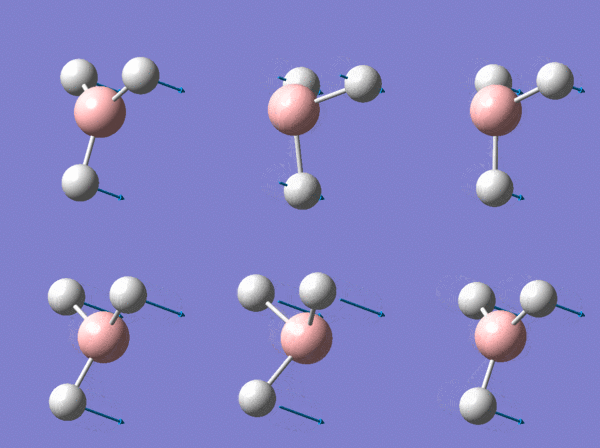
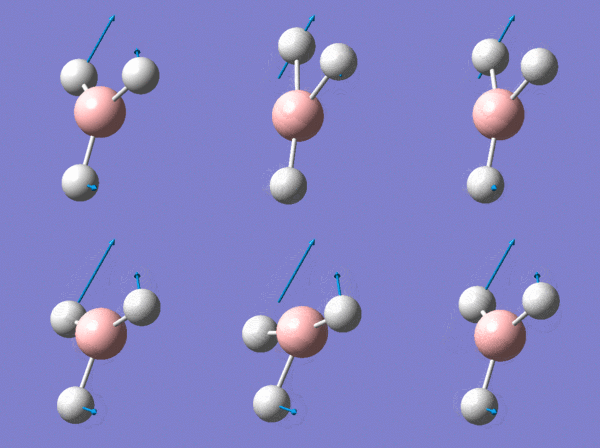
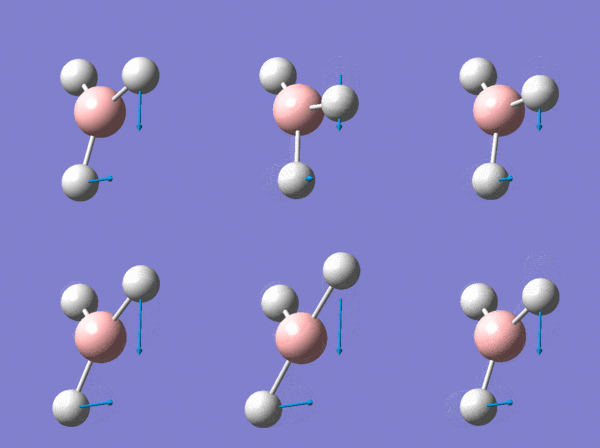
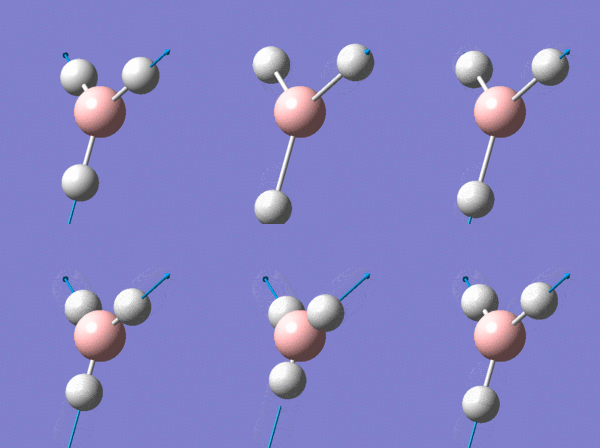
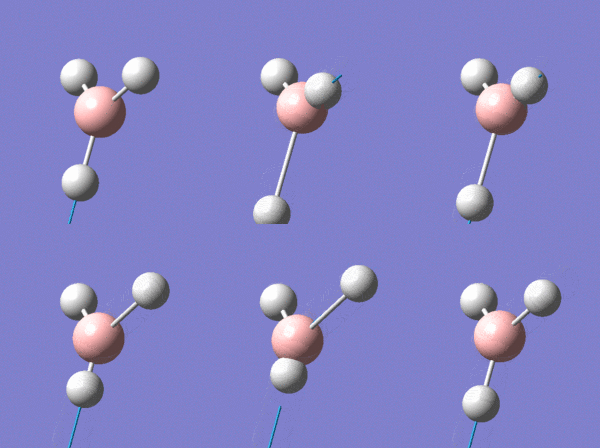
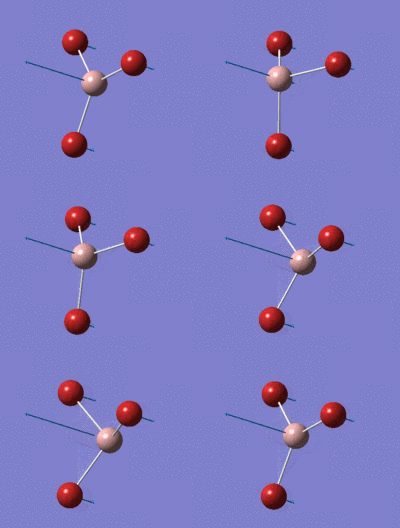
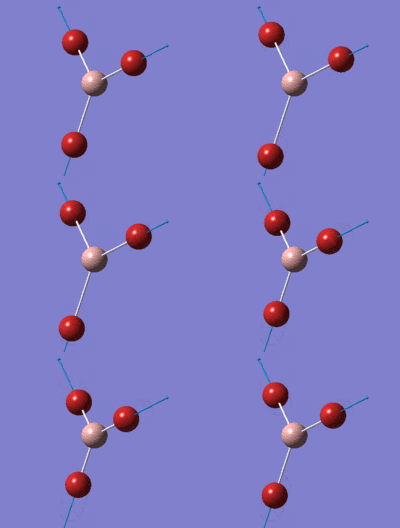
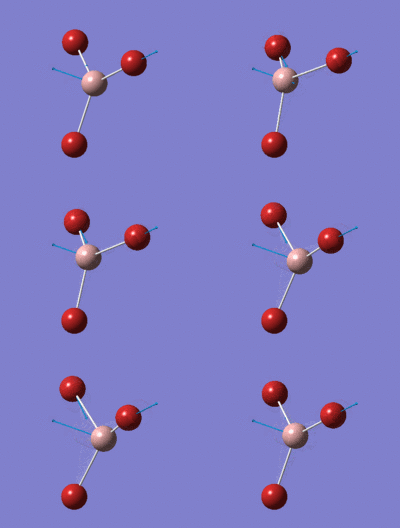
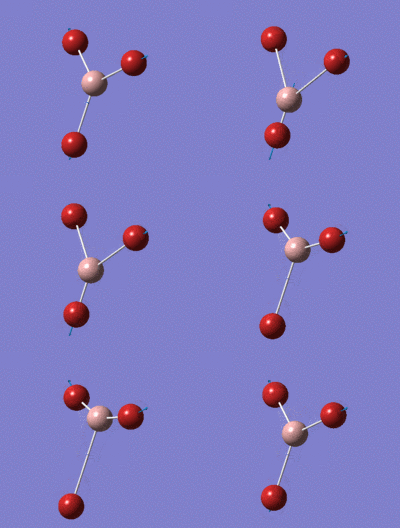
The vibrational peaks can be seen in GaussView and are shown below:
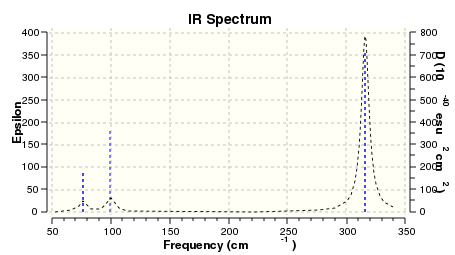
Of note, there are only three peaks in the IR spectrum, despite there being 6 modes. One of these modes has an intensity of 0, and so it will not show up in the IR spectrum. This intensity is zero as the vibration is totally symmetric, which means there is no change in dipole moment and hence is not IR active. This still leaves 2 peaks missing. The peaks with an E' symmetry are defined as such as they are degenerate, and there are 2 pairs of 2 peaks with the same wavenumber. Hence, both peaks will appear superimposed upon eachother (due to their degeneracy), and the intensities will be added together. The result is that only one peak shows for the two modes for the same wavenumber. All missing peaks are therefore accounted for.
Vibrational analysis for GaBr3
Frequency analysis from the optimised structure of GaBr3 was conducted on the HPC and the results are available on Dspace: DOI:10042/26119 .
The summary of the results is as follows.
File Name		PK_GABR3_FREQ_LANL2DZ
File Type		.log
Calculation Type	FREQ
Calculation Method	RB3LYP
Basis Set		LANL2DZ
Charge			0
Spin			Singlet
E(RB3LYP)		-41.70082783	a.u.
RMS Gradient Norm	0.00000011	a.u.
Imaginary Freq		0
Dipole Moment		0.0000	 	Debye
Point Group		D3H
Job cpu time:		0 days  0 hours  0 minutes 12.3 seconds.
Convergence was confirmed
         Item               Value     Threshold  Converged?
 Maximum Force            0.000000     0.000450     YES
 RMS     Force            0.000000     0.000300     YES
 Maximum Displacement     0.000002     0.001800     YES
 RMS     Displacement     0.000001     0.001200     YES
 Predicted change in Energy=-6.142862D-13
 Optimization completed.
    -- Stationary point found.
and all vibrations were found to be in the -15 to 15 cm-1 range:
Low frequencies --- -0.5252 -0.5247 -0.0024 -0.0010 0.0235 1.2010
Low frequencies --- 76.3744 76.3753 99.6982
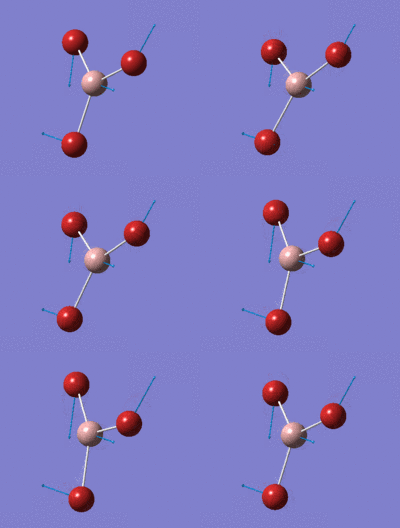
The lowest normal mode is 76.3744cm-1 which corresponds to a combined rocking and scissoring vibration, and is shown in animated form below. This almost has the same energy as the next lowest frequency and is assumed to be degenerate within the boundaries of approximation in the calculation.
Once again there are fewer peaks than modes - this is for the same reason as observed with BH3. The intensity of 0 for the 4th mode is also due to the same reason why the mode with no intensity for BH3 has no intensity.
Comparison to BH3
Whilst all the modes which appear in BH3 also appear in GaBr3 there are a number of significant differences:
- The modes are reordered
- The energies are much reduced for GaBr3
Initially, the intensity and wavenumber of the vibrations for GaBr3 is much smaller than BH3 - this is due to the inverse correlation between nuclei mass and the IR frequency - this is because atoms with a lower mass are easier to move around, and hence need a less energetic photon to be excited. This is likely related to the variance in intensity too. This is reflected in the IR spectra, which show a similar distribution in peaks, but the intensities for the BH3 spectra is much bigger.
Secondly, the reordering of modes is due to the same reason - the more atoms which are moved in a mode, the greater the amount of energy is needed to cause a vibration. Thus the A"2 mode has changed position as a significant increase in the amount of energy needed for this mode to oscillate is needed, more than the energy needed to make the two E' modes below it in terms of energy oscillate (as the Ga atoms in these modes do not move as much).
Otherwise the spectra are quite similar, there is an identical number of peaks with a similar distribution, and all the types of vibration seen in BH3 are also seen in GaBr3 - including identical symmetry labels. Also in both cases, there is a large gap between the A"2 and E' modes, and the other two modes. The higher energy modes in both cases are stretching modes and it may be because in doing so the electron density over the molecule is disrupted (and can potentially lead to bond breakage at long displacements as there is no electron density over the bond), which requires significantly more energy than moving the atom but keeping its displacement fixed.
Discussion
Why must you use the same method and basis set for both the optimisation and frequency analysis calculations?
The method and basis set give the conditions for the calculation used in either the optimisation or frequency analysis, more specifically the approximations used in solving the Schrodinger equation. The effect of this is that the energy you obtain during the optimisation of a molecule is specific to that method and basis set, as the energy depends on the approximations used. GaussView represents this by showing the energy in terms of the basis set and method.
Thus, when you calculate the frequency analysis, you must use the same method and basis set, as we must analyse the molecule and its energy in the same conditions that it exists in - an analogy would be to optimise in chloroform solvent and then do a frequency analysis in water - the system is different. As the approximations would be different if the models and basis sets differ, the frequency analysis would give bogus results - it would be doing a frequency analysis for a specific case on a molecule not of that case. This is especially important as at the level you optimised the molecule to, the energy the molecule reaches will be a minima, but when you then perform the frequency analysis, if you use a different method and basis set, the energy may no longer correspond to a minima, and thus the frequency analysis is meaningless.
What is the purpose of carrying out a frequency analysis?
A frequency analysis is important as it shows whether you have reached an energy minima or maxima. When the gradient is zero, it can either be at the peak or trough of a curve, as at these points the gradient is flat and . We need to know whether we are at a maximum or minimum as, in the nature of an optimisation, we are looking to find the most accurate representation of a molecule's actual state of existance, and molecules always try to minimise their energy.
In contrast, if we are at a maxima, we are at a transition state (as these are always of the highest energy). Whilst there may be times we are interested in a transition state, we are not here, and thus we must verify we are at a minimum. The frequency analysis finds the second derivative of the gradient, which is positive if we are at a minimum, or negative if we are at a maximum. Thus, by performing a frequency analysis, we can see if any of the vibrations are negative, and if none are we can be sure we are at an energy minimum. It is important to ensure we are at a minimum before we discuss results or perform further calculations.
What do the "Low frequencies" represent?
The low frequencies refer to the degrees of vibrational freedom within a molecule. For a molecule with 3 (or more) atoms, this is , which explains why the 4 atom molecules considered previously have 6 low frequencies. Each low frequency refers to one of the vibrational modes for the molecule, which is not necessary IR (or Raman) active, but the molecule would still exhibit this kind of vibration and hence vibrates at that frequency. This is separate to rotational and translational modes of freedom.
Molecular orbital analysis for BH3
Using the optimised and confirmed minima structure obtained earlier, the molecular orbitals for BH3 have been calculated, which also allows for calculation of NBOs.
An energy calculation was run on the HPC using the pop=full,nbo keyword and the results are available on Dspace: DOI:10042/26167 .
The summary is as follows:
File Name		PK_BH3_EGY_631GDP
File Type		.log
Calculation Type	SP
Calculation Method	RB3LYP
Basis Set		6-31G(d,p)
Charge			0
Spin			Singlet
E(RB3LYP)		-26.61532361	 a.u.
RMS Gradient Norm			 a.u.
Imaginary Freq
Dipole Moment		0.0001	 	Debye
Point Group		CS
Job cpu time:		0 days  0 hours  0 minutes  7.4 seconds.
All data appears to be identical to the original energy calculation.
MOs 1-8 were calculated in GaussView and plotted on the MO diagram of BH3 shown below:
Molecular orbital and NBO analysis for ammonia
Ammonia was optimised and then a frequency calculation run as per the previous method, the choice of keywords and symmetry forcing (but to C3v) was needed in order to get the low frequencies within the acceptable range.
For the optimisation, the final data according to the log file is:
File Name           PK_NH3_OPT_631GDP
File Type           .log
Calculation Type    FOPT
Calculation Method  RB3LYP
Basis Set           6-31G(d,p)
Charge              0
Spin                Singlet
E(RB3LYP)           -56.55776873     a.u.
RMS Gradient Norm   0.00000323       a.u.
Imaginary Freq
Dipole Moment       1.8465           Debye
Point Group         C3V
Job cpu time:       0 days  0 hours  0 minutes 27.0 seconds.
and convergence confirmed:
         Item               Value     Threshold  Converged?
 Maximum Force            0.000006     0.000015     YES
 RMS     Force            0.000004     0.000010     YES
 Maximum Displacement     0.000012     0.000060     YES
 RMS     Displacement     0.000008     0.000040     YES
 Predicted change in Energy=-9.846374D-11
 Optimization completed.
    -- Stationary point found.
                           ----------------------------
                           !   Optimized Parameters   !
                           ! (Angstroms and Degrees)  !
 --------------------------                            --------------------------
 ! Name  Definition              Value          Derivative Info.                !
 --------------------------------------------------------------------------------
 ! R1    R(1,2)                  1.018          -DE/DX =    0.0                 !
 ! R2    R(1,3)                  1.018          -DE/DX =    0.0                 !
 ! R3    R(1,4)                  1.018          -DE/DX =    0.0                 !
 ! A1    A(2,1,3)              105.7446         -DE/DX =    0.0                 !
 ! A2    A(2,1,4)              105.7446         -DE/DX =    0.0                 !
 ! A3    A(3,1,4)              105.7446         -DE/DX =    0.0                 !
 ! D1    D(2,1,4,3)           -111.8637         -DE/DX =    0.0                 !
 --------------------------------------------------------------------------------
Low frequencies from the frequency calculation (which differs in energy terms by 0.00000001) log file are:
 Low frequencies --- -0.0138 -0.0030 0.0013 7.0781 8.0927 8.0932
 Low frequencies --- 1089.3840 1693.9368 1693.9368
which show a minima has been obtained. There were no negative frequencies.
Summary table:
File Name             PK_NH3_FREQ_631GDP
File Type             .log
Calculation Type      FREQ
Calculation Method    RB3LYP
Basis Set             6-31G(d,p)
Charge                0
Spin                  Singlet
E(RB3LYP)             -56.55776872     a.u.
RMS Gradient Norm     0.00000322       a.u.
Imaginary Freq        0
Dipole Moment         1.8465           Debye
Point Group           C3
Job cpu time:         0 days  0 hours  0 minutes 15.0 seconds.
with convergence:
         Item               Value     Threshold  Converged?
 Maximum Force            0.000006     0.000450     YES
 RMS     Force            0.000003     0.000300     YES
 Maximum Displacement     0.000013     0.001800     YES
 RMS     Displacement     0.000007     0.001200     YES
 Predicted change in Energy=-1.131338D-10
 Optimization completed.
    -- Stationary point found.
Of concern, the symmetry has become C3, however there has been little change in energy, hence little change in structure, so this is assumed to be a bug in GaussView.
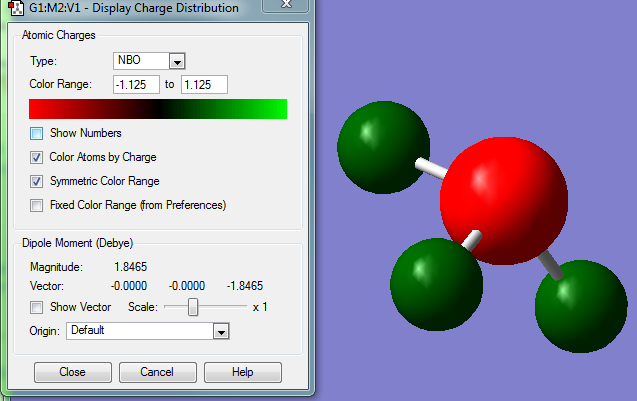
Now being satisfied that a minima has been reached, a MO and NBO calculation was conducted as was done on the BH3 (log file). The NBO was then plotted from -1.125 to 1.125 and is shown below.
Energy calculation summary table:
Ammonia egy
File Name           PK_NH3_EGY_631GDP
File Type           .log
Calculation Type    SP
Calculation Method  RB3LYP
Basis Set           6-31G(d,p)
Charge              0
Spin                Singlet
E(RB3LYP)           -56.55776873     a.u.
RMS Gradient Norm                    a.u.
Imaginary Freq
Dipole Moment       1.8465           Debye
Point Group         C3V
Job cpu time:       0 days  0 hours  0 minutes 10.0 seconds.
As expected, the electronegative nitrogen has a great degree of negative charge - as shown by the red character. The exact charges are -1.125 on the nitrogen and 0.375 on all the protons. The power of NBO for observing the charge density of a molecule is thus seen.
Energy calculations for NH3BH3
Now optimised energies for NH3 and BH3 have been found, it is now possible to calculate the energy for NH3BH3, find the difference between all three components, and therefore find the energy of association. From this point on it is assumed that the keywords used previously during optimisation are always used. Initially an optimisation was conducted at the same level as before and the log file reported:
File Name		PK_NH3BH3_OPT
File Type		.log
Calculation Type	FOPT
Calculation Method	RB3LYP
Basis Set		6-31G(d,p)
Charge			0
Spin			Singlet
E(RB3LYP)		-83.22468909	 a.u.
RMS Gradient Norm	0.00000047	 a.u.
Imaginary Freq
Dipole Moment		5.5646	 	Debye
Point Group		C3V
Job cpu time:		0 days  0 hours  1 minutes 14.0 seconds.
and convergence checked:
         Item               Value     Threshold  Converged?
 Maximum Force            0.000002     0.000015     YES
 RMS     Force            0.000000     0.000010     YES
 Maximum Displacement     0.000007     0.000060     YES
 RMS     Displacement     0.000004     0.000040     YES
 Predicted change in Energy=-1.706880D-11
 Optimization completed.
    -- Stationary point found.
A frequency analysis was then conducted. The log file reported a final energy of -83.22468909, which is identical to what was found in the optimisation, and no frequencies were negative. Low frequencies were in the acceptable range:
 Low frequencies ---   -4.8361   -1.6211   -1.2960    0.0335    0.0539    0.2001
 Low frequencies ---  263.3086  632.9964  638.4686
Other summary data is as follows:
File Name		PK_NH3BH3_FREQ
File Type		.log
Calculation Type	FREQ
Calculation Method	RB3LYP
Basis Set		6-31G(d,p)
Charge			0
Spin			Singlet
E(RB3LYP)		-83.22468909	 a.u.
RMS Gradient Norm	0.00000052	 a.u.
Imaginary Freq		0
Dipole Moment		5.5646	 	Debye
Point Group		C3V
Job cpu time:		0 days  0 hours  0 minutes 48.0 seconds.
and convergence:
         Item               Value     Threshold  Converged?
 Maximum Force            0.000002     0.000450     YES
 RMS     Force            0.000001     0.000300     YES
 Maximum Displacement     0.000012     0.001800     YES
 RMS     Displacement     0.000004     0.001200     YES
 Predicted change in Energy=-1.893142D-11
 Optimization completed.
    -- Stationary point found.
Calculation of association energy
Now that all three components are optimised to the correct level, and are all found as minima, it is possible to find the association energy.
The energies of all 3 components are (in AU):
- E(BH3)=-26.61532361
- E(NH3)=-56.55776873 -83.1730923
- E(NH3BH3)= -83.22468909
- Association energy: -0.0515967
One atomic unit is equal to one Hartree, and the conversion is equal to 1 Hartree = 2625.49962 kJ mol-1[5], which gives a final association or dissociation energy of -135.47 kJ mol-1. This is approximately 40 kJ mol-1 below the enthalpy of formation as reported previously[6]. Considering there are a number of factors not considered in this calculation (for example interactions between the components during the formation or dissocation), the calculation gives a reasonable approximation to the nature of the association process.
References
- ↑ 1.0 1.1 1.2 CRC Handbook of Chemistry and Physics, ed. W. M. Haynes and D. R. Lide, CRC Press, Boca Raton, 93rd edn., 2012
- ↑ A. D. McNaught and A. Wilkinson, in Compendium of Chemical Terminology, Blackwell Scientific Publications, Oxford, 2nd ed., 2012, p. CT07009
- ↑ G. Klopman, J. Am. Chem. Soc., 1968, 90, 223–234
- ↑ L. Salem, J. Am. Chem. Soc. 1968, 90, 543 & 553
- ↑ CODATA 2010
- ↑ Yu. Kh. Shaulov, G. O. Shmyreva, V. S. Tubyanskaya, Zhurnal Fizicheskoi Khimii, 1966, 40, 122

